Sample Category Title
UK Inflation Eases, Focus On Retail Sales
Data from the UK saw the release of the inflation figures. Consumer prices in the UK were seen rising at a slower than expected pace of 2.4%. The median forecasts expected a print of 2.6%. Core inflation was also seen slowing, rising at a pace of 1.9%.
In the Eurozone, headline inflation increased by 2.0% as estimated by the preliminary inflation report but core inflation rate was seen rising at a pace of 0.9%, which was slower than the preliminary estimates of 1.0%.
Data from the U.S. showed that building permits increased 1.27 million missing estimates of 1.33 million while housing starts also moderated at a pace of 1.17 million.
Earlier in the day, Australia's jobs report showed that the unemployment rate held steady at 5.4%. The employment change surged, rising 50.9k during the month, beating estimates of 16.7k.
Looking ahead, the UK's retail sales figures are expected later today. Retail sales are forecast to rise 0.1% on the month. This marks a slowdown following a 1.3% increase the month before.
In the U.S. trading session, the Philly Fed Manufacturing index is expected to rise to 21.6. FOMC member Quarles will be speaking later in the afternoon.
AUDUSD Outook: Aussie Reverses Gains On Upbeat Australian Jobs Data, Driven By Stronger Greenback And Weaker Yuan
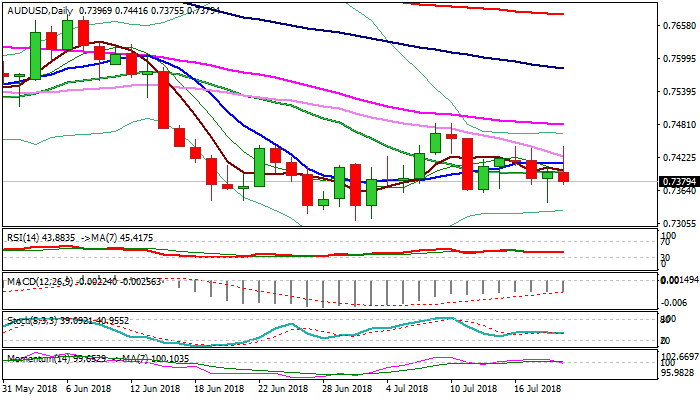
The Australian dollar accelerated lower in early European trading and erased all overnight gains on upbeat Australian jobs data (employment change 50.9K in Jun vs 16.7K f/c and 13.5K in May).
Post-data rally stalled at 0.7441 (former double upside rejection of 16/17 July), with subsequent fall, accelerated by weak Chinese yuan and strong US dollar, confirming strong resistance here and repeated failure to clearly break above falling 30SMA.
Fresh weakness brings daily MA’s back to full bearish setup, as momentum is breaking into negative territory and adding to growing bearish pressure.
Near-term risk turns towards pivots at 0.7360 (11/12 July lows) and 0.7343 (Wednesday’s spike low) break of which would open key support at 0.7310 (02 July low, the lowest from 01 Sep 2017).
Res: 0.7412, 0.7425, 0.7442, 0.7483
Sup: 0.7360, 0.7343, 0.7322, 0.7310
US Futures Trading Soft While Trade Spat Takes Back Seat
- Negations aren't going anywhere between the US and China
- Tariffs could be imposed on nuclear sector- uranium
- WTO and IMF cannot do their job properly
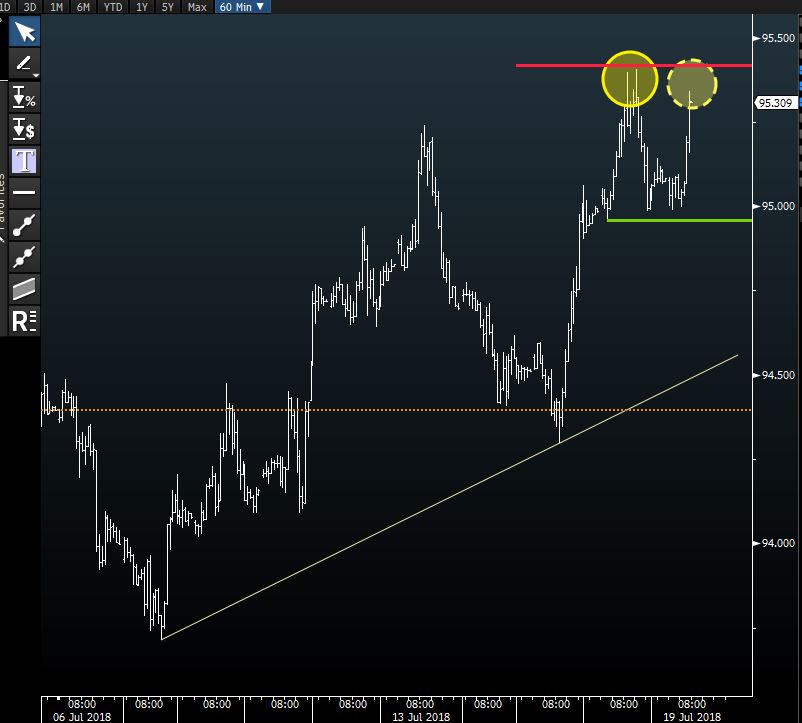
US futures are trading a little soft today. This is despite the fact that the trade spat between the US and China has taken a back seat. The negations aren't going anywhere between the two counties- US and China and investors are underestimating this element. The US relation with the EU is also at its lowest point because of the trade war conflict. If the trade negotiations continue to remain in a stalled phase, we are facing a major problem.
A sector which is worth keeping a close eye on in the coming days is the nuclear energy. Trump administration is weighing in whether uranium imports imposes any threats to national security and if the answer is yes, tariffs would be introduced here as well. As a result of this, we have already seen a rally in US uranium miners but on the other hand, utilities that operate reactors faced some selling pressure. This is because if tariffs are imposed, it means higher input cost. Most of the uranium import is from Canada, Australia, Russia and Kazakhstan.
Of course, this kind of investigation adds more pressure in the International Monetary Fund and the risk elevates further. If the WTO and IMF cannot do their job properly and cannot perform the duties which they are supposed to do, the risk of their dysfunctional is massively high. We think this is the very reason that investors should not take their eyes off when it comes to the trade war and tariff issues.
The reason that we aren't seeing any serious correction or sell off for the US stocks is that the Fed chairman struck an upbeat tone in his two-day testimony. He was confident about the economic health of the country. This made the dollar index to kiss its precious highs once again.
Morgan Stanley Announced Smashing Earnings
Morgan Stanley surprised its shareholders
Trading volume was 1.8 times the 20-day average
The Wall Street giants; investment banks such as Morgan Stanley, surprised its shareholders yesterday by thrashing the street estimates. The fear was these banks will come under pressure due to an increase in the interest rate. But the numbers clearly confirmed that the banks are praising higher volatility which is improving their top line figures. So far this week, the earnings has been better than expected.
The company had a profit of $1.25 a share on a comparable basis for the latest quarter, versus the estimate for net income of $1.11, and it had sales of $10.6 billion, versus $10.1 billion. The company reported on July 18.
Trading volume was 1.8 times the 20-day average. Morgan Stanley's move compares with the 1 percent rise in the Russell 3000 Financial Services Index and the 0.2 percent gain in the S&P 500 Index.
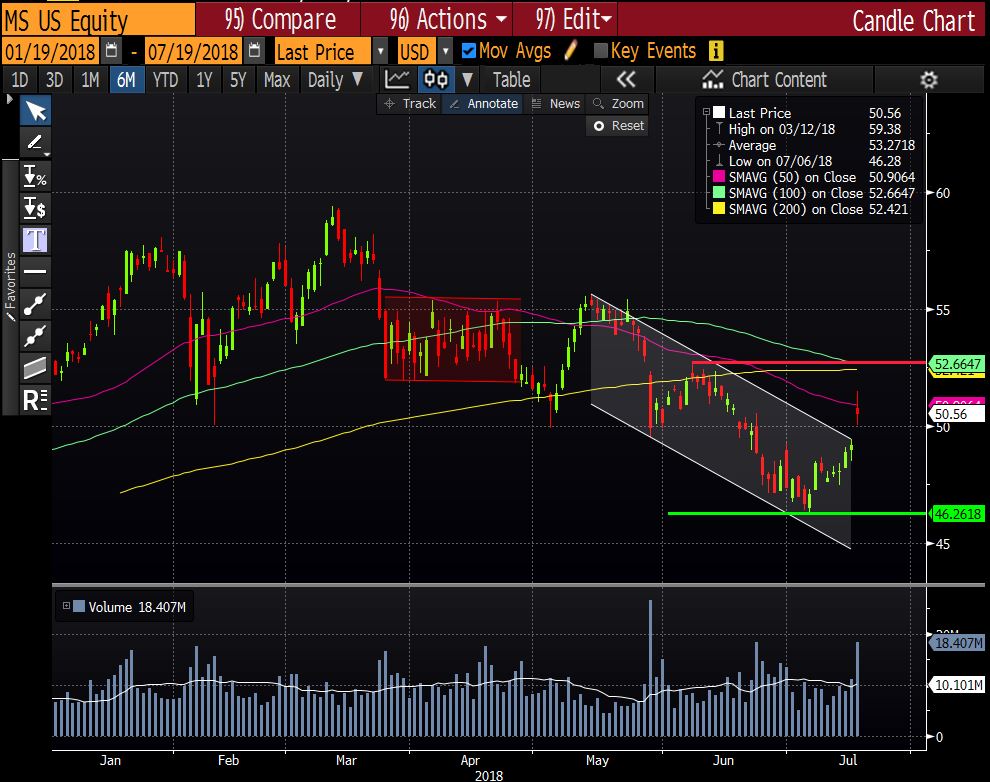
In terms of technical analysis, the price has broken out of the downward channel. The price needs to break its 50, 100 and 200 SMA to confirm the uptrend on a daily time frame. The suppost is at 46.26 and the resistance is at 52.63.
USD/CAD Supported At 61.8 And 78.6 Fibonacci Retracement
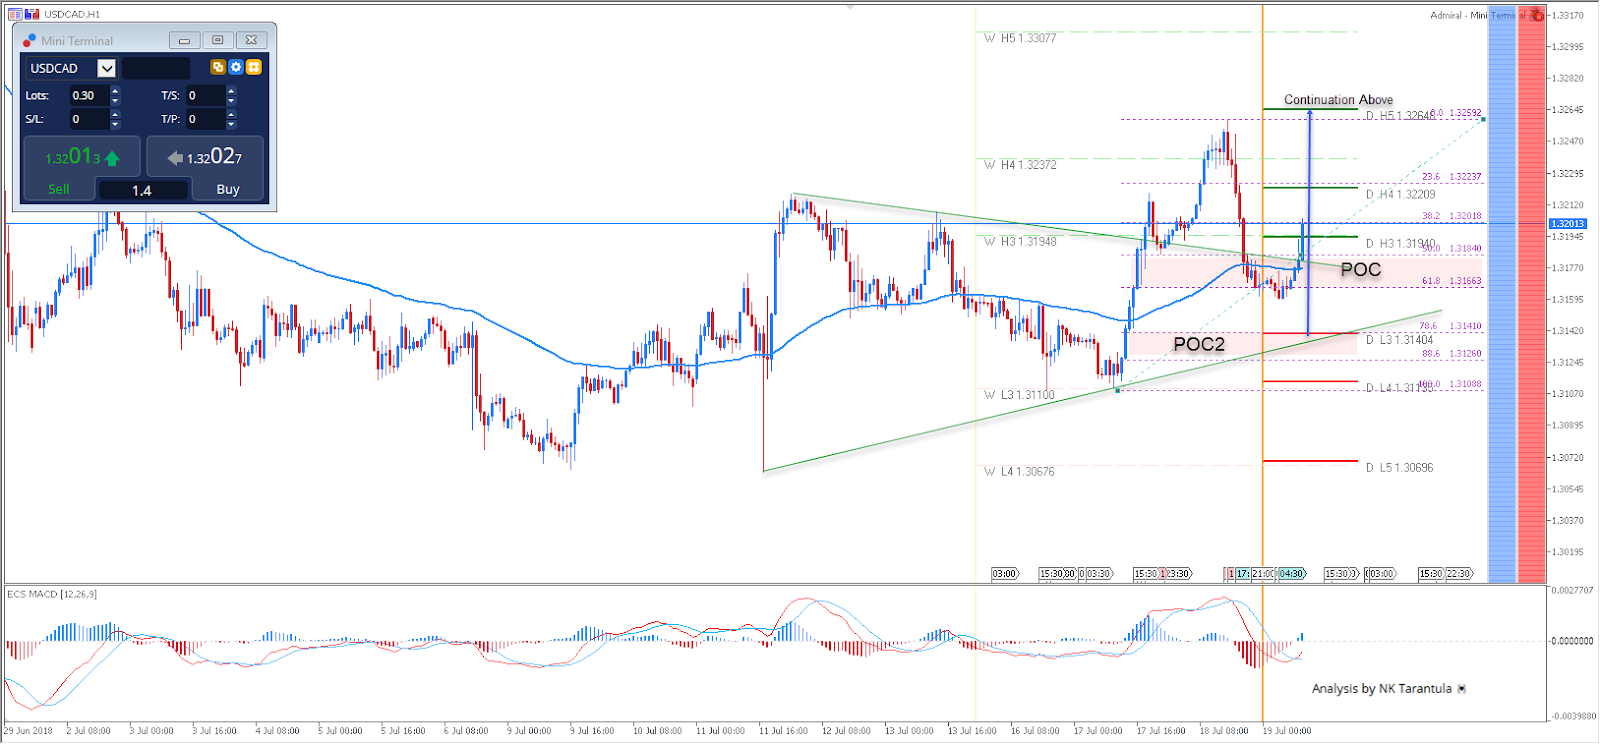
The USD/CAD is supported at 61.8 and 78.6 fib retracement of the last swing. 1.3166-84 is the first POC zon, where bounce is possible, while the POC2 is 1.3125-1.3140. Both zones could be valid for longs providing that W L3 holds – 1.3110. Targets are 1.3220 and 1.3264. Continuation is only possible above 1.3265 towards 1.3307.
W L3 - Weekly Camarilla Pivot (Weekly Interim Support)
W H3 - Weekly Camarilla Pivot (Weekly Interim Resistance)
W H4 - Weekly Camarilla Pivot (Strong Weekly Resistance)
D H4 - Daily Camarilla Pivot (Very Strong Daily Resistance)
D L3 – Daily Camarilla Pivot (Daily Support)
D L4 – Daily H4 Camarilla (Very Strong Daily Support)
POC - Point Of Confluence (The zone where we expect price to react aka entry zone)
US Dollar Off Highs On Profit-Taking, UK Retail Sales To Be Watched For Rate Clues
Here are the latest developments in global markets:
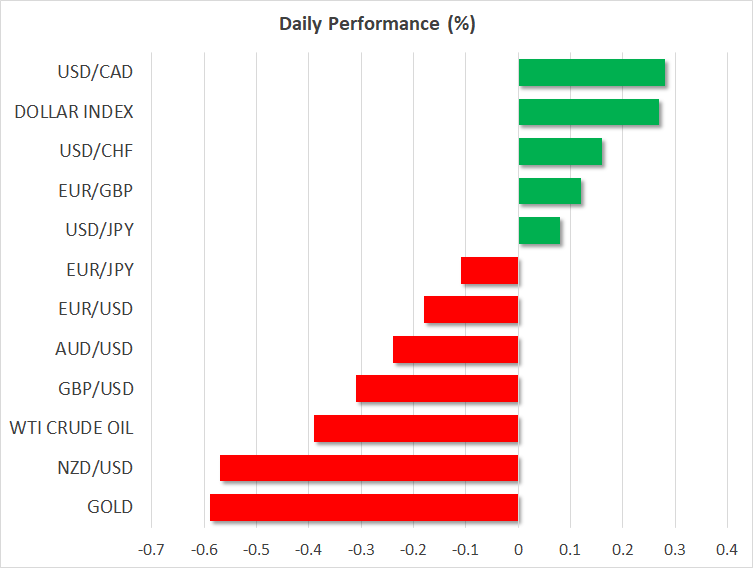
FOREX: The US dollar was off the previous day's multi-month highs versus its major counterparts on profit-taking, although it was holding firm on the back of optimism from the Federal Reserve Chair Jerome Powell about the prospects of the US economy. The dollar looked set to retest these highs as it was receiving support from what was becoming the main scenario of two more rate hikes in the remainder of 2018. On the other hand, worries about a US-China trade war sunk the Chinese yuan to a 1-year low.
STOCKS: After yet another positive session on Wall Street – at least for two out of the three major indices as the Nasdaq retreated marginally but stayed near its all-time high – the mood was a relatively positive one. However, Asian markets were relatively flat and European stocks looked to open flat. Positive earnings from US investment bank Morgan Stanley helped financials higher while other earnings were also positive. Strong earnings growth and Chair Powell's upbeat testimony helped allay any concerns that a trade war might hurt corporate profitability.
COMMODITIES: Gold was struggling near its 1-year low, as dollar strength and the prospect of even higher rates from the Federal Reserve sapped demand for the yellow metal. Gold marked a low around $1222 an ounce. Oil managed to gain by more than a dollar to around $68.67 a barrel after oil inventory data released out of the US showed strong demand for gasoline (-3.1m) and distillates (-0.37m) that were interpreted as more important than the 5.8 million build in crude oil stocks.
Major movers: Australian employment numbers strong but weak yuan limits aussie gains
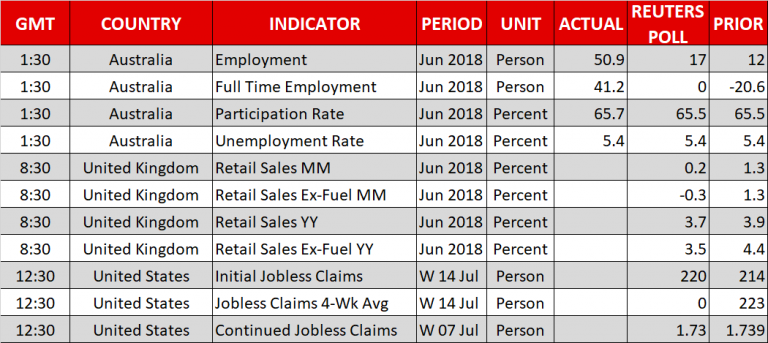
The main economic news out of the Asian session was the release of Australia's employment numbers for June. The country's employment change was a stronger-than-expected 50.9 thousand (the expectation was for a 16.7 thousand increase) and most of the employment increase involved full-time jobs as well (41.2 thousand). The employment participation rate also climbed to 65.7% from 65.5% (expected and previous). The unemployment rate held steady at 5.4%. Of course one can debate the relative importance of strong economic indicators for the aussie, given that the Reserve Bank seems to be firmly on hold and it would take a lot of positives to move it off the fence so to speak. Still after the report, the aussie climbed to 0.7440, only to drop back below 0.74 – possibly on concerns about a looming trade war and the impact, it would have on China. The Chinese yuan's drop to a 1-year low was a possible negative which curtailed the aussie gains.
The kiwi from its part recorded sizeable losses – possibly driven by selling against its Australian counterpart after Australia's strong jobs numbers and as Chinese developments also put pressure on both commodity currencies.
In other news, Japan's trade balance for June was better-than-expected at 721 billion yen compared to expectations of a 534 billion surplus. However, this was maybe not as positive as the headline figure suggests as the reason for the beat was that both import and export growth missed expectations but import growth by a much wider margin. Dollar/yen remained below the previous day's 7-month high of 113.12 to trade at 112.85.
Day ahead: UK retail sales to move pound; US Philly Fed Manufacturing index in focus
Following slower-than-expected CPI readings, retail sales will be next to drive the pound on Thursday at 0830 GMT amid Brexit-fueled political noise in the UK. According to forecasts, retail sales are expected to lose steam in June, posting a growth of 0.2% month-on-month (m/m) compared to a rise of 1.3% in the previous month. This could be the third consecutive month of weakness. Excluding fuel, sales are anticipated to face a contraction of 0.3% m/m after increasing by 1.3%. In yearly terms, the headline gauge is seen softer by 0.2 percentage points, while the core equivalent is projected to lose more, dropping from 4.4% to 3.5%.
Another discouraging surprise in economic data could pressure the pound back down to 1.30 as this could question whether a rate hike is appropriate to be delivered in August in times when consumption, a key element for growth, shows signs of waning, while Brexit risks continue to weigh on the business sentiment. On the other hand, an upbeat report could lift cable in speculation that BoE policymakers could feel more comfortable to raise rates in order to drive inflation towards the BoE price target of 2.0% when consumption continues to move in positive territory.
In the US, the Philadelphia Federal Reserve Manufacturing Index due at 1230 GMT will be of greater importance in terms of data releases, probably indicating that business conditions in the state have improved in July. Analysts predict the index to have bounced from 19.9 to 21.5 in July, remaining near the average of the past two years. Initial jobless claims for the week ending July 14 will be out at the same time, with projections being for an increase of 220k in the number of people applying for unemployment benefits for the first time. In the preceding week the number stood at 214k.
Still, the Fed chief's hawkish tone on the economy at his two-day semi-annual testimony on Tuesday and on Wednesday, which turned markets more confident that two more rate hikes could be delivered this year, could maintain positions strong on the currency even in case the data appear less appealing. Trade risks though continue to hang in the background and any potential escalation in the already tense trade environment could disturb the dollar's rally.
As for today's public appearances, the executive director of international at the Financial Conduct Authority, Nausicaa Delfas, will be giving a speech on Brexit at 0830 GMT. A meeting between the Russian Energy Minister Alexander Novak and Chinese officials in China to discuss energy cooperation could attract some interest, while in Buenos Aires in Argentina, the ECB Executive member, Benoit Coeure will be participating at the G20 finance ministers and central bank governors and deputies meeting, which will conclude on July 22.
Technical Analysis: EURGBP holds bullish move near 3 ½-month highs
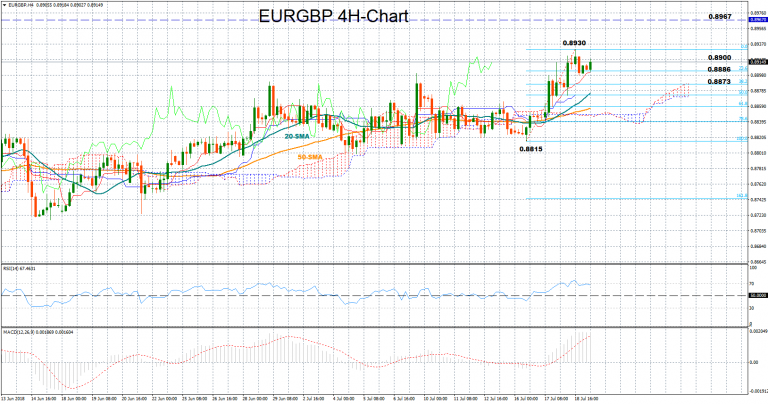
EURGBP managed to break the 0.89 key level to create a top at 0.8930 in the four-hour chart, the highest level reached since early March. The move also broke the range bound-trading recorded over the past three weeks, bringing some confidence back into the market.
While the RSI and the MACD continue to fluctuate in bullish territory suggesting that positive momentum could remain in play in the short-term, with the former moving above the 50 neutral level and the latter trending above zero and its red signal line , both indicators have lost steam, supporting that the rally could pause for a while.
On the upside, the price could find resistance at the 0.8930 peak, where a break higher could boost bullish actions even further, opening the way towards the March 7 peak of 0.8967.
Alternatively, a decline could see support around the 0.8900 round level where the 23.6% Fibonacci of the upleg from 0.8815 to 0.8930 is placed as well. In case this level fails to hold, shifting the market back to neutrality, the next obstacle could come between the 38.2% and the 50% Fibonacci levels of 0.8886 and 0.8873 respectively.
GBPUSD Outlook: Weak UK Retail Sales Would Add To Negative Outlook And Spark Fresh Weakness Below 1.30
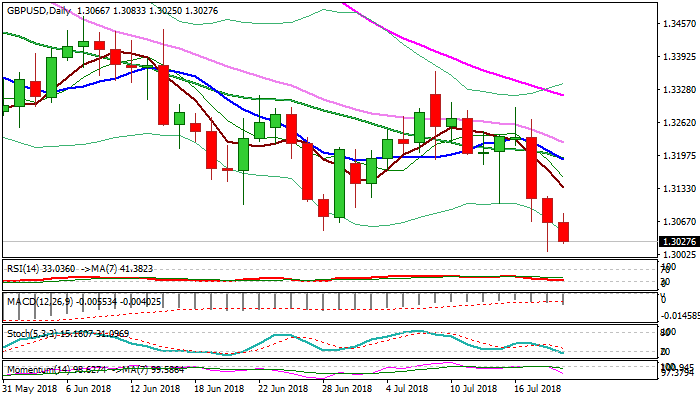
Cable came under pressure in late Asian / early European trading, after brief recovery from Wednesday’s new ten-month low at 1.3009, which stalled at 1.3083.
Pound was hit by weaker than expected UK inflation data on Wednesday and probed below key 1.3049 support (28 June low), but failed to close below it on the first attempt. Fresh weakness today is focusing again psychological 1.30 support (also weekly cloud base), with strong bearish signal expected on close below.
Overall picture remains negative with Brexit concerns and weak inflation numbers which reduced hopes for August rate hike, adding to negative outlook.
Daily techs are in firm bearish setup but oversold conditions may delay final break lower and continuation of larger downtrend, which would open targets at 1.2905 (05 Sep 2017 low) and 1.2865 (Fibo 61.8% of 1.1930/1.4376 uptrend).
UK retail sales data are in focus today (Jun m/m 0.1% f/c vs 1.3% prev / core Jun m/m -0.3% f/c vs 1.3% prev), with weak outcome today expected to increase pressure on British pound. Recovery top at 1.3083 marks initial resistance, followed by Wednesday’s high at 1.3118 and falling 5SMA at 1.3136, with stronger upticks to be capped by falling 10SMA (1.3189).
Res: 1.3083, 1.3118, 1.3136, 1.3189
Sup: 1.3009, 1.3000, 1.2905, 1.2865
GBP/JPY Daily Outlook
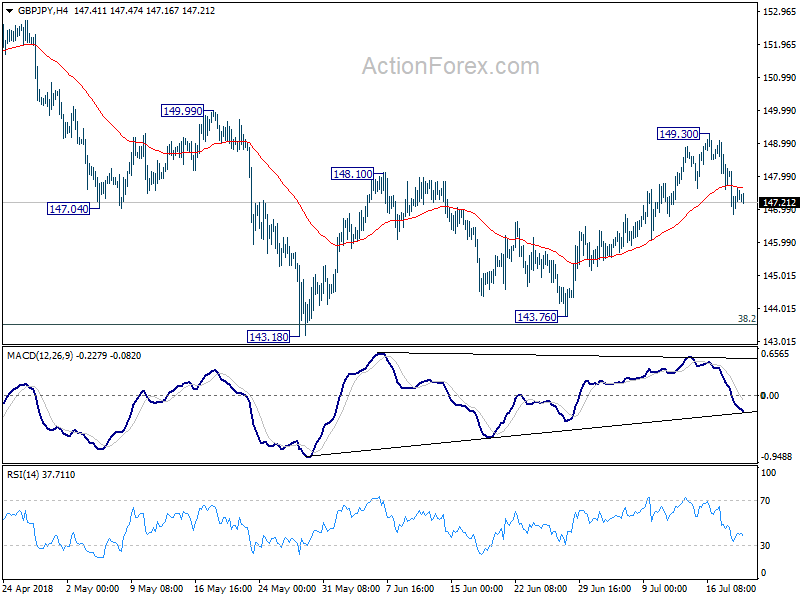
Daily Pivots: (S1) 146.82; (P) 147.53; (R1) 148.20; More...
Intraday bias in GBP/JPY stays mildly on the downside. The consolidation pattern from 143.18 could have completed at 149.30 already. Deeper fall would be seen back to 143.18/76 support zone first. On the upside, however, above 149.30 will bring turn bias to the upside for 149.99 resistance
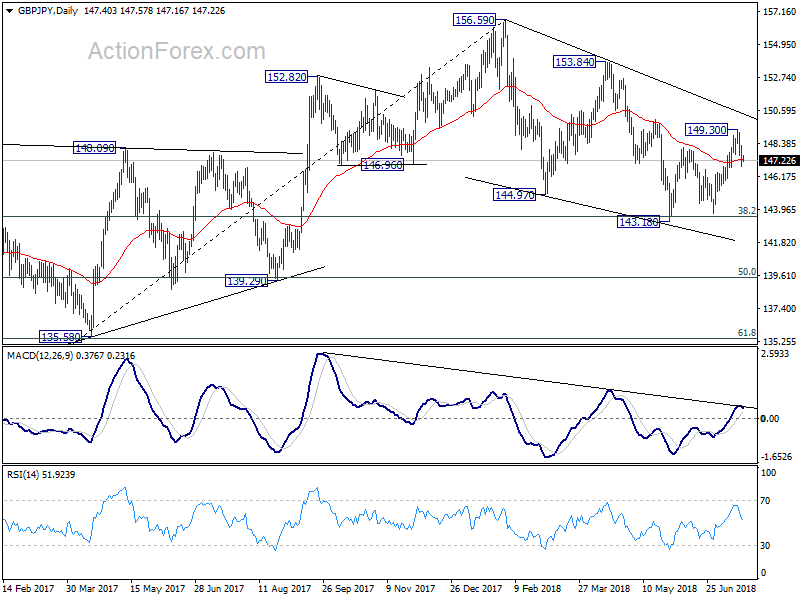
In the bigger picture, no change in the view that decline from 156.59 is a corrective move. In case of another fall, strong support should be seen above 139.29 cluster support (50% retracement of 122.36 to 156.59 at 139.47) to contain downside and bring rebound. Meanwhile, break of 153.84 should confirm that the correction is completed and target 156.59 and above to resume the medium term up trend.
EUR/JPY Daily Outlook
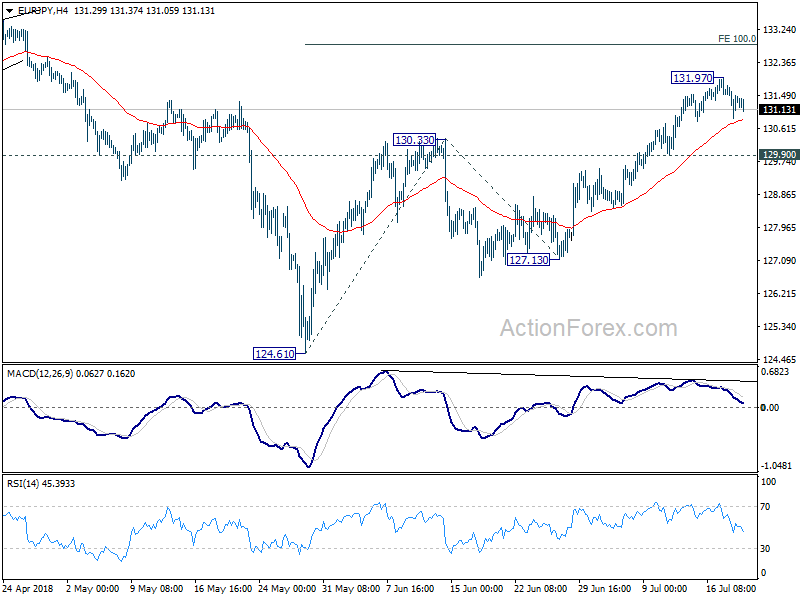
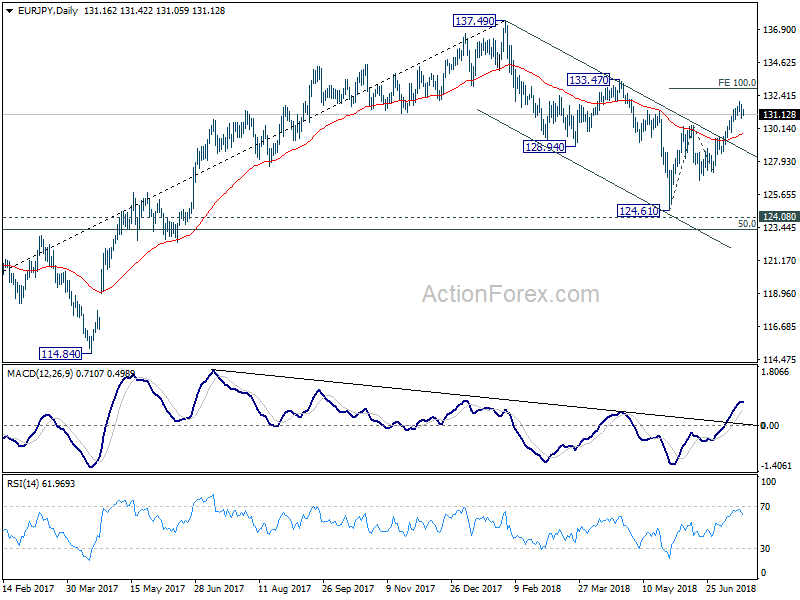
Daily Pivots: (S1) 130.89; (P) 131.34; (R1) 131.79; More....
Intraday bias in EUR/JPY remains neutral at this point. As long as 129.90 minor support holds, further rise is still in favor. Above 131.97 will target 100% projection of 124.61 to 130.33 from 127.13 at 132.85 next. However, break of 129.90 will indicate short term reversal, with bearish divergence condition in 4 hour MACD, and turn bias back to the downside for 127.13 support.
In the bigger picture, the strong break of channel resistance from 137.49 suggests that the decline from there as completed. The three wave structure suggests that it's a correction. With 124.08 key resistance turned support intact, medium term bullishness is also retained. Break of 133.47 will affirm this bullish case and target 137.49 and above. This will now be the favored case as long as 127.13 support holds.
USDJPY Forms Doji Candle After 6-Month High, Indicators Imply Strong Bullish Ride
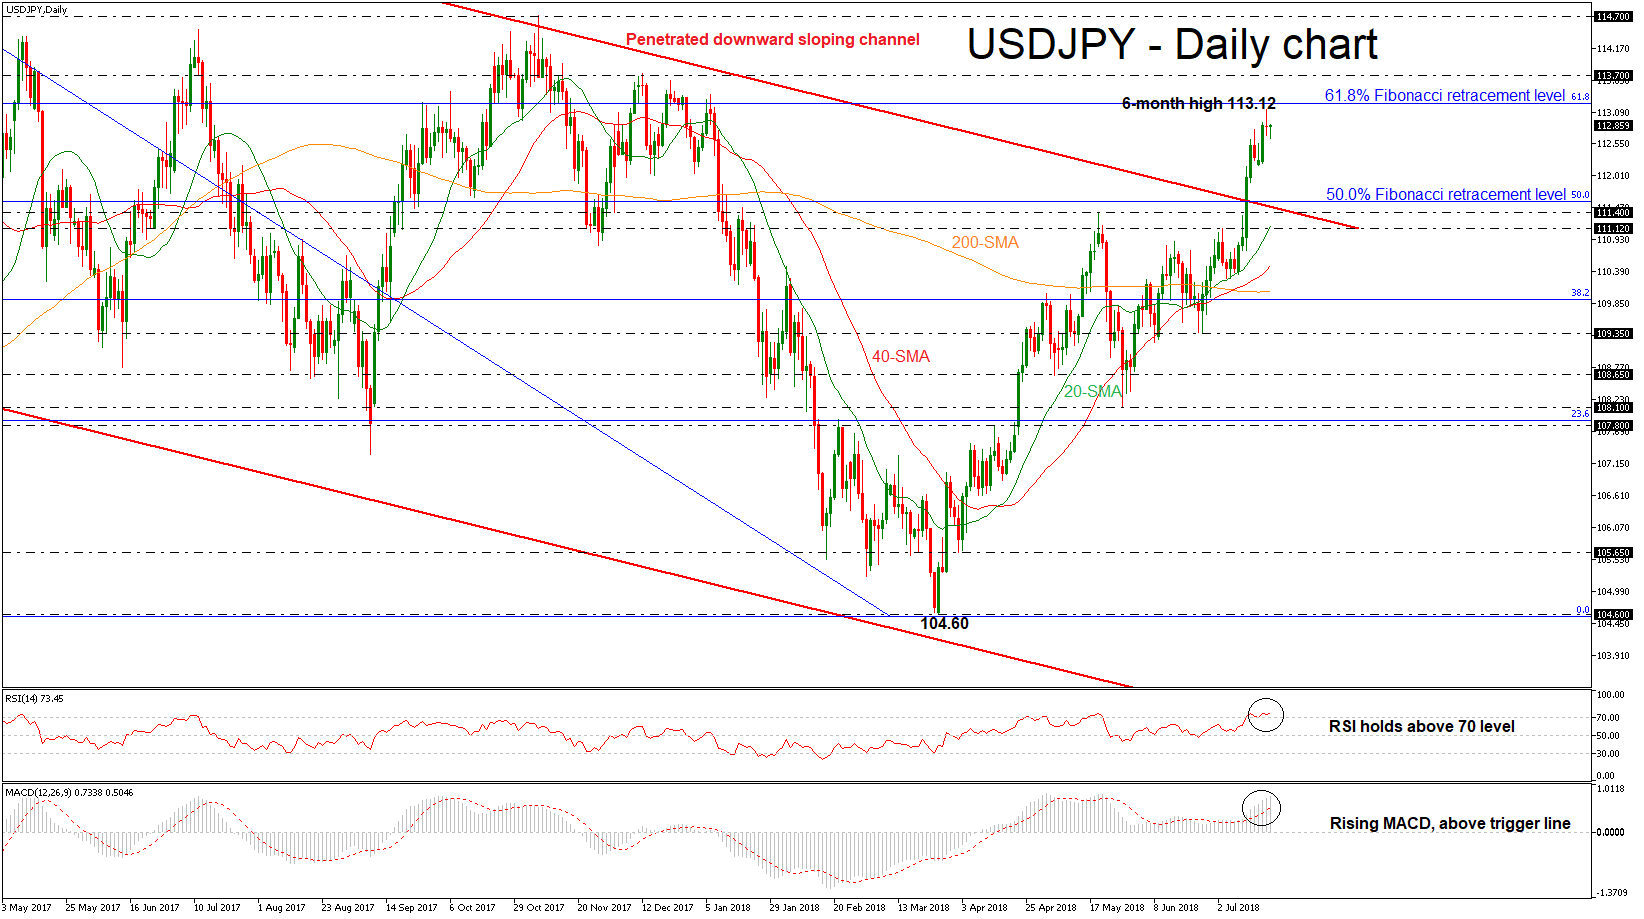
USDJPY penetrated the downward sloping channel to the upside during the preceding week, implying that a sharp bullish movement is coming. However, over Wednesday’s session, the price posted a bearish doji candle after it hit a six-month high of 113.12, giving the possibility for a downward correction in the near term. The short-term technical indicators are endorsing the scenario for a rising movement.
In the daily timeframe, the RSI indicator is holding within the overbought zone but has been flattening over the past few sessions, while the MACD oscillator is strengthening its momentum and lies well above its trigger and zero lines. It is worth mentioning that the short-term SMAs (20 and 40) crossed to the upside of the medium-term SMA (200), signaling upside pressures.
Immediate resistance is being provided by the 61.8% Fibonacci retracement level of the downleg from 118.60 to 104.60, around 113.23. A successful climb above this level would extend gains until the 113.70 hurdle, taken from the peak on December 2017. Moreover, an overcoming of the aforementioned obstacle could see the market retesting the 114.70 barrier, where it topped in November 2016.
Should the market dip lower, support could be met between the 50.0% Fibonacci mark of 111.57 and the 111.40 support, identified by the high on May 21. Then if the market fails to hold above these levels, the next stop could be at 111.12, which stands near the 20-day simple moving average (SMA).
To conclude, USDJPY has advanced considerably over the past four months after the rebound on the 104.60 support and seems to be ready for a new bullish ride.