Sample Category Title
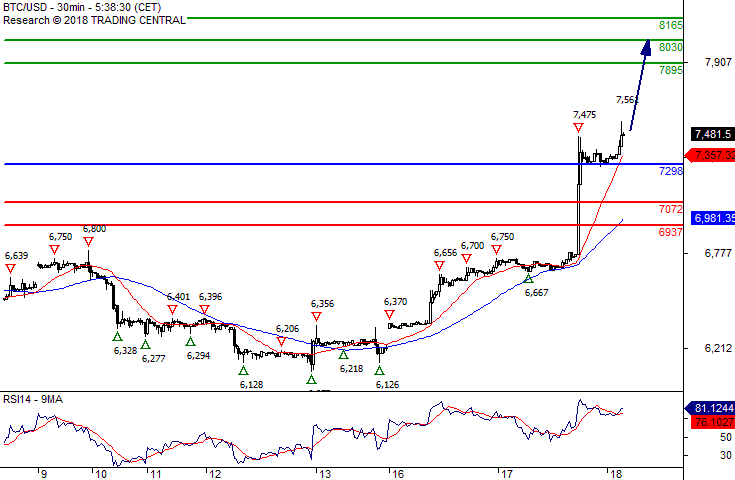
Bitcoin/Dollar The RSI Is Overbought
Our pivot (invalidation) point stands at 7298.
Our preference As Long as 7298 is support look for 7895.
Alternative scenario The downside breakout of 7298 would call for 7072 and 6937.
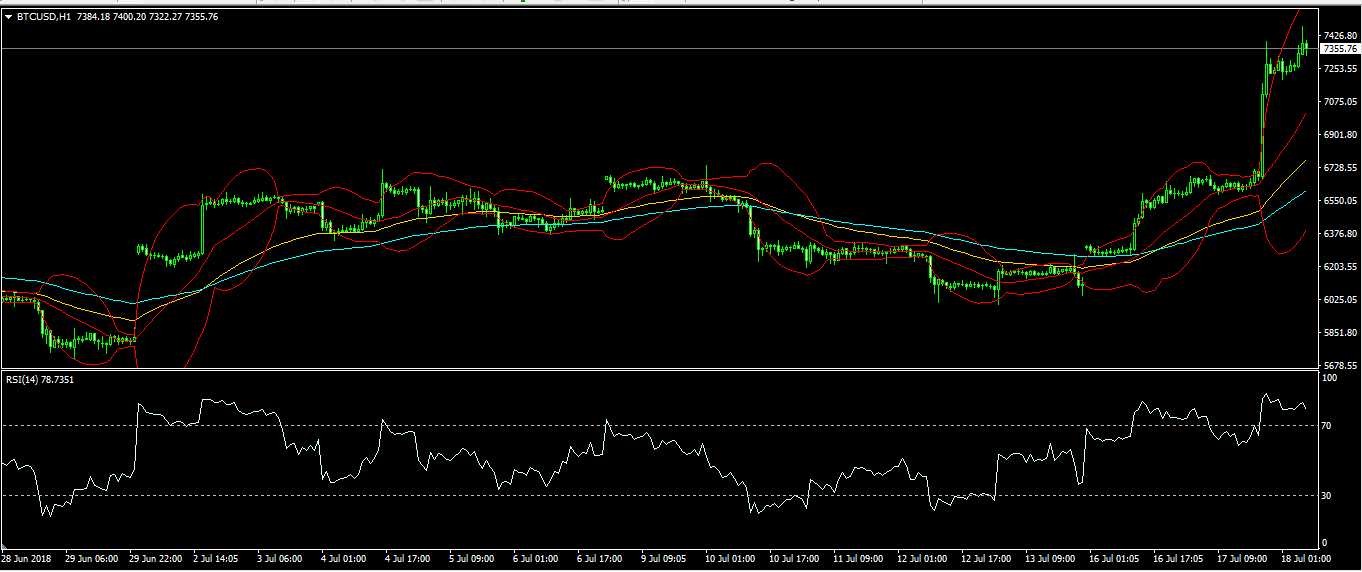
Comment The RSI is trading above 70. This could mean that either the pair is in a lasting uptrend or just overbought and that therefore a correction could shape (look for bearish divergence in this case). The MACD is positive and below its signal line. The pair could retrace. Moreover, the pair is trading above both its 20 and 50 MAs (respectively at 7357 and 6982). Finally, the Bitcoin / Dollar is trading above its upper Bollinger band (standing at 7457).
Moving Averages Explained
Among technical analysts, moving averages (MA) are one of the more commonly used indicators. In the right hands, these tools can be exceedingly powerful!
The two most popular moving averages are the simple moving average (SMA) and the exponential moving average (EMA), and therefore, will be the central focus of today’s piece.
So, what are moving averages?
Moving averages are a way of smoothing out price data over time.
As the indicator uses historic price points in its calculation, there is going to be a lag. A lagging indicator is a tool that changes only after the underlying instrument has begun to move. Think of it as a line that trails price action.
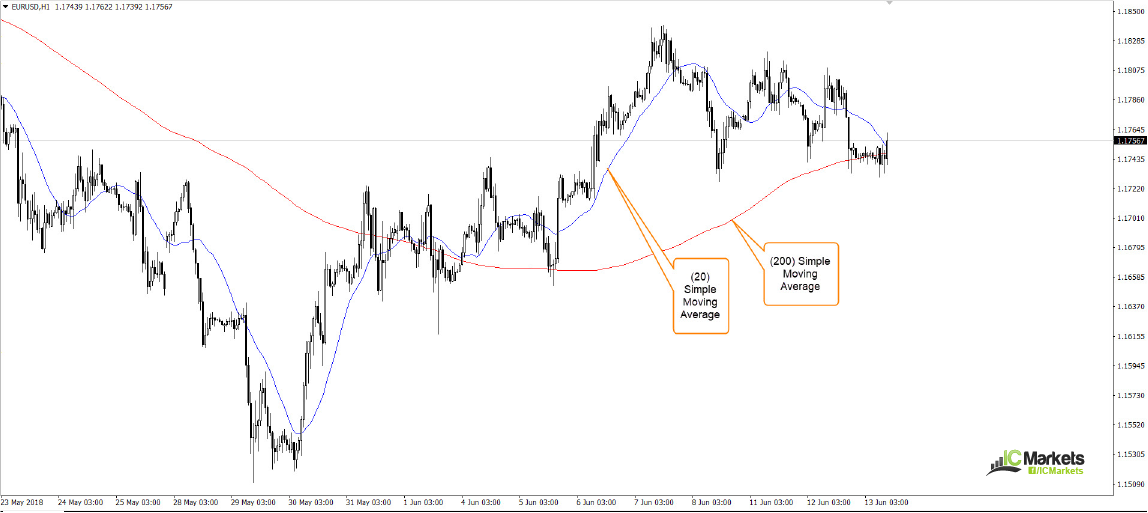
The simple moving average is calculated by adding the closing prices of an instrument over a number of time periods, and then dividing this total by the number of time periods.
Below is a visual representation of two simple moving averages, one with a 200-period setting and the other with a 20-period value. Note that the longer the moving average settings, the more the lag. A 20-period moving average, for example, will spend its time hugging price action closely, rotating shortly after price turns. The 200-period moving average, on the other hand, will turn at a slower speed.
Think of the (20) moving average as a jet ski and a (200) moving average as a cruise ship.
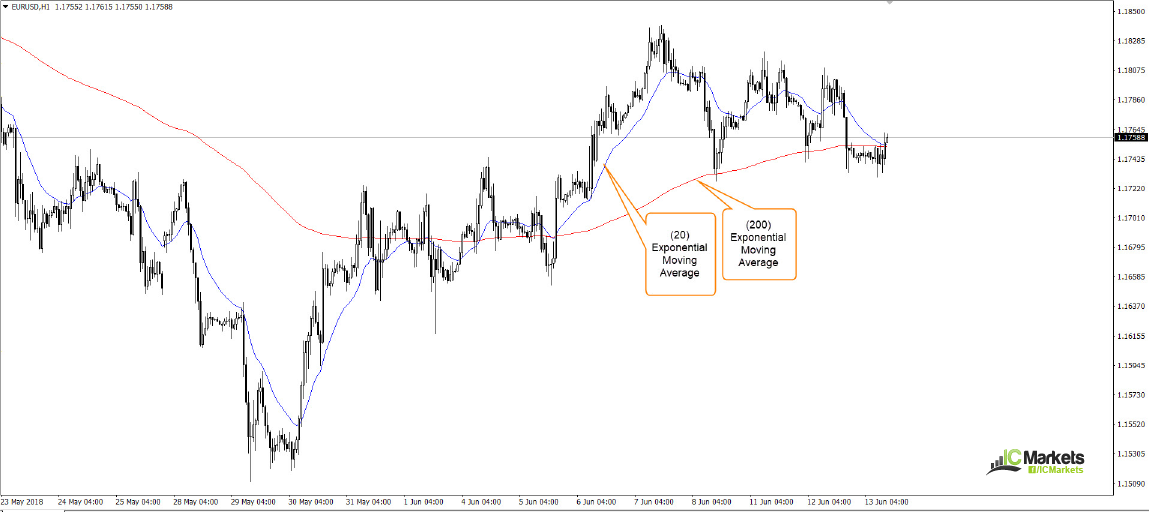
The exponential moving average, although similar to the simple moving average, houses a subtle difference: more weight is given to the latest data in the calculation. Accounting for this, exponential moving averages tend to react faster to price movement. Below we’ve plotted two exponential moving averages on the same chart as above using the same values. Notice the difference?
Many uses
Trend identification. Some traders, particularly those new to the business, favour using moving averages as a way of identifying a trending market, or one that may be on the verge of reversing.
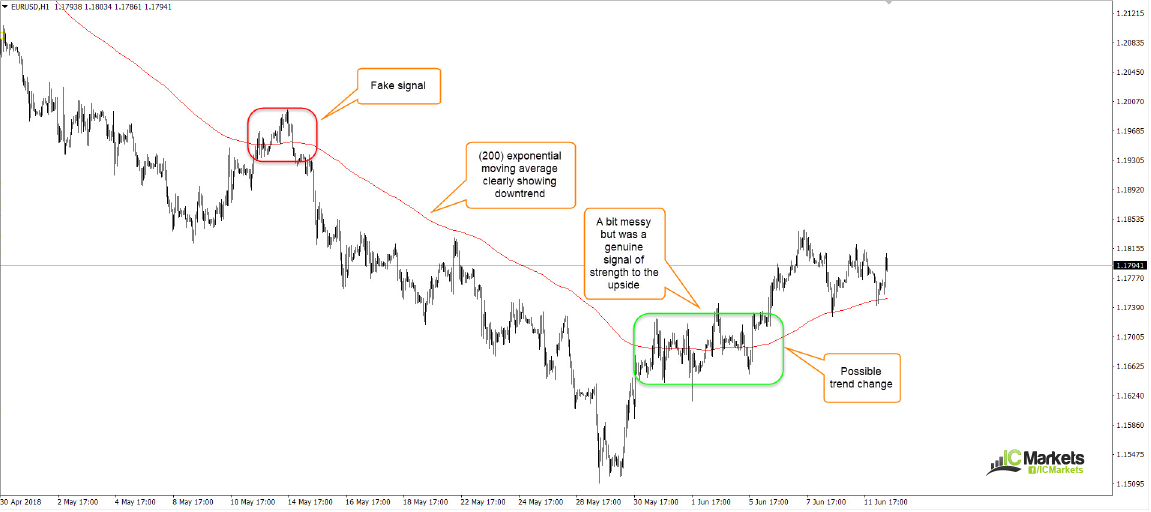
Put simply, when price action crosses above/below your chosen moving average, this suggests a possible trend change may be on the horizon. As shown on the EUR/USD H1 chart below using a (200) exponential moving average, the indicator displays a potential trend change in play as price recently crossed above the moving average. Also worth noting is the fake signal seen around the 1.1965 region, which tend to be common viewing amid high-impacting news.
Entry confirmation
Alongside trend identification, moving averages can be used as a means of entry confirmation. Having two moving averages crossover can provide reliable buy and sell signals.
Long-term traders tend to opt for a 200/50 period setting, while intraday (shorter-term traders) target lower settings in the range of 50/20. When the shorter-term moving average crosses above/below its longer-term counterpart; a signal to engage is presented.
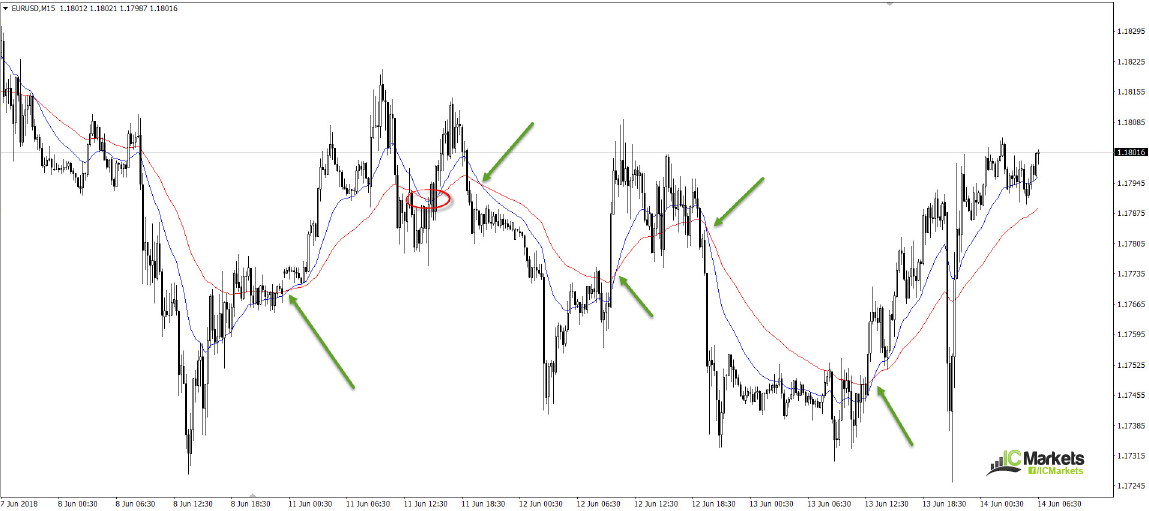
On the EUR/USD m15 timeframe displayed below, we have attached a (50) exponential moving average (red) along with a (20) exponential moving average (blue). The green arrows denote potential entry signals where the (20) moving average crosses its longer-term equivalent. However, like all things technical in the trading domain, nothing is guaranteed to work 100% of the time. Note the fake signal to sell short, circled in red. It can get particularly frustrating when multiple back-to-back false signals are generated. Another aspect to bear in mind is the spread between your chosen moving averages: the further apart they are, the stronger the trend is likely to be.
Like all moving averages, though, they often provide healthier signals in trending environments, offering potentially lucrative risk/reward opportunities.
Dynamic support and resistance
When one talks of support and resistance, they’re usually referring to horizontal lines. Dynamic support and resistance, however, can be found where a moving average intersects with price action.
Although dynamic support and resistance does work, using it in isolation is unreliable. In line with additional tools, on the other hand, the indicator can serve as a strong confirming point.
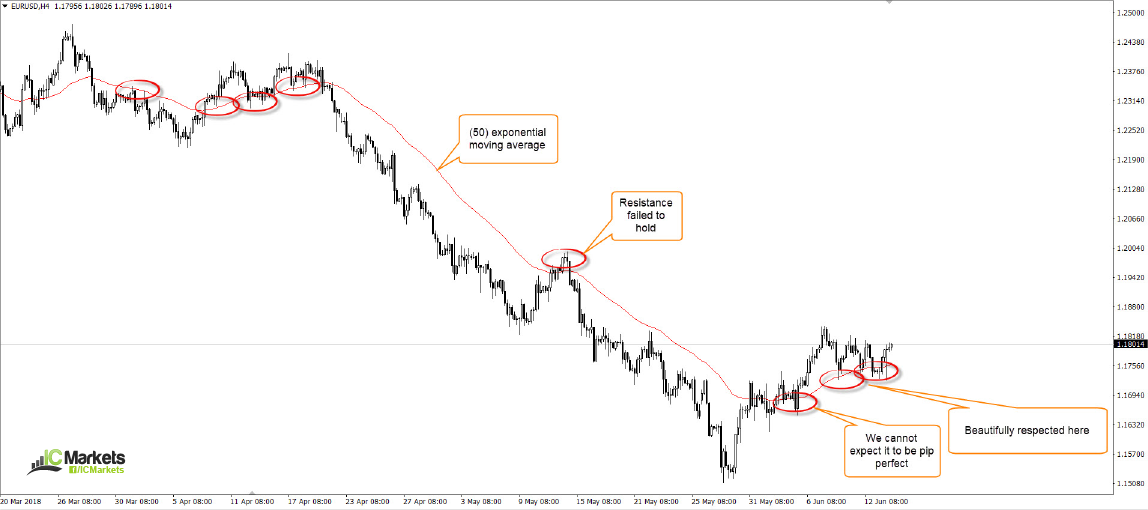
Still on the EUR/USD chart, only this time on the H4 timeframe, we’ve attached a (50) exponential moving average. As you can see, the moving average offered support and resistance to the market on multiple occasions, hence when one combines this tool with other price action concepts it can be a powerful aid.
Trailing technique
One of the simplest uses a moving average offers is determining where to place stop-loss orders when trailing a position. As the trade progresses and the moving average alters course, you can adjust your stop position behind the moving average as price moves in favour. This can provide one with fantastic return on risk.
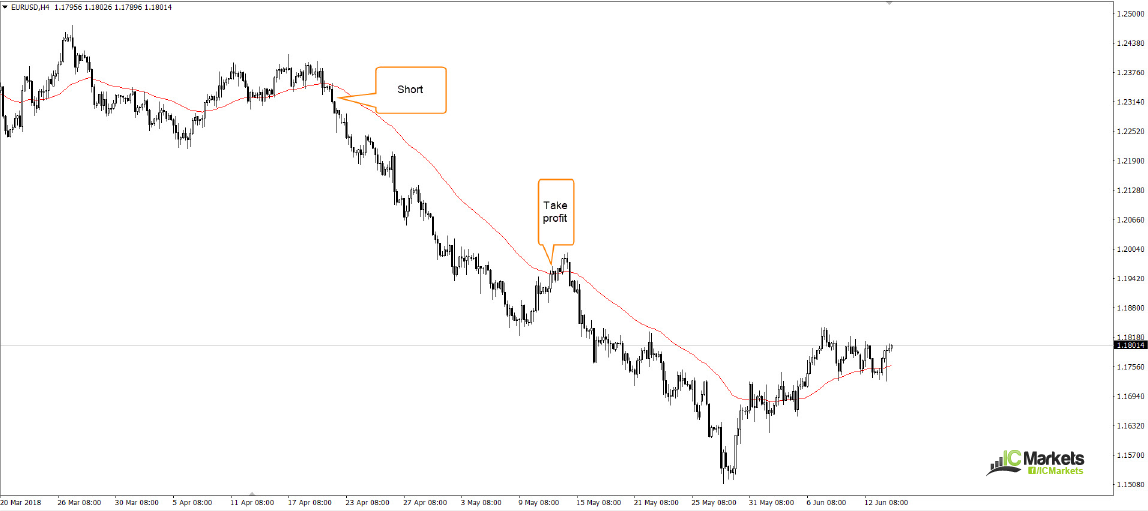
Using the same H4 chart on the EUR/USD, we can see that if one would have managed to pin down a short sell at around the 1.2330 mark and trailed the position using the (50) exponential moving average, you would have been taken out at 1.1963. That’s nearly a 400-pip move.
Final words
We firmly believe moving averages have a place in one’s toolbox. However, we also believe they should be considered secondary indicators. For example, trades should never be initiated on the back of only a moving average. Instead they should be used as additional confirming tools to chart-based structure such as, supply and demand, round numbers etc.
This leaves only one question: what are the most reliable moving averages to select?
The answer, we’re afraid, is subjective and heavily debated among technical analysts. The best answer we can offer is research. Explore which moving averages best fits your personality and trading methodology and work from there.
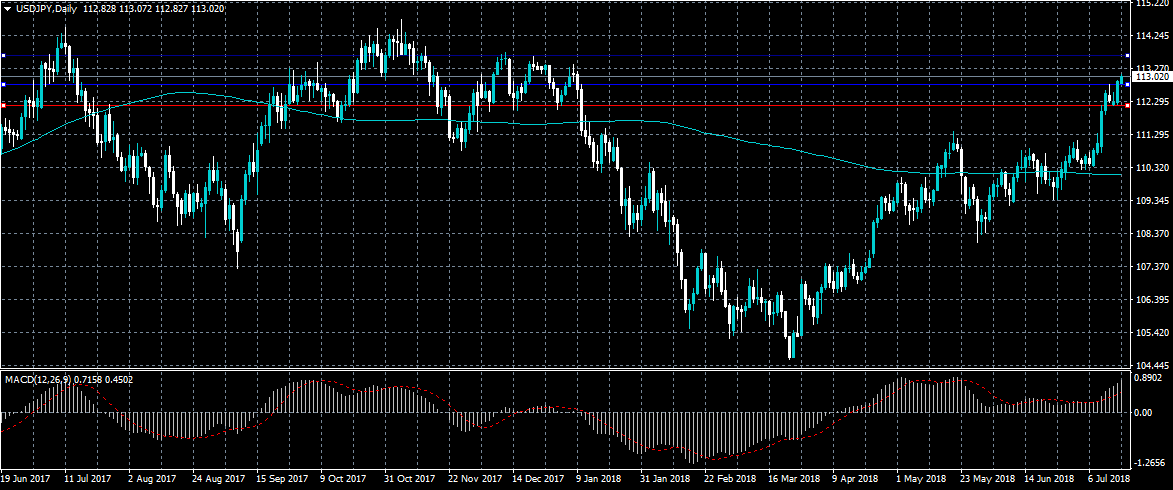
USDJPY Now Bullish Above 112.80 Level
The US dollar has soared to a new six-month trading high against the Japanese yen currency, as FED Chair Jerome Powell’s bullish comments on the US economy and future rate hikes lifted the greenback. The move higher in the USDJPY pair has scope to run higher if buyers can keep the price above the 112.80 level, which is former key resistance now turned support. USDJPY buyers will target further upside towards the 113.40 level, while sellers will look to break the 112.80 level.
The USDJPY pair is strongly bullish while trading above the 112.80 level, upside targets are found at the 113.40 and 113.88 levels.
If the USDJPY pair moves below the 112.80 level, sellers may test towards the 112.55 and 112.20 support levels.
EURUSD Strongly Bearish Below 1.1650 Level
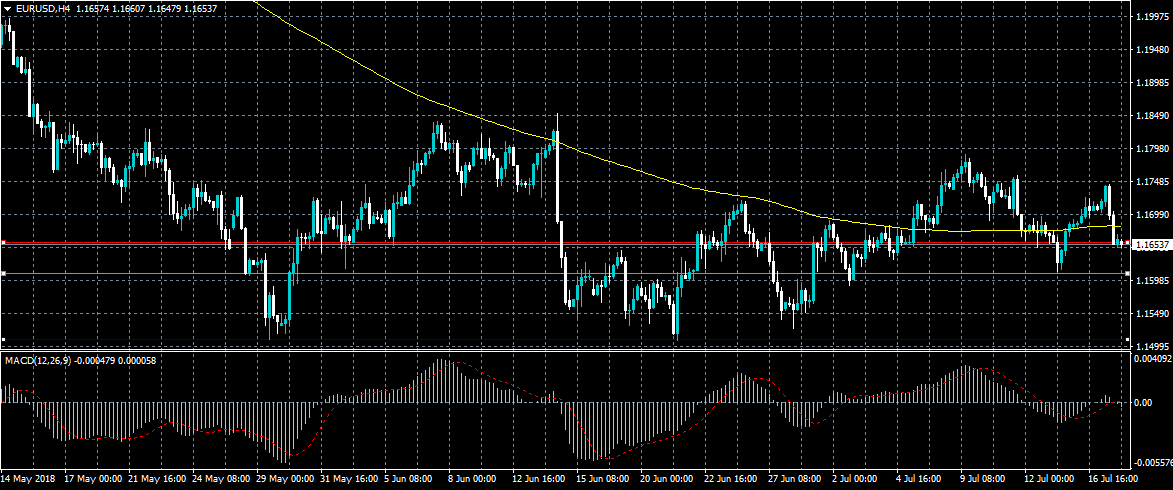
The euro has erased recent trading gains against the US dollar, following hawkish comments from Federal Reserve Chair Jerome Powell during his testimony before US Congress. The EURUSD pair is turning bearish across the four-hour time frame, with the MACD indicator turning lower and price now trading below the 200-period moving average on the mentioned time frame. Sellers will once again target the 1.1600 level, while buyers will look to stabilize price above the 1.1684 level.
The EURUSD pair is strongly bearish while trading below the 1.1650 level, key support is found at the 1.1612 and 1.1554 levels.
If the EURUSD pair moves above the 1.1684 level, buyers may once again test towards the 1.1700 and 1.1724 resistance levels.
Earnings Season Boosts Crypto Market
The crypto market is having a good week on the whole so far. Over the past two days, Bitcoin has added more than $10 billion in market capitalization while the total market capitalization of cryptocurrencies has grown to almost $300 billion.
This week's surge is attributed to the current earnings season, which started on Friday last week. On Monday, Blackrock, one of the biggest asset managers with assets under management of $6.3 trillion announced that it would start considering Bitcoin investments. This was big news for the crypto world which has seen a decrease in demand over the past few months. Traders believe that other large asset managers will start considering cryptocurrencies following Blackrock's lead.
Yesterday, Goldman Sachs, one of the most important banks in the United States named David Solomon as the next CEO. This was an expected move, seeing as the firm made him the sole president of the firm a few months ago. Solomon will take over from Lloyd Blankfein who has been at the helm for more than 12 years. In the past few months, Solomon has been a major advocate for cryptocurrencies.
Another major positive report was from the Financial Stability Board (FSB), which is an international financial watchdog. The organization released a report saying that cryptocurrencies did not pose a major challenge to the international financial system.
Finally, Steven Cohen, the founder of Point72 Asset Management announced that he had started to invest in cryptocurrencies. Steven is one of the most popular hedge fund managers in Wall Street with unrivalled performance. He was the founder of SAC Capital, a hedge fund he was forced to shut down after allegations of insider trading.
The question now is whether Bitcoin will hold its gains. In the past, such lavish news has not materially helped cryptocurrencies. For example, when CBOE and CME listed Bitcoin futures, traders expected more demand from institutions. Instead, the demand didn't increase, and most institutions placed short trades.
The BTC/USD pair is now trading at 7,358, which is the highest level since early June. The pair is trading above the 55-day exponential moving average and the 100-day EMA. It is trading on the upper side of the Bollinger Bands with the RSI currently at 79. This is considered an overbought position, which means that some bulls could look to exit their positions. While Bitcoin might continue to move higher during the earnings season, there is also a likelihood that it might have a correction as bulls exit.
Fed’s Powell, Economic Data In The Spotlight Wednesday
A combination of economic data and monetary policy will headline the newswire on Wednesday. On the central bank front, Federal Reserve Chairman Jerome Powell will embark on day two of Congressional testimony following a meeting of the Senate Banking Committee on Tuesday.
The UK's Office for National Statistics gets the ball rolling on Wednesday with a deluge of inflation data at 08:30 GMT. National Statistics will report on retail prices, producer prices and consumer inflation in the morning session. The UK's consumer price index (CPI) likely rose 0.2% for June, translating into an annualized gain of 2.6%. So-called core inflation, which strips away volatile goods such as food and energy, likely rose 2.2% year-over-year.
Later in the session, the European Commission's statistical agency will release final CPI numbers for June. Euro-wide inflation is forecast to rise 2% year-over-year.
Shifting gears to North America, the US Commerce Department will report on housing starts and building permits at 12:30 GMT. Housing starts are forecast to have declined 2.2% in June to a seasonally adjusted 1.32 million-unit pace. Building permits, which are a proxy for future construction plans, likely rose 6% to 1.33 million.
Commodity traders will be keeping close tabs on weekly crude inventory data courtesy of the US Energy Information Administration (EIA). The EIA is forecast to show a weekly drawdown of 3.5 million barrels for the period ended 13 July, based on a median estimate of economists.
Jerome Powell of the Federal Reserve will deliver round two of Congressional testimony beginning at 14:00 GMT. On Tuesday, the Fed chief gave an optimistic view of economic growth and inflation. For traders, this means short-term interest rates are likely to keep rising.
EUR/USD
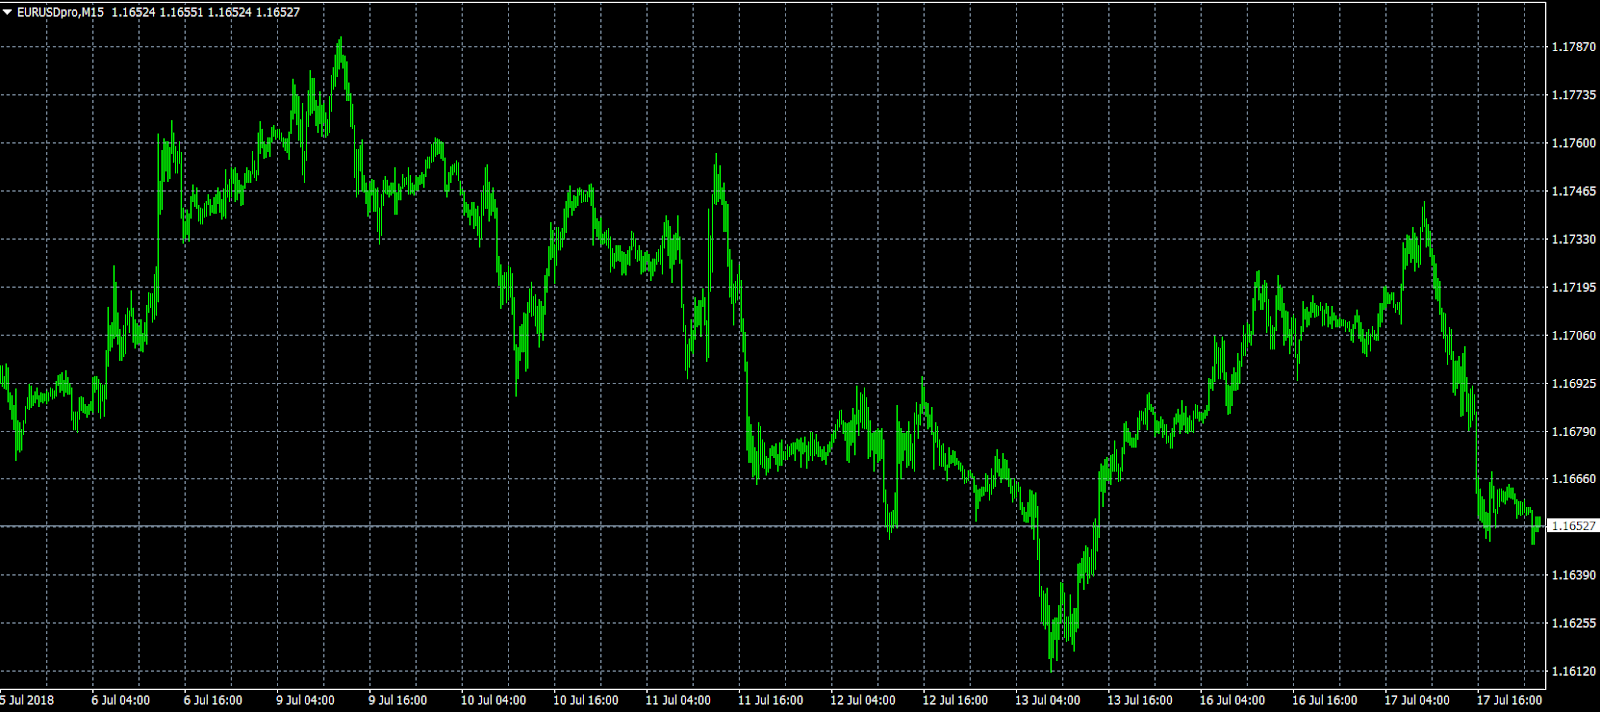
After surging to one-week highs, Europe's common currency reversed course on Tuesday to finish sharply lower. EUR/USD gave back roughly 90 pips to settle back in the 1.1650 range. The pair now faces immediate resistance near the 21-day simple moving average of 1.1663. This was previously a support level. From there, 1.1700 is likely to offer firm resistance.
GBP/USD
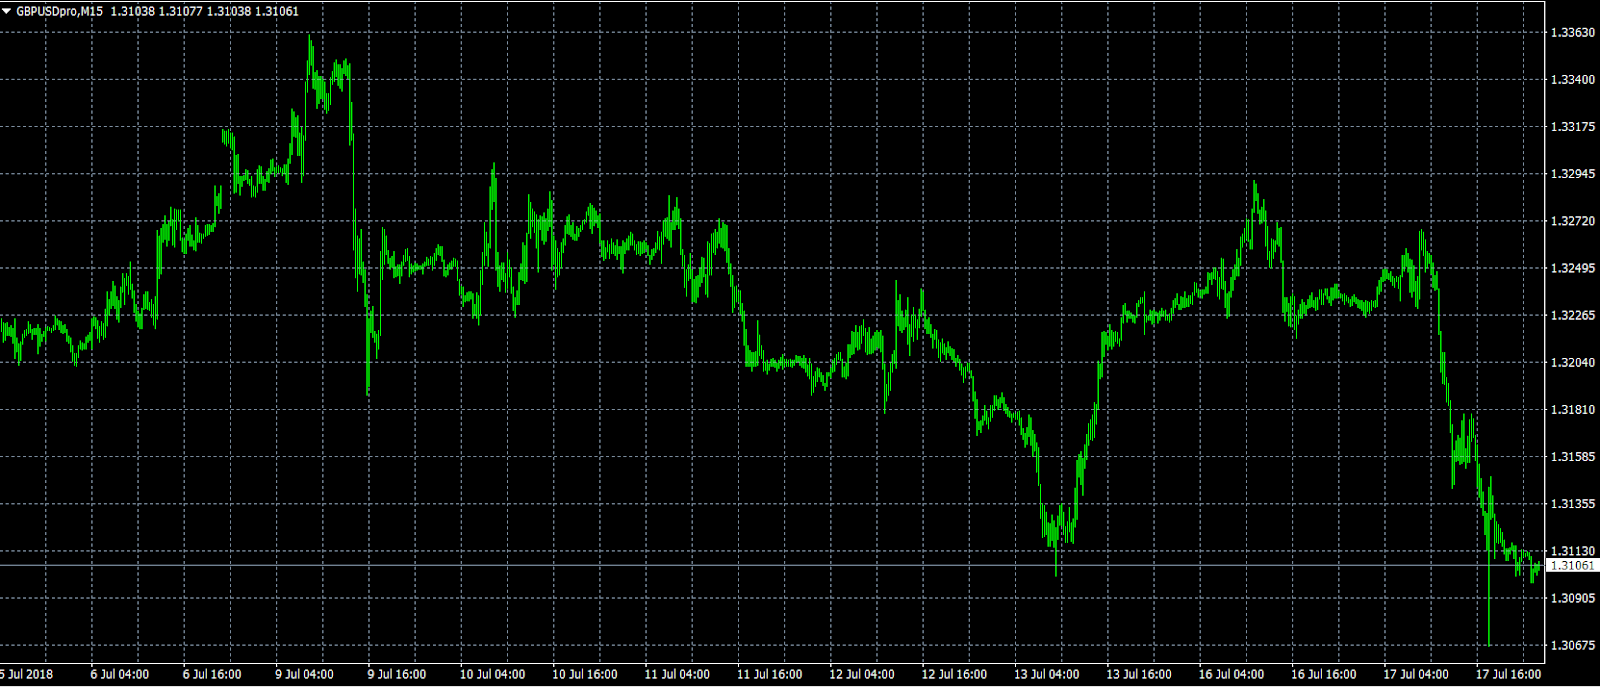
Cable plunged 160 pips on Tuesday after prices made a double-top formation earlier in the day. GBP/USD fell from a high of 1.3268 all the way back down to the low 1.300s. The pair now trades just above the 1.3100 level. Short-term technical indicators have been rendered obsolete for the moment, though fundamental drivers tied to Brexit and US monetary policy could set the tone moving forward.
USD/CAD
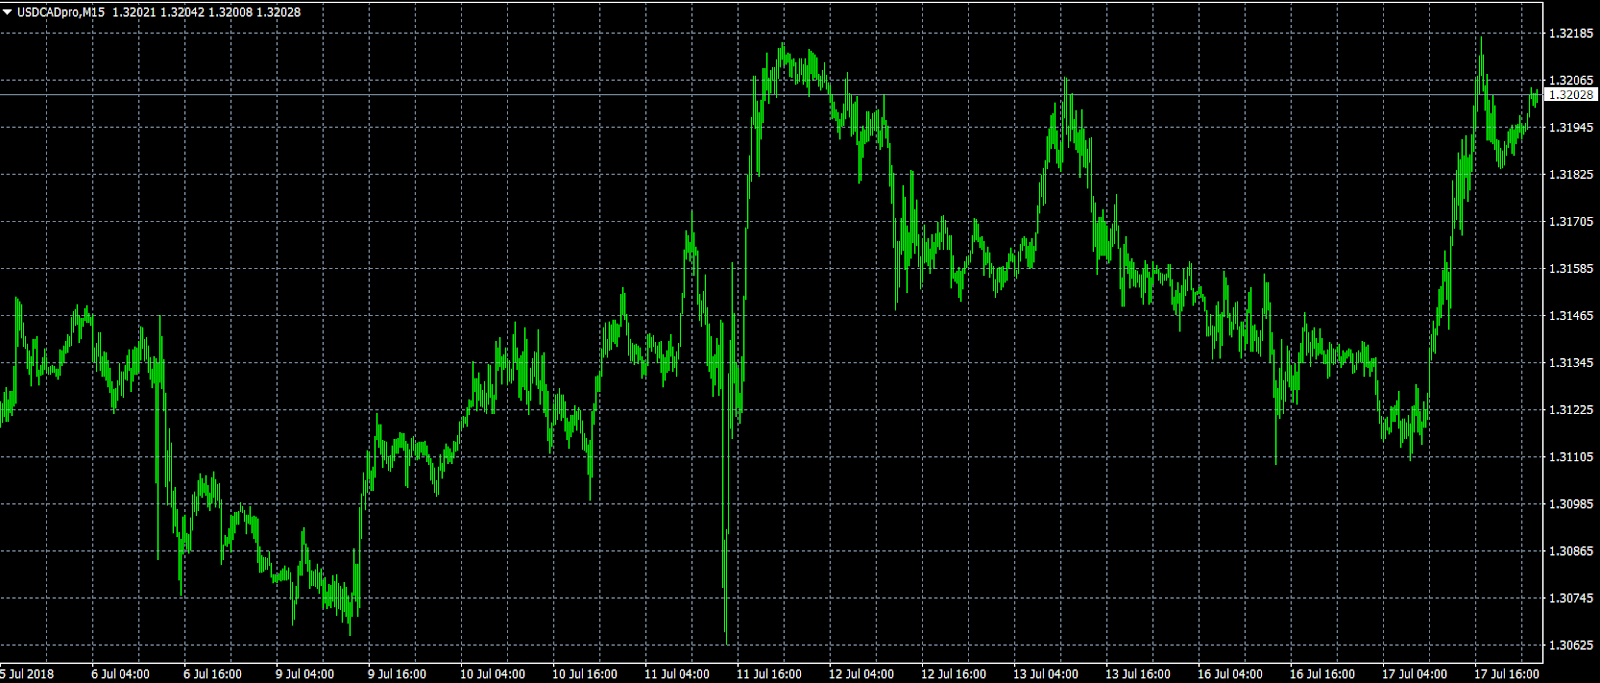
The Canadian dollar initially held firm in the face of falling oil prices, but a Fed-driven greenback soon encroached on that stability. USD/CAD is back to trading above 1.3200, which has opened up a bearish bias against the loonie. Investors should keep a close eye on commodity prices to gauge the direction of this pair.
EUR/USD Bearish Momentum Challenges Support Line And Fib
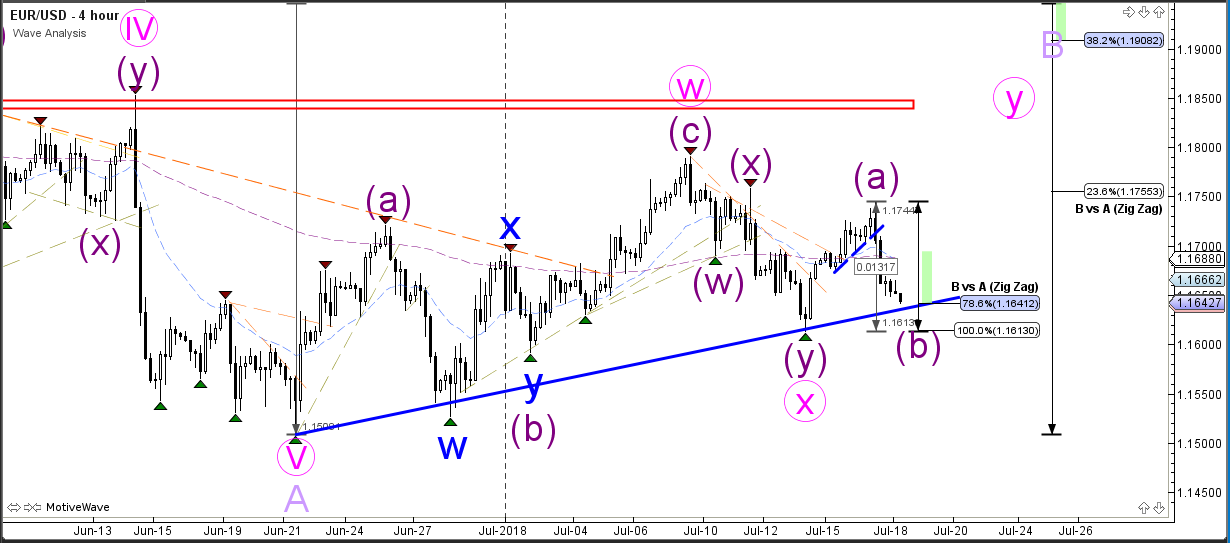
The EUR/USD is challenging the support trend line (blue) and 78.6% Fibonacci level of wave B vs A, which is a key breakout or bounce decision zone. A bearish break below the bottom invalidates the potential ABC (purple) pattern and indicates a new wave count, which will most likely indicate a bearish continuation. A bullish bounce could still confirm the current wave structure.
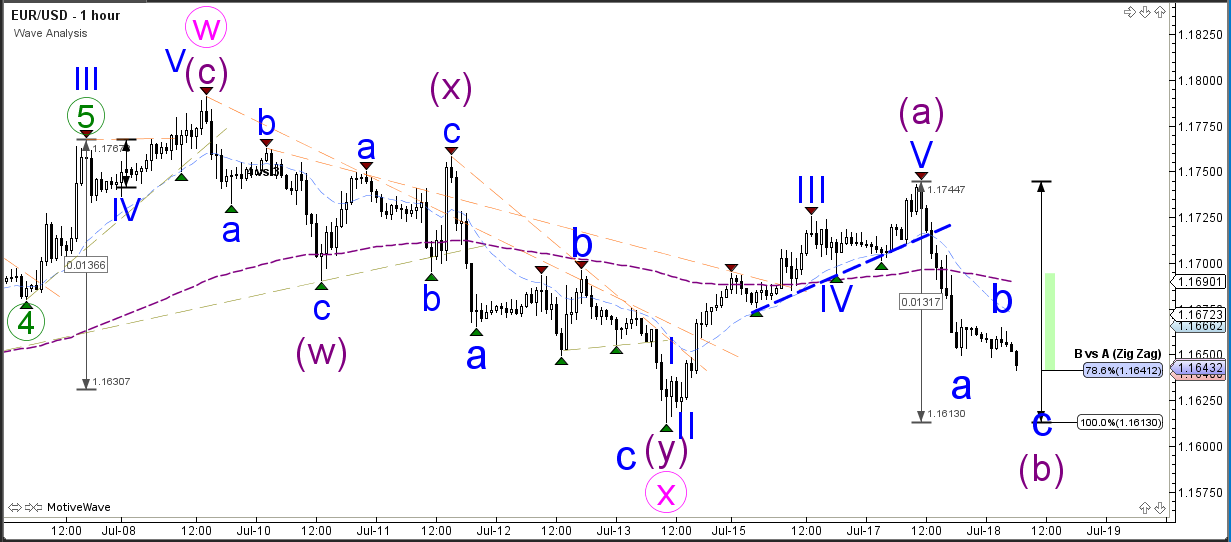
The EUR/USD seems to have completed 5 bullish waves (blue) as part of a wave A (purple) but the bearish momentum is a lot stronger than expected for a wave B (purple). The ABC zigzag pattern is therefore very vulnerable for a bearish breakout which would also invalidate the current wave pattern.
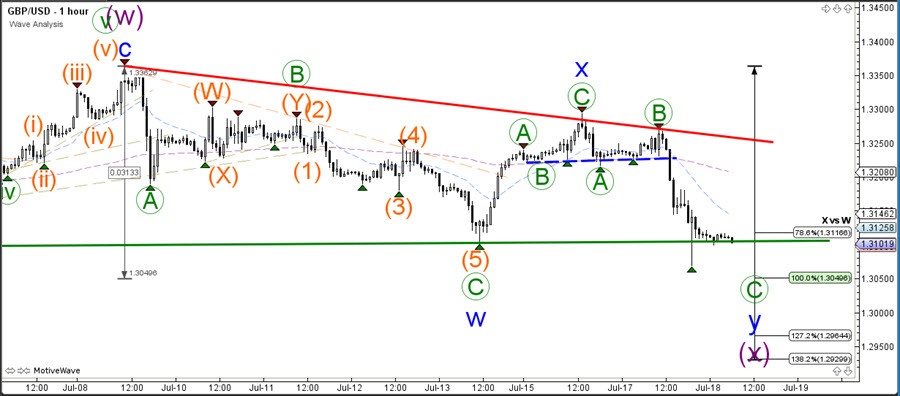
GBP/USD Bearish Channel Bounce With Impulsive Price Action
The GBP/USDbearish momentum is strong and broke below the previous bottom which is indicating a downtrend continuation or expanded correction.
The GBP/USD failed to break above the resistance trend line (red) of the downtrend channel. The bearish bounce was expected but the bearish momentum was stronger than anticipated, which makes a bullish breakout unlikely in the near future. Price is either building a WXY (blue) correction within wave X (purple) or price is in a new downtrend.
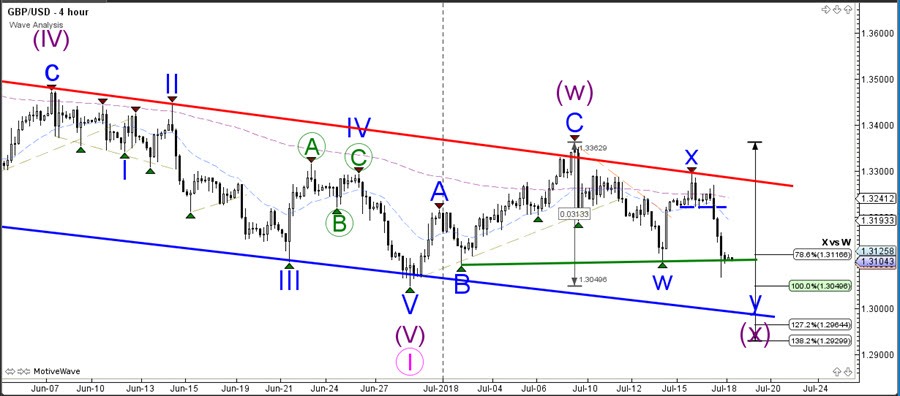
The GBP/USD broke below support (dotted blue) as expected. This could be a bearish ABC (green) pattern within wave X (purple) if price manages to bounce at the Fibonacci levels. A break below the support (green) and Fib levels however makes a downtrend more likely.
South Korea Cuts 2018 GDP Outlook And Job Creation Target
General Trend:
- Asian equity markets trade generally higher, US markets ended mostly in positive territory
- Shanghai Composite rises for the first time in 4 sessions
- Xiaomi rises after the HK and Shanghai Exchanges reach agreement on dual-class shares
- BHP rises over 3%, issued Q4 production and initial FY19 guidance
- US Treasury Sec Mnuchin has no plans for a bilateral meeting with China at the G20 in Argentina (July 21-22), according to a US Treasury official
- PBoC fixed the yuan weaker for the 5th straight session
- Money market rates in China are seen at a bottom, said the China Securities Journal
- Fed’s George (hawk) said there is still uncertainty about how far and how fast the Fed should raise rates; unclear about inverted yield curve
- USD/JPY trades above ¥113 for the first time since Jan, later pares gain
- Fed Chair Powell to testify before Congress for second day on Wed
- Taiwan Semi expected to report earnings on Thursday (July 19th)
- US and European companies which may report earnings on Wed include: ASML, Abbott Labs, Akzo Nobel, Alcoa, American Express, Canadian Pacific, IBM, Ericsson, Morgan Stanley, Novartis, SL Green, Swedbank, T-Mobile US, WW Grainger and eBay
Headlines/Economic Data
Japan
- Nikkei 225 opened +1.0%
- TOPIX Real Estate index +0.8%, Information & Communications +0.7%
- Toyota outperforms amid the earlier gain in USD/JPY
- (JP) Japan Financial Services Agency revamps itself to make it more able to respond to new challenges in the field, such as the rise of cryptocurrencies - Nikkei
- 6954.JP Fanuc, Mitsubishi Electric and DMG Mori will interconnect their systems for managing production data to better serve manufacturers and raise the profile of Japanese competitors in this field – Nikkei
- (JP) EU and Japan sign trade agreement in Tokyo; vows to continue to fight protectionism (yesterday after the close)
Korea
- Kospi opened +0.7%
- (KR) South Korea Govt and ruling party agree for reinforcement of tax refunds, basic pension, job-seeking allowance to expand support for lower income in H2 - Korean press
- (KR) South Korea Fin Min Kim confirms Govt will expand subsidies for small business, low income and elderly; will increase fiscal spending by $3.6B within existing budget; Sees 2018 GDP at 2.9% (prior 3%)
- (KR) US President Trump: No time limit on North Korea denuclearization (prior had called for immediate action) - Korean press
- (KR) South Korea Govt has picked banks for offshore sovereign bond
China/Hong Kong
- Hang Seng opened +0.6%, Shanghai Composite +0.1%
- Hang Seng Consumer Goods index +1.4%, Industrial Goods +0.7%, Info Tech +0.6%, Property/Construction +0.4%, Financials +0.3%; Energy -0.8%
- (CN) China MOF Academy Researcher says sees no 'big room' for tax cut - Chinese Press
- (CN) Hong Kong Exchange and Mainland China Exchanges reach agreement on adjusting inclusion related to 'Stock Connect' program; there will be an initial special stability trading period for weighted voting rights shares
- (CN) China PBoC Open Market Operation (OMO): Injects CNY80B in 7-day and 14-day reverse repos v CNY100B prior; Net: CNY80B injects v CNY90B injection prior
- (CN) China PBoC set yuan reference rate at 6.6914 v 6.6821 prior
- Air China, 00753.HK China regulator to launch 3-month safety crackdown after smoking pilot incident, includes fine, reduction in flight hours and removal of licenses
- (CN) China Ministry of Finance sells 1-yr bonds at 3.0328% v 2.99%e, bid to cover 2.27x; 10-yr bonds at 3.4338% v 3.46%e; bid to cover 2.5x
Australia/New Zealand
- ASX 200 opened +0.3%
- ASX 200 Consumer Discretionary index +1.1%, Resources +1.1%, Financials +0.5%; Energy -0.7%
- BHP.AU Reports Q4 iron ore production 72.0Mt v 70.0Mt y/y; attributable iron ore production 63.6Mt v 60.3Mte v 60.0Mt y/y
- (AU) Australia Jun Westpac Leading Index m/m: 0.0% v -0.2% prior
- (AU) Analysts note Australia could benefit from US/China trade war - press
- (NZ) New Zealand Debt Management Office (DMO) to offer NZ$150M in April 2037 bonds on Thursday July 19th
Other Asia
- (MY) Malaysia Jun CPI Y/Y: 0.8% v 1.3%e (4th staright month below target range)
- Taiwan’s Nanya Technologies declines over 2%; reported Q2 results, said the DRAM ‘supercycle’ is ending
North America
- US equities ended mostly higher: Dow flat, Nasdaq +0.2%, S&P500 +0.2%, Russell 2000 +0.6%
- S&P500 Consumer Staples +0.8%, Real Estate -0.7%
- Berkshire Hathaway [BRKb]: Amends Share Repurchase Program, under the amendment repurchases can be made at any time that Buffett and Vice Chairman Munger believe that the repurchase price is below the intrinsic value of the company
- (US) Weekly API Oil Inventories: Crude: +0.6M v -6.8M prior
- (US) Court filing shows DNC seeking to subpoena Jared Kushner in Russia civil suit
- (US) Fed George (hawk): Sees significant upside risks from fiscal policy, downside risks from trade policy; financial stress may be building in some sectors; more gradual Fed hikes needed to lift rate to neutral - Kansas City speech
- (US) Senator Orrin Hatch (R-UT) threatens to push for legislation that would curb President Trump’s trade authority if he moves ahead with more tariffs - US financial press
- (US) Former Fed chair Bernanke: Yield curve inversion have been a good predictor of economic downturns, but important to look at more than just the curve for future of economy
Europe
- (G20) Efforts to produce consensus on a G20 communique are on track and have faced no meaningful opposition from the US - financial press
- (UK) PM May wins vote on Trade Bill amendment, defeating rebellion by pro-EU conservatives; vote 307 to 301
- (EU) European Union reportedly exploring talks with President Trump on reducing car tariffs - press
- (UK) UK PM May reportedly had threatened hardliners with election - UK press
Levels as of 01:30ET
- Hang Seng +0.1%; Shanghai Composite +0.6%; Kospi -0.1%; Nikkei225 +0.7%; ASX 200 +0.6%
- Equity Futures: S&P500 +0.1%; Nasdaq100 +0.0%, Dax +0.0%; FTSE100 +0.0%
- EUR 1.1613-1.1745; JPY 112.85-113.08; AUD 0.7370-0.7395;NZD 0.6764-0.6788
- Aug Gold -0.1% at $1,225/oz; Sept Crude Oil -0.4% at $66.92/brl; Sept Copper +0.2% at $2.75/lb
Elliott Wave Analysis: Amazon Showing Impulse Rally
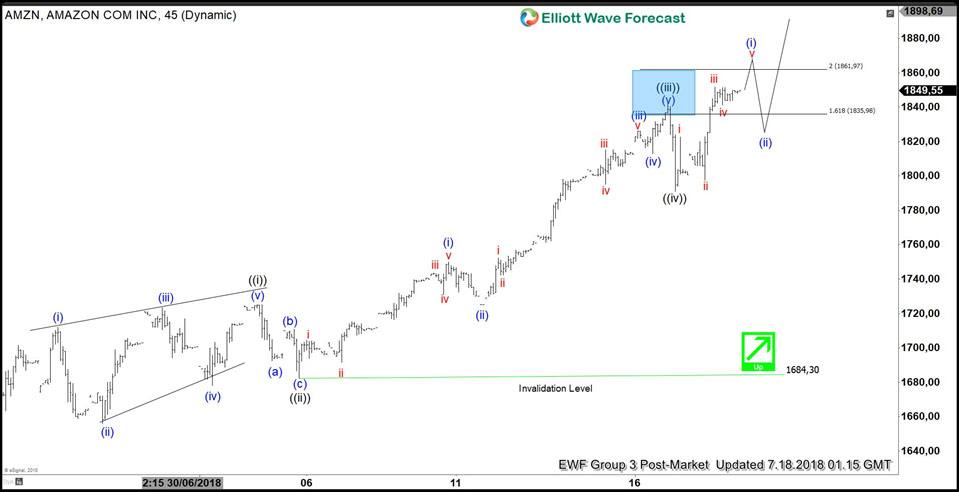
Amazon ticker symbol: $AMZN short-term Elliott wave analysis suggests that the cycle from 6/25/2018 low ($1646.31) is rallying higher in an impulse structure. This suggests that the internal sub-division of each leg higher is unfolding as 5 waves structure of lesser degree i.e Minute wave ((i)), ((iii)) & ((v)), whereas Minute wave ((ii)) & ((iv)) has subdivision of 3 corrective waves.
Up from $1646.31 low, a rally higher to $1725 high completed Minute wave ((i)) in 5 waves leading diagonal structure. Down from there, the 3 waves pullback to $1684.30 low ended Minute wave ((ii) as zigzag. Above from there the stock made another 5 waves advance which ended Minute wave ((iii)) at $1841.95 peak. Below from there, the pullback to $1791 low ended Minute wave ((iv)) in lesser degree 3 swings. Up from there Minute wave ((v)) remains in progress which is expected to unfold in another 5 waves structure.
The minimum extension area for Minute wave ((v)) i.e inverse 1.236-1.618% Fibonacci extension of Minute wave ((iv)) comes at $1853.82-$1873.35. In case of further extension, Minute wave ((v))=((i)) target area comes at $1868.58-$1887.15 area for the completion of cycle from 6/25/2018 low in Minor wave 1 or wave A. Afterwards, the stock is expected to do a pullback in Minor wave 2 or wave B in 3, 7 or 11 swings before further upside is seen provided the pivot from $1646.31 low stays intact. We don’t like selling it.
Amazon 1 Hour Elliott Wave Chart