

Sample Category Title
USDJPY Outlook: Heads Towards 2018 High But Bulls Might Be Interrupted By Overbought Daily Techs
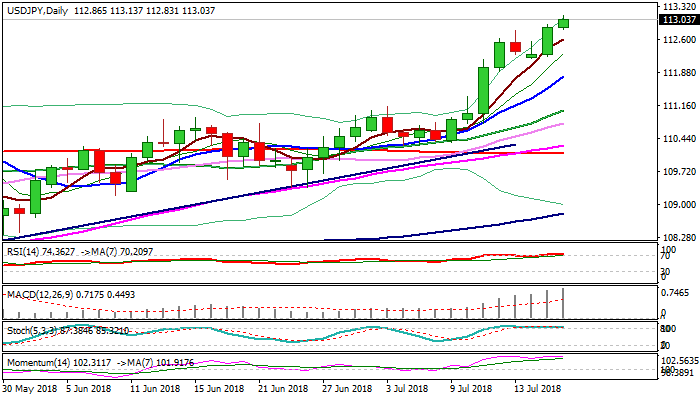
The pair extends strong rally to new multi-month high at 113.13 on Wednesday, as the dollar was boosted by hawkish comments from Fed's chief Powell.
Tuesday's 0.5% advance completed two-day 112.80/112.19 correction, which left inverted Hammer and signaled further advance.
Bulls are looking for retest of 2018 high at 113.38 (08 Jan) and Dec 2017 highs at 113.63/74 in extension.
Strong bullish sentiment was additionally boosted by hawkish remarks from Powel, which increase expectations for more rate hikes this year.
On the other side, overbought daily RSI and slow stochastic, with bearish divergence developing on 14-d momentum, warn of correction, but still without firmer signals.
Extended dips should find footstep above higher low at 112.19 (16 July trough) to keep bulls intact and avert risk of deeper correction on break.
Res: 113.13, 113.38, 113.63, 113.74
Sup: 112.83, 112.61, 112.19, 111.79
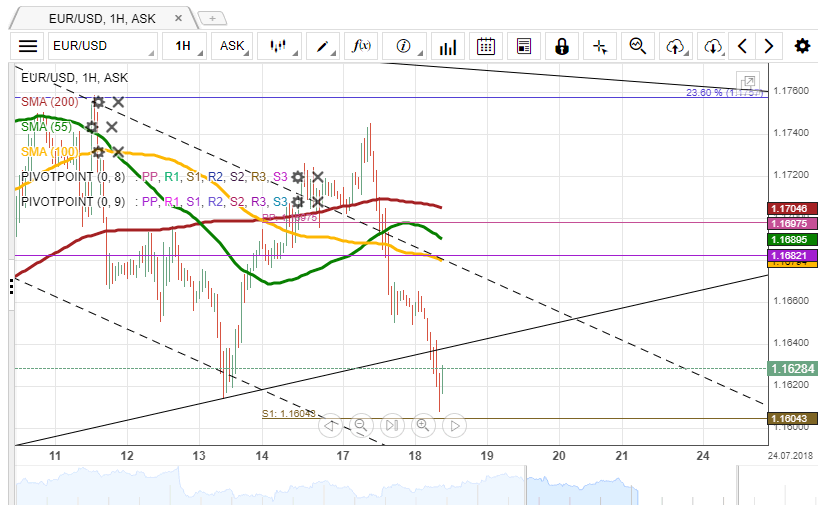
EUR/USD Likely Breakout
Downside risks have prevailed in the market since yesterday thus allowing the common European currency to decline 94 pips against the US Dollar. The currency pair managed to surpass the 55-, 100-, and 200– hour SMAs along the way but was unable to breached the bottom border of an ascending trendline.
According to technical indicators, some downside potential still exists in the market. In the meantime, the EUR/USD currency exchange rate could make a brief retracement north for a likely re-test of the aforementioned SMAs during the following trading session.
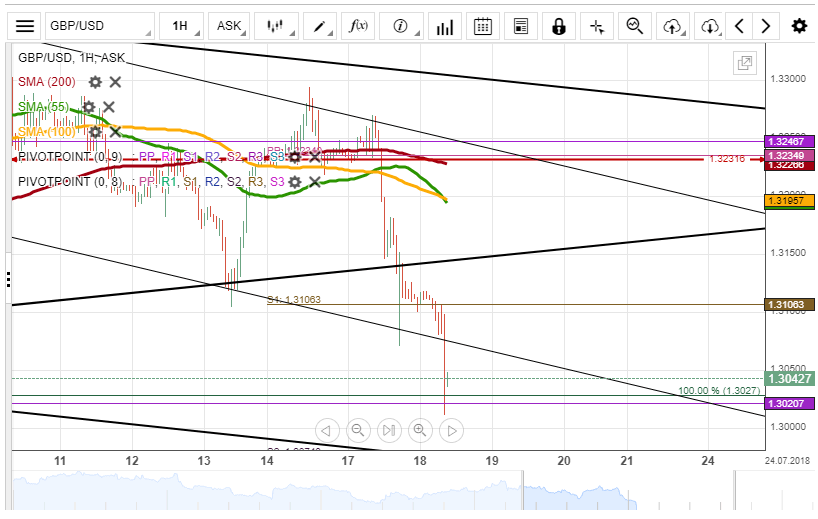
GBP/USD Strong Bearish Momentum
Downside risks prevailed in the market on Tuesday, thus sending the British Pound to crashed by 198 base points or 1.49% against the US Dollar. This decline, however, was due to the general strength of the Greenback against other major currencies and the Sterling is no exception.
Given that the 55-,100-, and 200-hour SMAs is located above the price, it is likely that the currency pair might continue its decline today.
Nevertheless, it seems that this strong bearish momentum has exhausted the strength of bulls. This could introduce the bullish sentiment within this trading session.
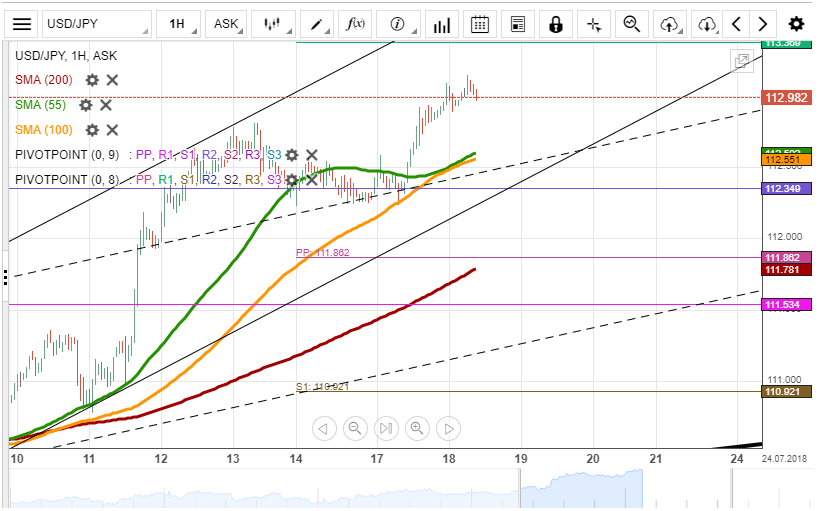
USD/JPY Pressured By SMAs
The 55– and 100-hour simple moving averages have guided the US Dollar up against the Japanese Yen since July 11. The pair has been more stable during the past few days which might point to a possible change in market sentiment.
Technical indicators both on the four-hour time frame and the daily time frame demonstrate that the USD/JPY currency pair is likely to continue moving in the ascending channel within this session.
The nearest barrier that might hinder bulls dominance over the currency exchange rate is located near the 113.36 mark.
XAU/USD High Volatility
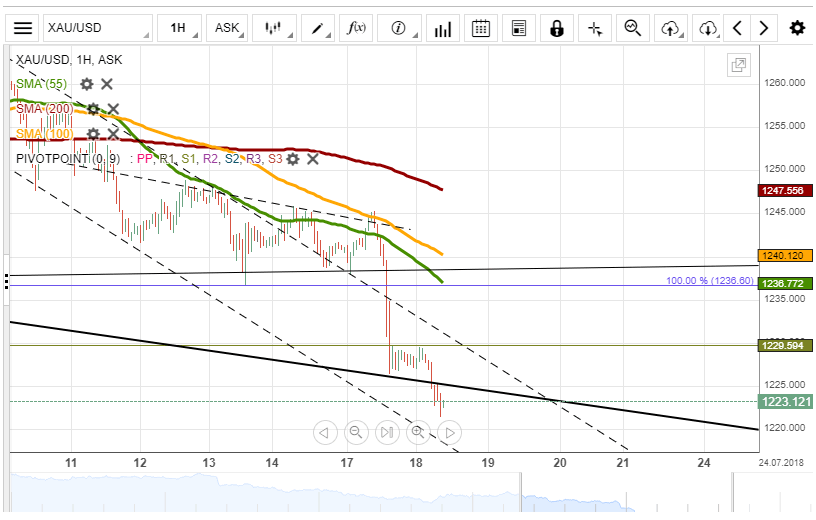
The yellow mental shown high volatility against the US Dollar on Tuesday. This decline occurred after the commodity price hit a strong resistance level formed by the 100-hour simple moving average.
By the early hours of Wednesday trading session, the pair has moved closer to the lower boundary of a descending channel and could be set for a breakout within this session.
Everything being equal, the XAU/USD exchange rate is likely to continue its downward movement during the following hours. Meanwhile, technical indicators flash sell signals.
The Analytical Overview of the Main Currency Pairs
The EUR/USD currency pair
Technical indicators of the currency pair:
Prev Open: 1.17101
Open: 1.16596
% chg. over the last day: -0.49
Day's range: 1.16251 – 1.16649
52 wk range: 1.0571 – 1.2557
The bearish sentiment prevails on the EUR/USD currency pair. During yesterday's and today's trading sessions, the drop in quotations has counted to 80 points. Demand for the American currency grew after the speech by the Fed's head. The regulator noted the stability of the labor market and his plans for a gradual increase in the key interest rate. At the moment, the key trading range is 1.16250-1.16500. We recommend opening positions from these marks. We are waiting for important economic reports.
The news feed on 2018.07.18:
- The consumer price index in the Eurozone at 12:00 (GMT+3:00);
- Statistics on the real estate market in the US at 15:30 (GMT+3:00);
- The Fed's "Beige book" at 21:00 (GMT+3:00).
We also recommend paying attention to the speech by the Fed's head.
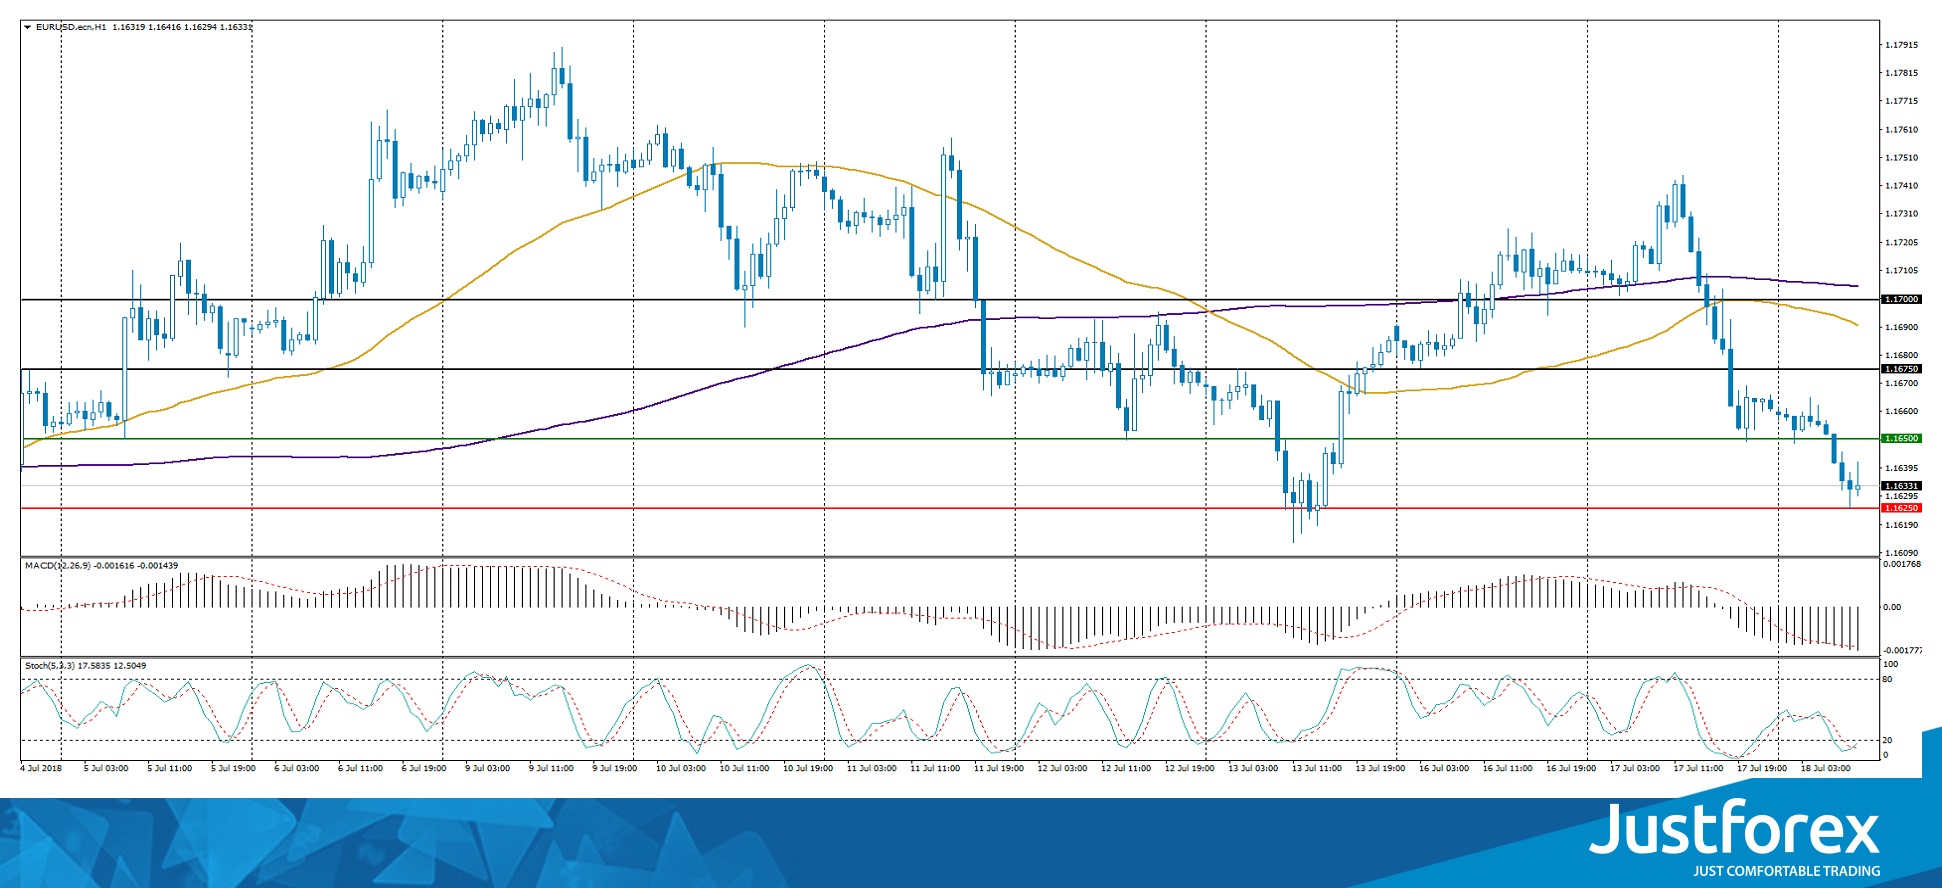
The price has fixed below 50 MA and 200 MA, which indicates the power of sellers.
The MACD histogram is located in the negative zone and below the signal line, which gives a strong signal to sell EUR/USD.
Stochastic Oscillator is in oversold zone, the %K line is crossing the %D line. There are no accurate signals.
Trading recommendations
Support levels: 1.16250, 1.16000, 1.15500
Resistance levels: 1.16500, 1.16750, 1.17000
If the price fixes below the support level of 1.16250, further decline in EUR/USD is expected. The movement is tending to 1.16000-1.15500.
Alternative option. If the price fixes above 1.16500, we recommend you to look for entry points to open long positions. The target movement level is 1.16750-1.17000.
The GBP/USD currency pair
Technical indicators of the currency pair:
Prev Open: 1.32330
Open: 1.31103
% chg. over the last day: -0.99
Day's range: 1.30793 – 1.31169
52 wk range: 1.2361 – 1.4345
Yesterday aggressive sales were observed on the GBP/USD currency pair. The drop in quotations exceeded 130 points. Demand for the US dollar has grown significantly after the statements by the Fed's head. Additional pressure on the pound was caused by a weak report on the labor market in the UK. At the moment, GBP/USD is testing the local support and resistance levels: 1.30750 and 1.31150, respectively. The positions must be opened from these marks.
At 11:30 (GMT+3:00), the UK consumer price index will be published.
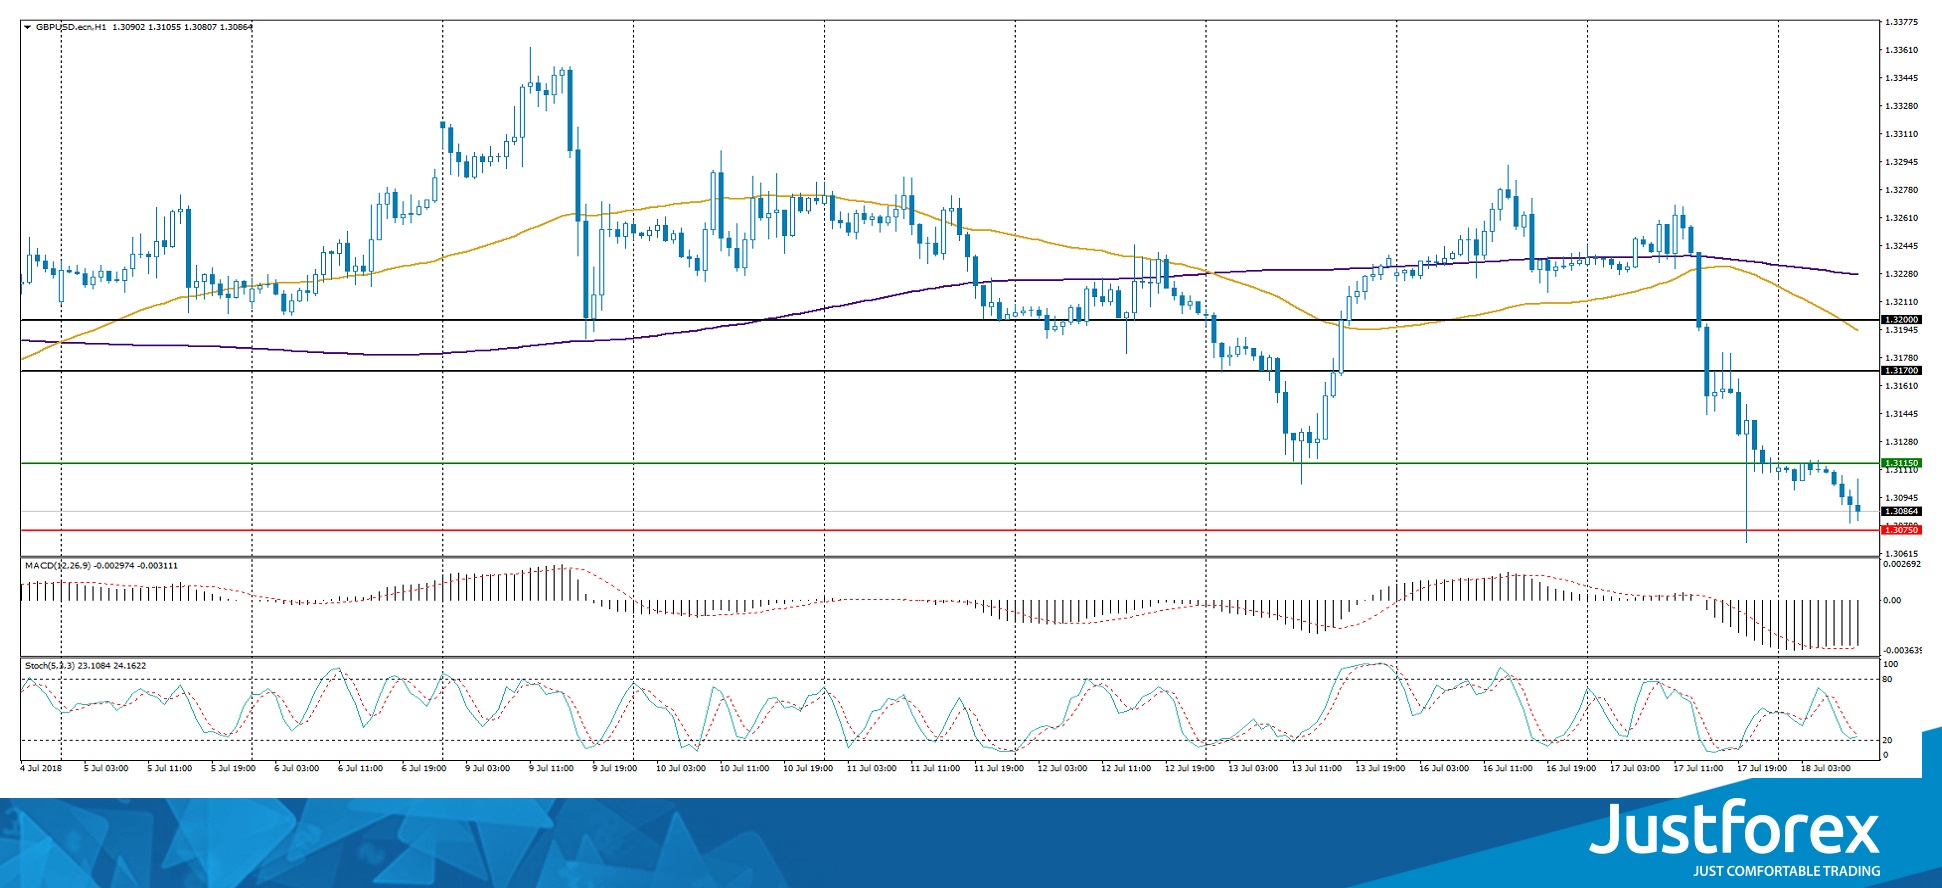
Indicators point to the power of sellers. The price has fixed below 50 MA and 200 MA.
The MACD histogram is in the negative zone, but above the signal line, which gives a weak signal to sell GBP/USD.
Stochastic Oscillator is located in the neutral zone, the %K line is below the %D line, which indicates the bearish sentiment.
Trading recommendations
Support levels: 1.30750, 1.30250, 1.30000
Resistance levels: 1.31150, 1.31700, 1.32000
If the price falls below the support level of 1.30750, further fall of the GBP/USD currency pair is expected. The movement is tending to 1.30300-1.30000.
Alternative option. If the price fixes above 1.31150, it is necessary to consider buying GBP/USD. The movement is tending to 1.31500-1.31700.
The USD/CAD currency pair
Technical indicators of the currency pair:
Prev Open: 1.31367
Open: 1.31928
% chg. over the last day: +0.52
Day's range: 1.31907 – 1.32453
52 wk range: 1.2059 – 1.3795
At the moment there are aggressive purchases of USD/CAD. During yesterday's and today's trading, the growth of quotations exceeded 100 points. The trading instrument has updated a monthly maximum. At the moment the USD/CAD quotes are testing the local resistance of 1.32400. The mark of 1.32150 is already a "mirror" support. The currency pair is tending to grow. We recommend opening positions from the key levels.
The news feed on Canada's economy is calm.
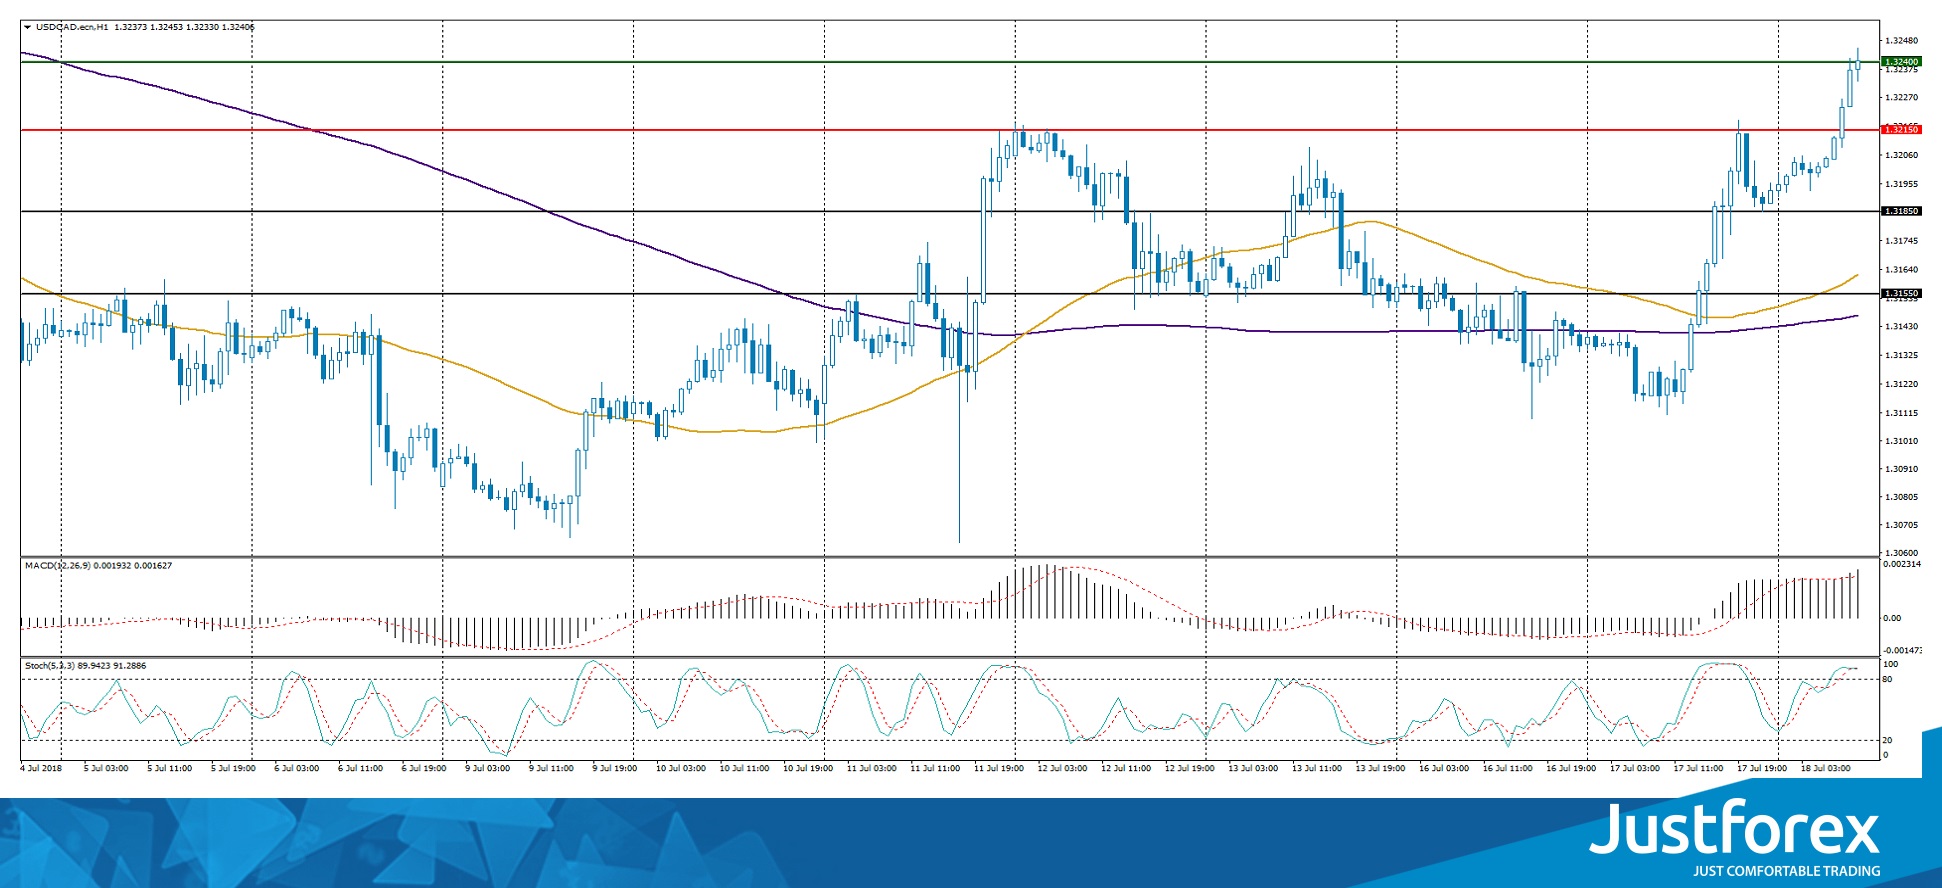
Indicators point to the power of buyers: the price has fixed above 50 MA and 200 MA.
The MACD histogram is in the positive zone and above the signal line, which gives a strong signal to buy USD/CAD.
Stochastic Oscillator is located in the overbought zone, the %K line is crossing the %D line. There are no signals at the moment.
Trading recommendations
Support levels: 1.32150, 1.31850, 1.31550
Resistance levels: 1.32400, 1.33000
If the price fixes above the local resistance of 1.32400, further growth of the USD/CAD currency pair is expected. The movement is tending to the round level of 1.33000.
Alternative option. If the price fixes below the "mirror" support of 1.32150, a correction movement is expected. The target level of movement is 1.31850-1.31700.
The USD/JPY currency pair
Technical indicators of the currency pair:
Prev Open: 112.269
Open: 112.858
% chg. over the last day: +0.65
Day's range: 112.833 – 113.137
52 wk range: 104.56 – 114.74
USD/JPY continues to show positive dynamics. Currently, quotes are testing monthly highs. The key trading range is 112.800-113.100. In the near future, a technical correction is not ruled out. We recommend paying attention to the news feed from the USA. Positions must be opened from the key levels.
The publication of important economic reports from Japan is not planned.
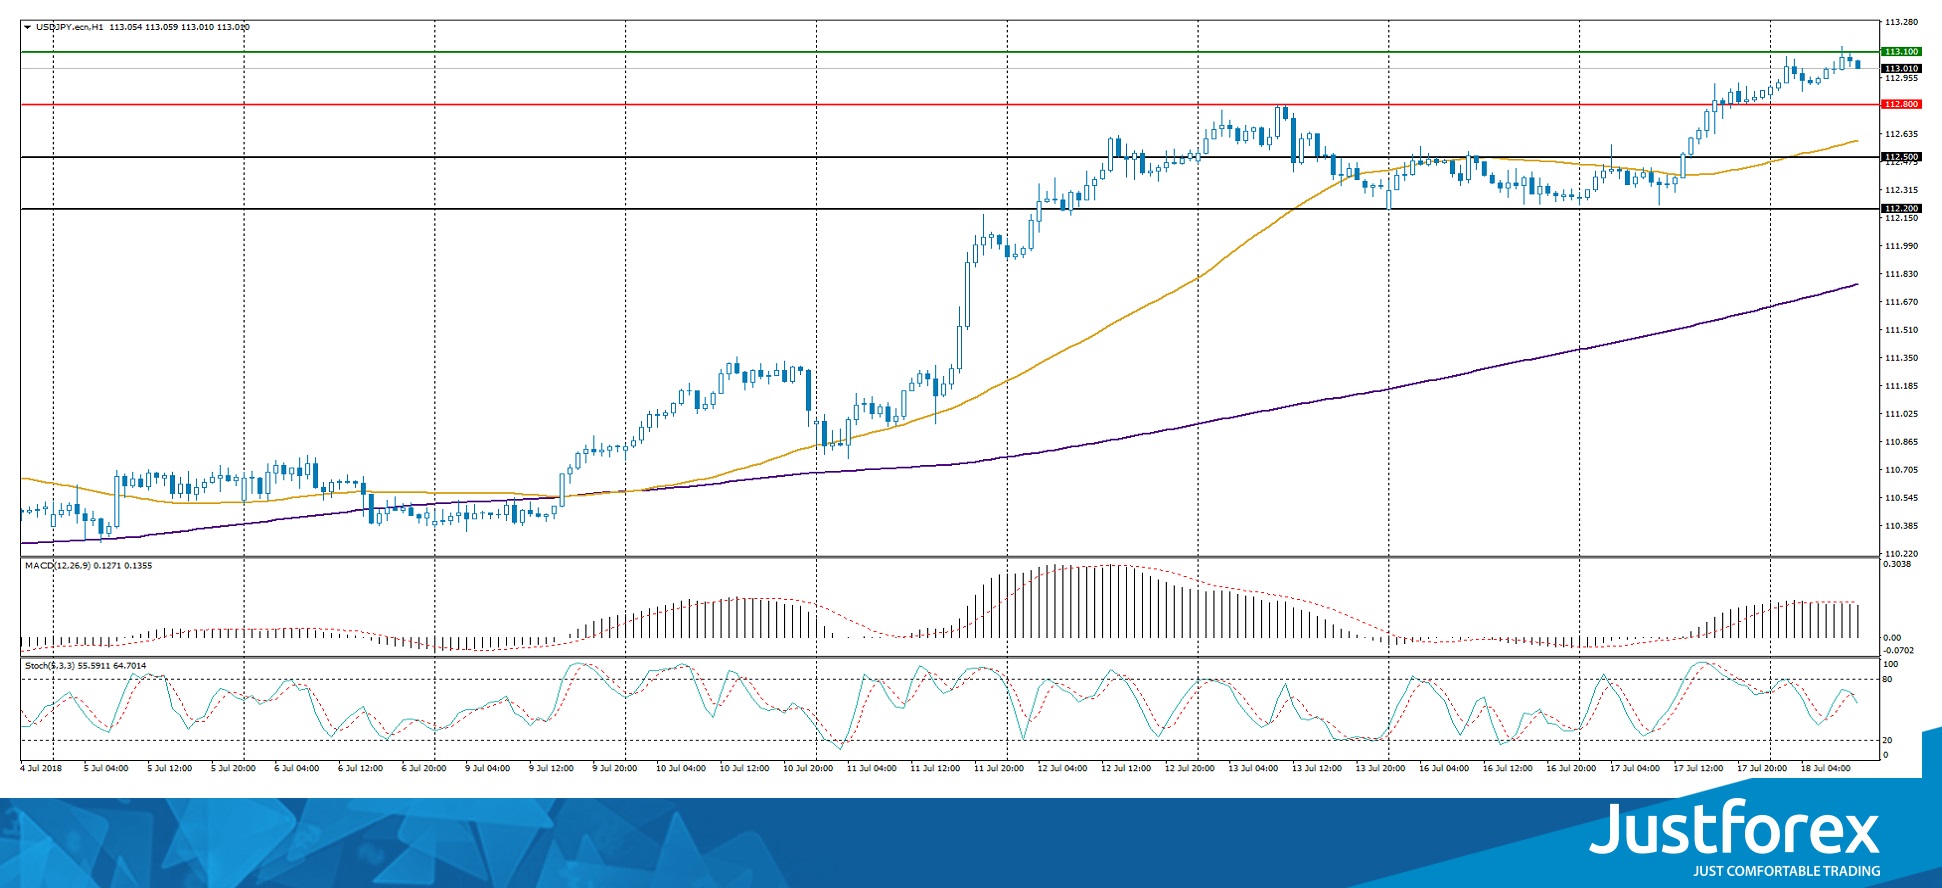
The price has fixed above 50 MA and 200 MA, which indicates the power of buyers.
The MACD histogram is in the positive zone, but below the signal line, which gives a weak signal to buy USD/JPY.
Stochastic Oscillator is located in the neutral zone, the %K line is crossing the %D line. There are no signals at the moment.
Trading recommendations
Support levels: 112.800, 112.500, 112.200
Resistance levels: 113.100, 113.500
If the price fixes above the 113.100 level, you should consider buying USD/JPY. The movement is tending to 113.500-113.750.
Alternative option. If the price falls below the "mirror" support level of 112.800, the correction of the USD/JPY currency pair is expected. The target level of movement is 112.500-112.300.
Blackrock Venturing Into Cryptos
Sellers in the OTC market are holding off their Bitcoin
The FOMO (fear of missing out) element for Bitcoin is very strong
Blackrock is also thinking of venturing into the world of cryptos
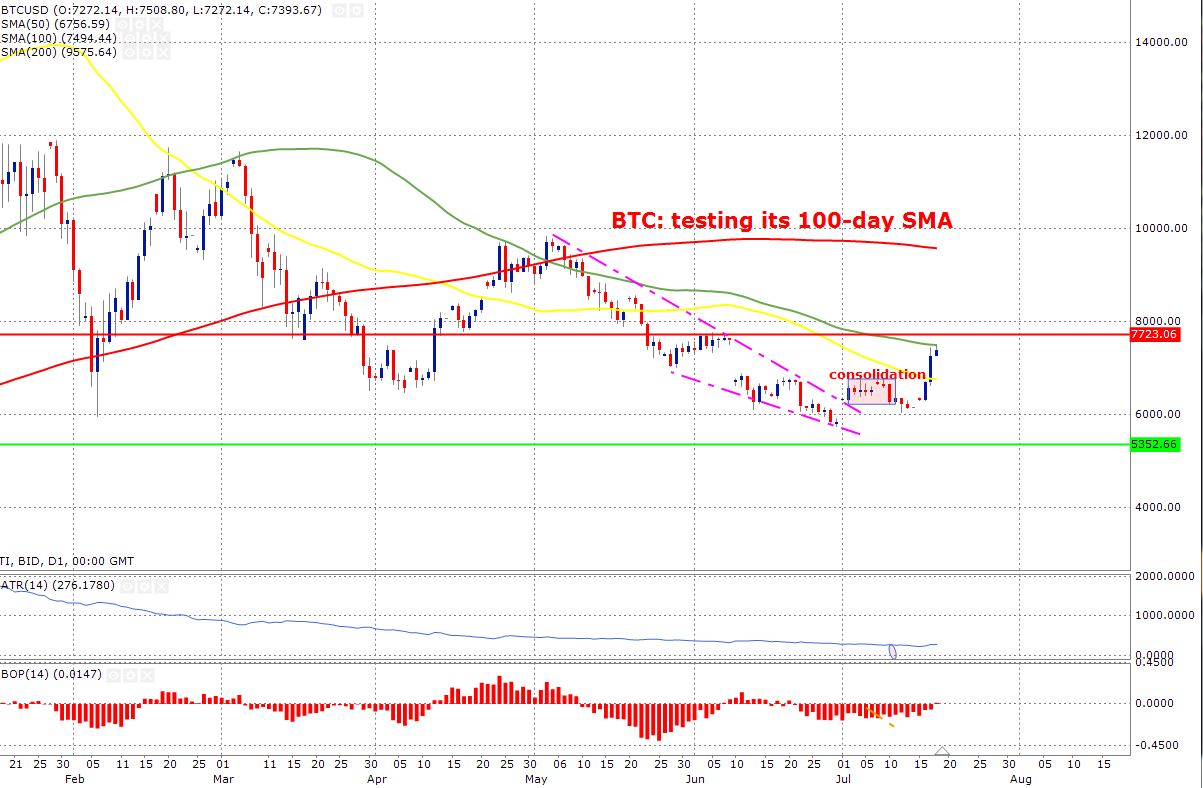
If there is anything worth talking about today, it surely is the crypto space. Bitcoin has crossed the $7K and it is trading near $7,500. Year to date, we are still down by -47.85% but the $600 move in one hour (yesterday) was a remarkable one. The sellers in the OTC market are holding off their Bitcoin as they believe that the price is going to go high. On the other hand, buyers are eager to find sellers so that they can buy low and sell high.
The question is what has instigated this move?
As we said yesterday, the suppressive bear market conditions are fading and with yesterday’s move (especially if the momentum continues at this pace), it will be only a matter of time that everyone would completely forget about the bear market altogether. Remember, the FOMO (fear of missing out) element for Bitcoin is very strong and it drives the trading action aggressively. Regulatory space is becoming more digestible for cryptos, countries like Japan which has shown a lot more tougher attitude towards cryptos in the past are becoming friendlier. For instance, SBI, a major financial firm in Japan, opened its crypto exchange for traders says it all.
But to narrow down the focus on a specific event which triggered this move is; Blackrock, the world’s largest exchange-traded fund provider and asset manager is also thinking in venturing into the world of cryptos. When Goldman Sachs announced its crypto trading desk, we did see that their competitors are not going to be reticent. Of course, these bigger institutions have not had the chance to enjoy crypto parties yet and now they are on it. Although, the CEO of Blackrock didn’t fully back the rumours after the report, but it absolutely makes sense that the world largest asset manager would dive into the crypto world because now we are at a stage where one can actually use various techniques to form valuations on cryptocurrencies.
Another event which is worth keeping an eye on today is the Congress discussion on crypto. The House Committee on Agriculture and Financial Policy Subcommittee both would discuss the digital assets and cryptocurrencies as money. Any positive stance by them towards cryptos would have the potential to fuel the crypto rally further.
In terms of technical analysis, the next major resistance for Bitcoin is $7,749, the high of 7th of June. On a daily time frame, the price is having a battle with its 100-day moving average which is at $7,495. The 200-day moving average is trading at $9,575 which would serve as a next resistance. Of course, the price would have to clear the psychological level of $8,000 first before targeting the 200-day moving average.
In terms of volume, it has reached a 3-month high as the price has taken out the $7K mark, this tells me that the current move is here to stay because of serious conviction behind it.
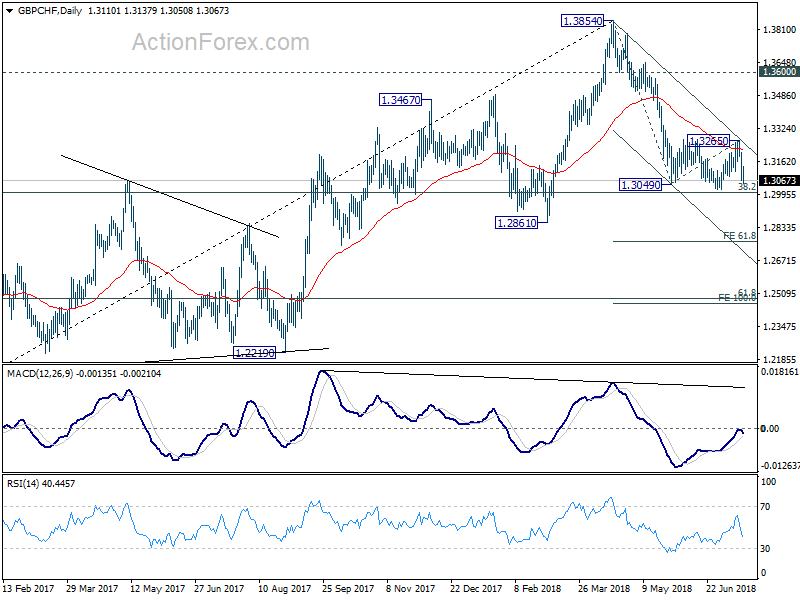
GBPCHF downside breakout imminent with today’s Sterling selloff
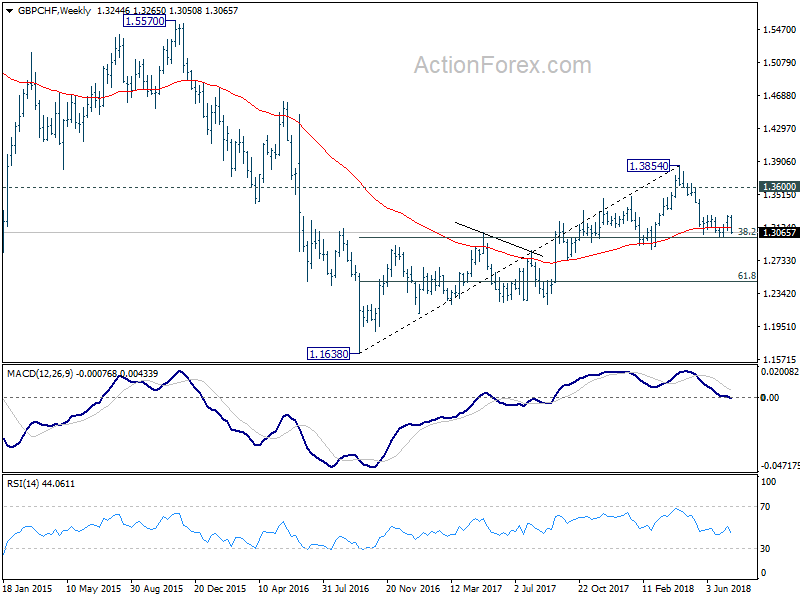
GBP/CHF's sharp fall this week now argues that the consolidation pattern from 1.3049 is completed at 1.3265, after failing to sustain above 55 day EMA. Immediate focus is back on 38.2% retracement of 1.1638 (2016 low) to 1.3854 (2018 high) at 1.3007, which is also close to 1.3 psychological level. Decisive break there will carry larger bearish implications and affirm the case that whole rise from 1.1638 has completed at 1.3854.
In that case, next near term target is 61.8% projection of 1.3854 to 1.3049 from 1.3265 at 1.2768. We'd actually expect deeper fall to 100% projection at 1.2460 in medium term. That is close to 61.8% retracement of 1.1638 to 1.3854 at 1.2485. For position trading, one can consider selling at market, with a tight stop above today's high at 1.3140, with the above two projection levels at first and second targets.
AUDUSD Retreats Below 20-Day SMA, Bearish Bias In Short And Medium Term
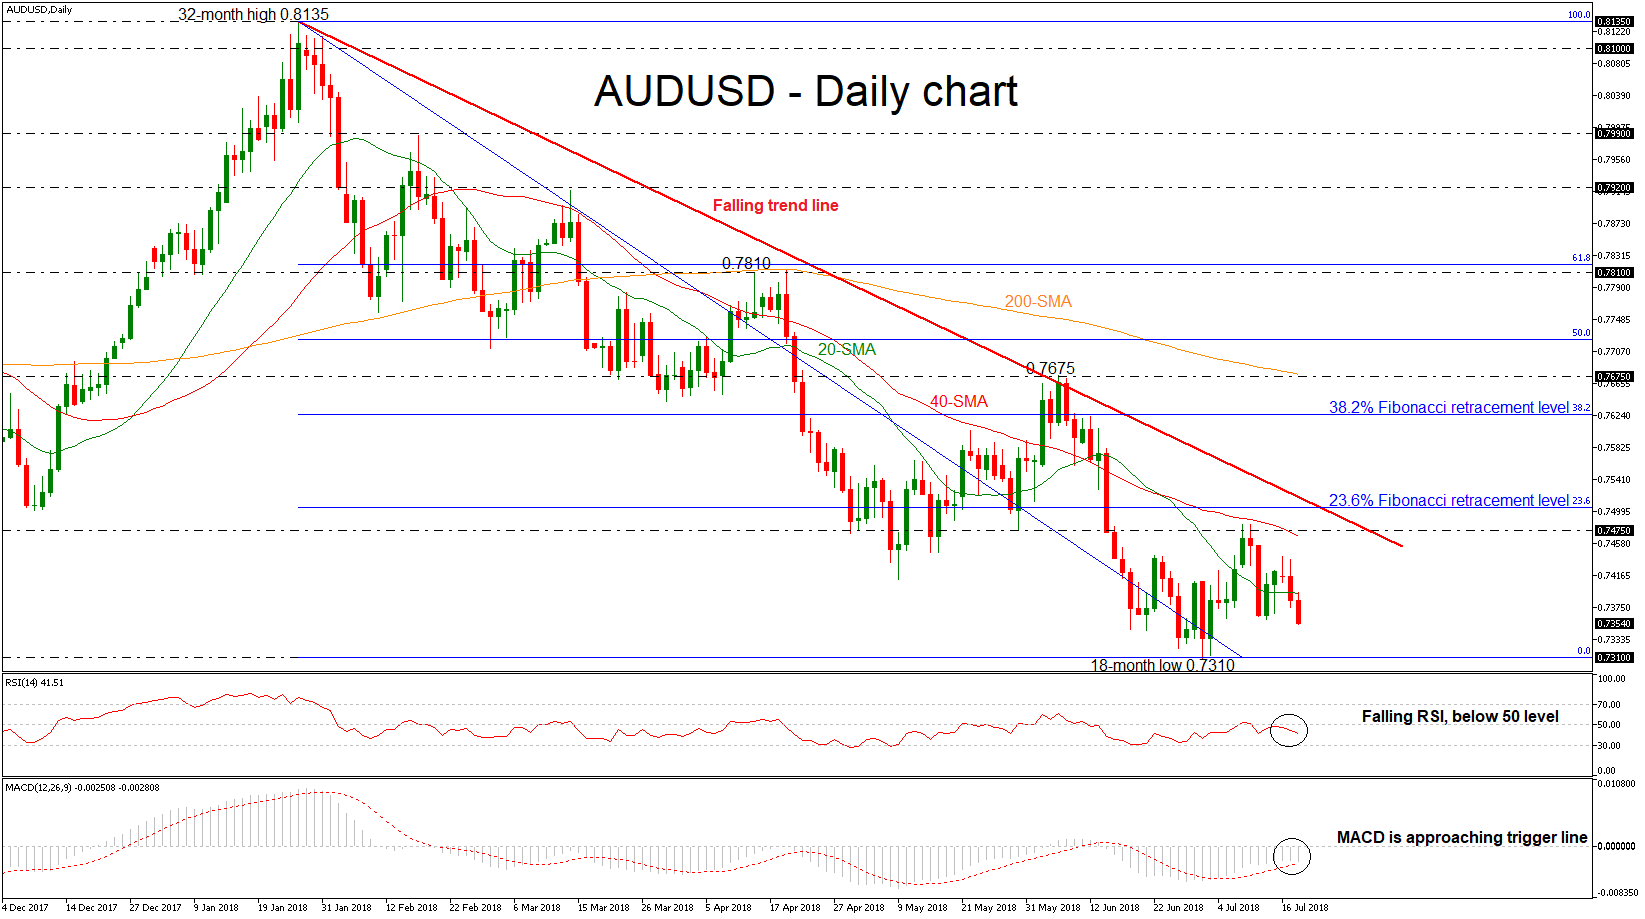
AUDUSD has eased sharply to the downside this week and the 0.7475 resistance level acted as a strong obstacle for the bulls in the preceding weekly session. Moreover, the pair dipped below the 20-day simple moving average (SMA) early in European session today, signaling further downside pressures.
The short-term technical indicators in the daily timeframe are bearish and point to more weakness in the market. The RSI indicator is sloping downwards and stands below the threshold of 50, while the MACD oscillator is strengthening again its bearish momentum and is approaching the red-trigger line.
Should prices drop further lower, this could open the way towards the 18-month low of 0.7310, identified by the trough on July 2. Further downside extensions could drive the pair until the 0.7160 hurdle, taken from the bottom on December 2016. There are no significant support obstacles before that level.
On the flip side, the first resistance for investors to have in mind is the 0.7475 barrier, which stands near the 40-day SMA. If there is a jump above this region, the price could challenge the 23.6% Fibonacci retracement level of 0.7505 of the downleg from 0.8135 to 0.7310. Above this barrier, if there is an upside penetration of the falling trend line, the focus shifts to the upside until the 38.2% Fibonacci of 0.7625.
To sum up, AUDUSD has been trading within a descending move since January 26 and is in progress to hit again the 18-month low of 0.7310 in the near term.
Dollar Broadly Stronger On Powell’s Optimistic Remarks; UK Inflation Eyed
Here are the latest developments in global markets:
FOREX: The dollar continued gaining versus a basket of currencies on Wednesday after rising by a bit less than 0.5% the previous day. Upbeat comments on the US economy by Fed Chief Jerome Powell acted as the catalyst for the greenback's advance, as well as fueling risk sentiment. In light of the risk-on mood, the yen retreated, with dollar/yen reaching a fresh six-month high of 113.07 earlier on the day.
STOCKS: The Dow, S&P 500 and Nasdaq Composite finished the day higher on Tuesday by 0.2%, 0.4% and 0.6% respectively – the latter posted a fresh all-time high – being helped by Powell's optimism. Asian equities took their cue from the US, for the most part finishing in the green on Wednesday. Japan's Nikkei 225 and Topix indices advanced by 0.4% and 0.35% correspondingly, while Hong Kong's Hang Seng was down by 0.3% at 0629 GMT. Futures tracking major European benchmarks were broadly in the green, pointing to a higher open. Meanwhile, contracts on the Dow, S&P 500 and Nasdaq 100 were also trading higher, albeit only marginally so. In terms of corporate earnings: American Express, Alcoa, eBay, IBM and Morgan Stanley are some of the companies releasing quarterly results as the day unfolds; Morgan Stanley will be reporting before the opening bell on Wall Street, with all others releasing results after the market close.
COMMODITIES: WTI and Brent crude are trading lower by 0.7% and 0.6%, at $67.62 and $71.75 per barrel respectively. The two benchmarks are building on losses after the American Petroleum Institute (API) reported a surprise increase in US crude inventories on Tuesday. In the meantime, weekly EIA data on US crude stocks due at 1430 GMT may offer some short-term direction to oil prices during today's trading. In precious metals, gold is down by 0.4% at $1,222.45 per ounce, not far above a one-year low hit earlier in the day. The yellow metal, being denominated in dollars, is suffering on the back of the US currency's strength.
Major movers: Dollar advances helped by Powell, hits six-month high versus the yen
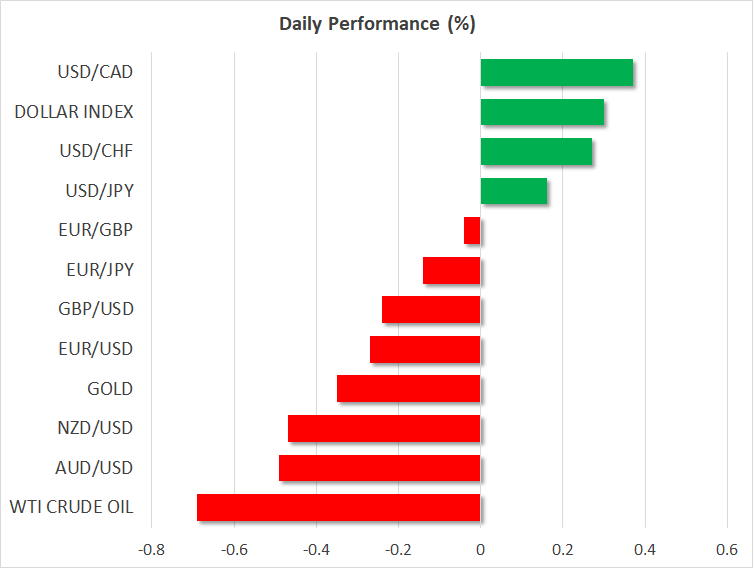
Federal Reserve Chairman Jerome Powell's upbeat take on the outlook for the US economy fueled a rally in the US currency, while soothing to an extent those wary about the potential negative effects of a trade war. The dollar index is up by 0.25% on Wednesday, with dollar/yen not far below its highest since January 9 of 113.07. Moreover, it is no longer the case that the Japanese currency is trading in the green versus the US currency in 2018.
In the meantime, the euro and sterling are extending yesterday's decline against the greenback, as Powell lent credence to those expecting the US central bank to remain on a path of rate normalization. The British currency, which also posted notable losses versus the euro on Tuesday, is also coming under pressure on the back of Brexit related uncertainty that is also casting doubts on PM Theresa May's leadership. Later on Wednesday, the pound is expected to be sensitive to inflation figures which have the capacity to affect Bank of England policymakers' judgement regarding the delivery of a rate hike during their early August meeting.
The commodity-linked loonie, aussie and the kiwi also fell victims to broad dollar strength. In particular, USDCAD touched a near three-week high of 1.3241 and AUDUSD recorded a two-week low of 0.7344 on Wednesday.
Day ahead: UK & EU report on inflation; Fed chief testifies before the House Financial Services Committee
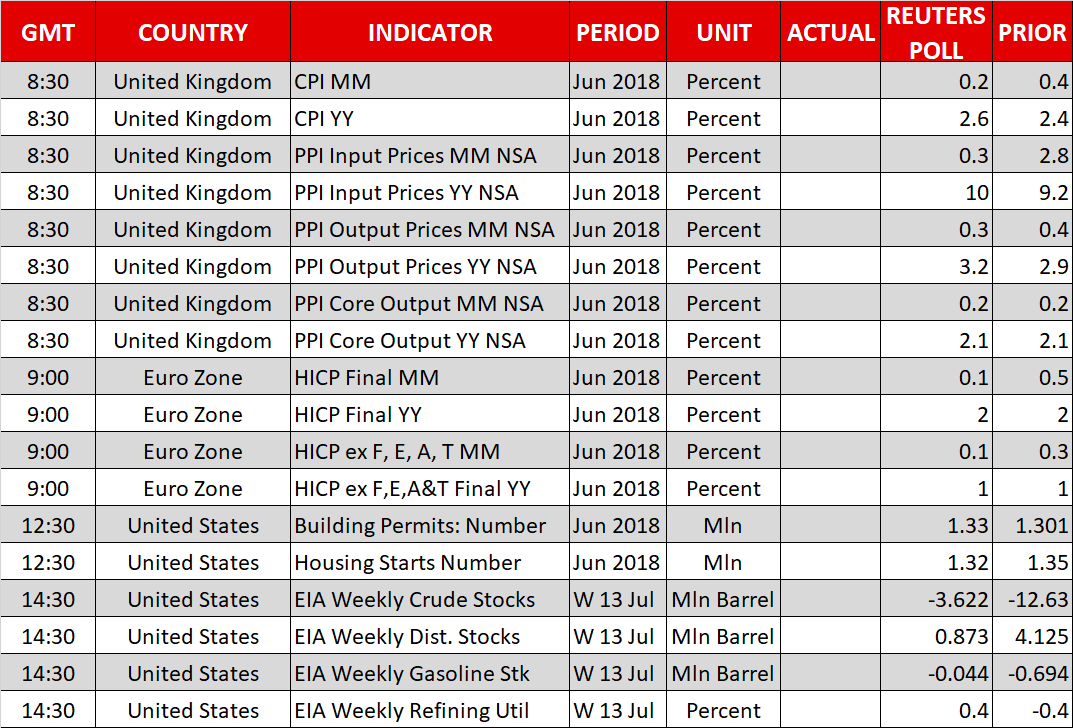
After a bearish trading session on Tuesday, sterling will be eyeing UK's inflation numbers due today at 0830 GMT to potentially recover losses made on the back of political uncertainty stemming from disagreements within the Tory party over the nation's Brexit strategy. Analysts expect the headline CPI to have risen faster in June, picking up by 2.6% y/y compared to a growth of 2.4% in May, while on a monthly basis the gauge is anticipated to weaken by 0.2 percentage points, growing by 0.2%. Should the numbers beat expectations, increasing chances for a rate hike by the Bank of England in August, sterling could start erasing Tuesday's downfall. On the other hand, a miss in the data may see the currency turning more bearish, reaching fresh lows. Producer price and retail price data will also be made public at the same time.
At 0900 GMT, the Eurozone will see the release of June's CPI figures as well, though these would be final estimates and unless the data deviate significantly from preliminary predictions the euro is not expected to react much. According to forecasts, the headline CPI (HICP, the measure that uses a common methodology across EU countries) is anticipated to come in line with previous estimates on a yearly basis, confirming a growth of 2.0% compared to 1.9% in May. The core measure of inflation which excludes food, energy, alcohol, and tobacco is also projected to match the preliminary release, expanding by 1.0% y/y.
Out of the US, June's building permits and housing starts are due at 1230 GMT. The number of housing starts is projected to decline by 2.2% m/m after rising by 5.0% in May, to come close to a near 11-year high. Still, the focus will remain on the Fed Chief Jerome Powell and his semi-annual testimony on the economy and monetary policy in front of the House Financial Services Committee at 1400 GMT. Testifying before the Senate Banking Committee on Tuesday, Powell signaled that the US economy is strong enough to withstand further rate hikes this year and that trade uncertainties will probably not keep the Fed from proceeding accordingly. In the meantime, the Fed's Beige Book gauging economic conditions in the twelve Federal districts in the US is due at 1800 GMT.
Technical Analysis: GBPUSD dives below 1.3100; bearish bias still in place
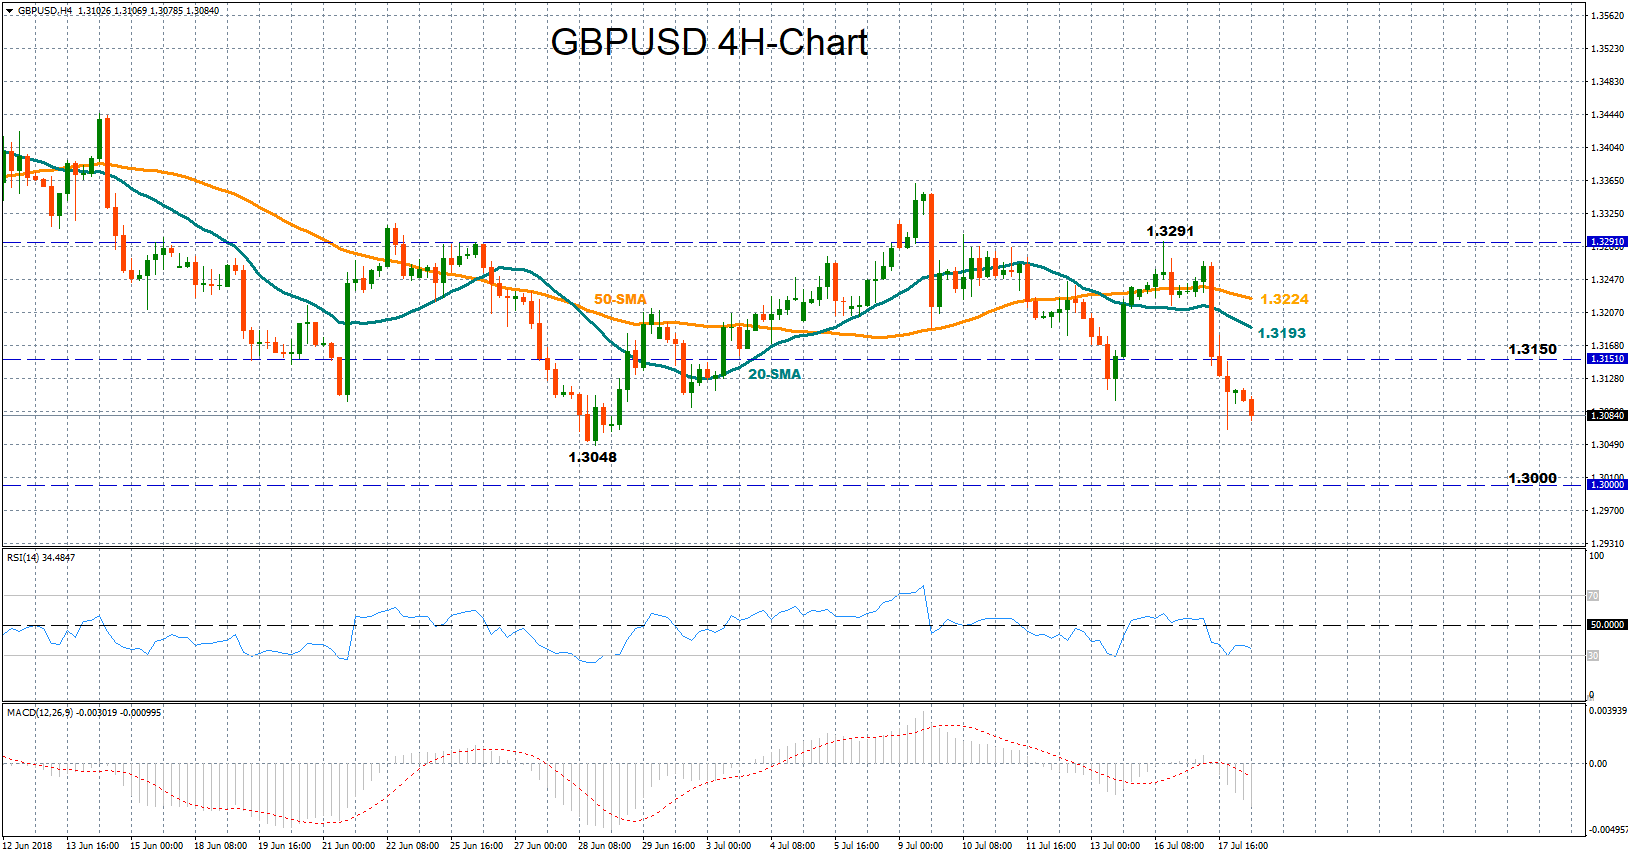
GBPUSD turned aggressively to the downside on Tuesday, losing 1.2% to approach three-week lows at 1.3067. Today the bearish sentiment continues to weigh on the pair, with the MACD pointing to further weakness as the indicator increases negative momentum below zero and its red signal line. The RSI also fluctuates in bearish territory, though its heading towards oversold levels, hinting that a rebound could be around the corner.
Should the price bounce above the 1.31 key-level in case CPI numbers come in stronger than expected, immediate resistance could come around 1.3150 where the price paused for a while back in June. A leg higher could then touch the 20-period moving average currently at 1.3193 before bulls meet the 50-period MA at 1.3224. The previous high at 1.3291 (July 16), though, could prove a stronger obstacle to break as the price topped several times around this peak in the past.
Conversely, a fall in GBPUSD on the back of disappointing UK figures that negatively affect the prospects for a BoE hike in August could retest June’s trough of 1.3048, the lowest level reached this year. Further below, the 1.30 round figure would be eyed next.