

Sample Category Title
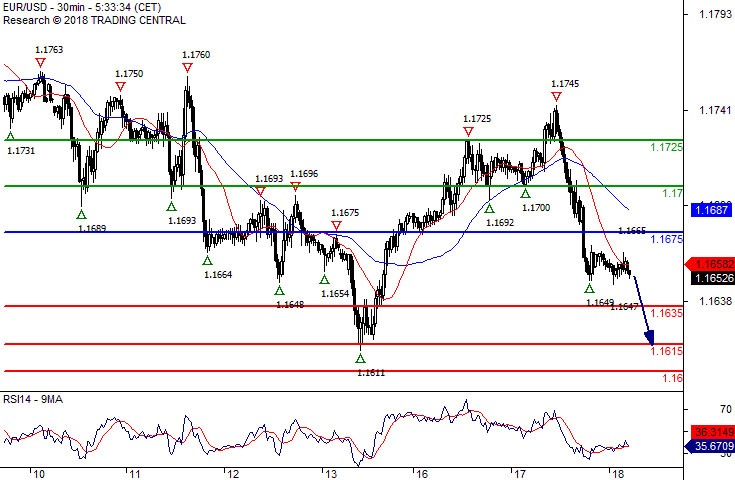
EUR/USD The Downside Prevails
Pivot (invalidation): 1.1675
Our preference Short positions below 1.1675 with targets at 1.1635 & 1.1615 in extension.
Alternative scenario Above 1.1675 look for further upside with 1.1700 & 1.1725 as targets.
Comment As Long as the resistance at 1.1675 is not surpassed, the risk of the break below 1.1635 remains high.
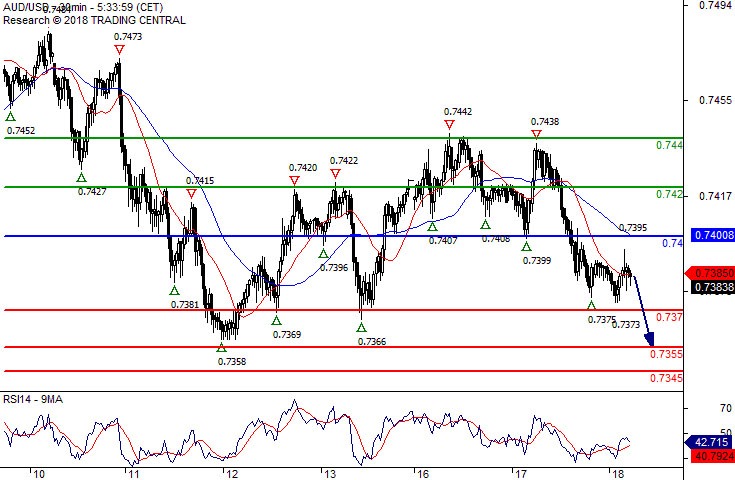
AUD/USD Key Resistance At 0.7400
Pivot (invalidation): 0.7400
Our preference Short positions below 0.7400 with targets at 0.7370 & 0.7355 in extension.
Alternative scenario Above 0.7400 look for further upside with 0.7420 & 0.7440 as targets.
Comment As Long as 0.7400 is resistance, look for choppy price action with a bearish bias.
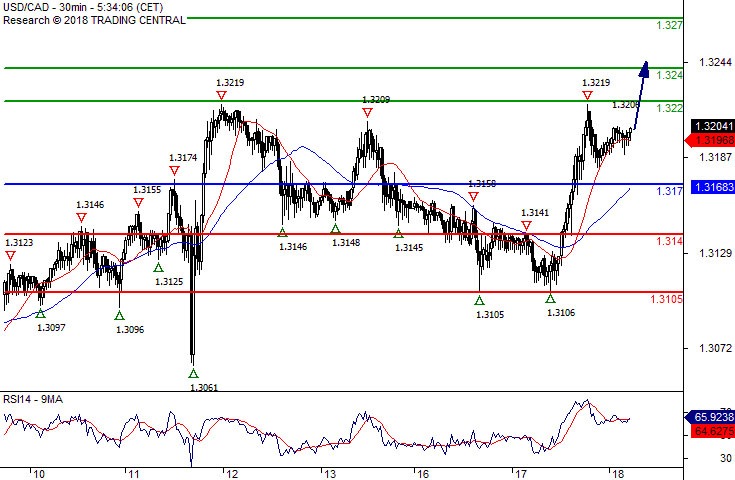
USD/CAD Further Upside
Pivot (invalidation): 1.3170
Our preference Long positions above 1.3170 with targets at 1.3220 & 1.3240 in extension.
Alternative scenario Below 1.3170 look for further downside with 1.3140 & 1.3105 as targets.
Comment The RSI is bullish and calls for further upside.
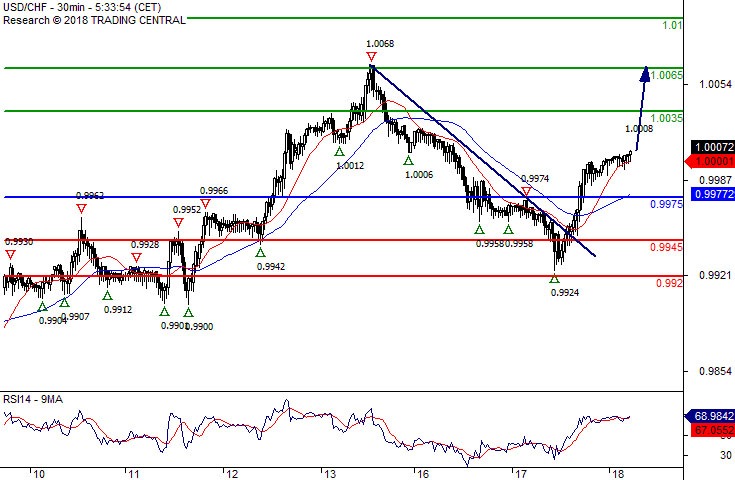
USD/CHF Further Advance
Pivot (invalidation): 0.9975
Our preference Long positions above 0.9975 with targets at 1.0035 & 1.0065 in extension.
Alternative scenario Below 0.9975 look for further downside with 0.9945 & 0.9920 as targets.
Comment The RSI is bullish and calls for further advance.
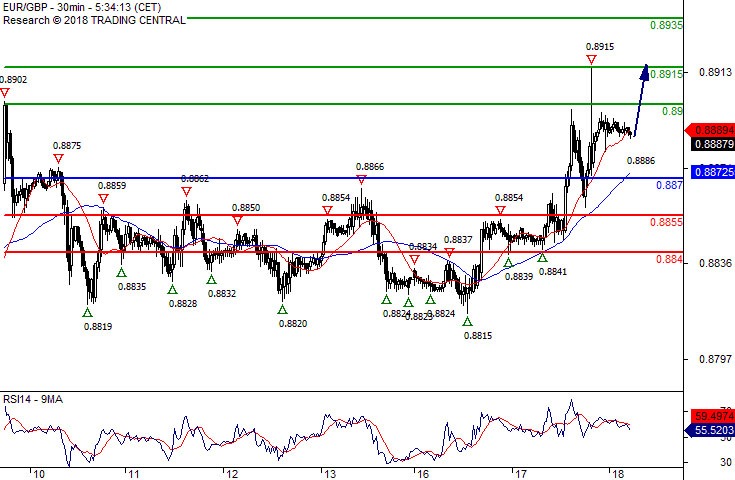
EUR/GBP The Bias Remains Bullish
Pivot (invalidation): 0.8870
Our preference Long positions above 0.8870 with targets at 0.8900 & 0.8915 in extension.
Alternative scenario Below 0.8870 look for further downside with 0.8855 & 0.8840 as targets.
Comment Even though a continuation of the consolidation cannot be ruled out, its extent should be limited.
Using Fibonacci Levels in Your Trading
An Italian mathematician who went by the name of Leonardo Pisano, or Leonardo of Pisa, was perhaps the most talented western mathematician of the middle ages. Better known by his nickname ‘Fibonacci’, he was the gentleman who discovered an interesting relationship between nature and numbers.
0, 1, 1, 2, 3, 5, 8, 13, 21, 34… Look familiar?
This is a Fibonacci sequence. The next number in the series is found by adding the two numbers before it. For example, number 2 is found by adding 1+1. 3 is found by adding 1+2 and 5 is found by adding 2+3 and so on and so forth. To that end, the next number in the sequence shown above is 21+34 = 55.
So, what does this have to do with trading the financial markets? Well, put simply, we can use these levels to find support and resistance…
Fibonacci retracements
Arguably Fib’ retracement levels are the most heavily used in all of the Fibonacci readings. The most popular Fib’ retracement values are 61.8%, 50.0% and 38.2%. In saying this though, the 50.0% level does not have anything to do with Fibonacci numbers. Traders, however, still use this value because markets have a tendency to reverse after retracing 50.0% of the previous move.
Fib’ retracement levels are, in our opinion, far easier to spot in a trending environment. That is, of course, not to say that they cannot be used in ranging markets.
The general idea is to buy on a retracement at a Fib’ support level when the market is trending north, and to sell on a retracement at a Fib’ resistance level when the market is trending south.
In order to draw Fib’ retracement levels, we need to find a significant swing low and swing high. As they say, a picture is worth a 1000 words, so let’s get out a chart!
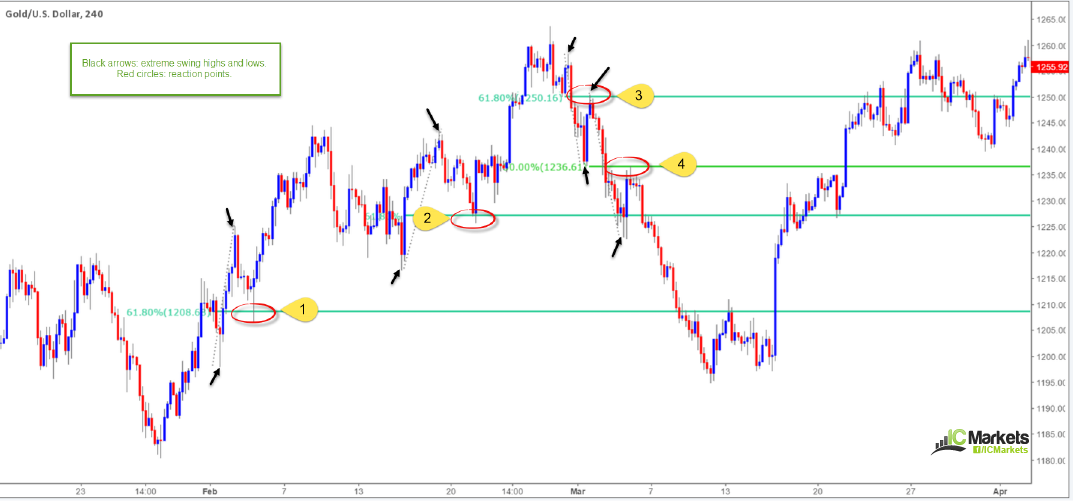
On the chart above, example 1 shows a clear swing low and high was identified (marked by the two black arrows). Price, as you can see, retraced relatively quickly and touched base with the 61.8% Fib’ retracement support level, which allowed buyers to enter the market and lift the unit higher.
Examples 2, 3 and 4 are near-mirror images. The only real difference is that we’re trading Fib’ resistances in examples 3 and 4, and also the 50.0% retracement level came into play in example 4.
Fibonacci extension
The Fib’ extension tool, which should be available on most trading platforms, can help determine both profit targets and potential areas of support/resistance in the market. Through experience and a truckload of back testing, here is how our team exploit this tool in our trading.
Firstly though, to draw the Fib’ extension levels we, again, look for a significant swing high and swing low.
To reveal the Fib’ extensions, after point 2 is in motion, simply drag the cursor back down/up to point 1, which we’ll label as point 3 for ease of reference here. Also of note, we only utilize the 127.2% (the square root of 161.8%) and 161.8% value since these levels proved to be the most reliable in our testing. Around 60% in fact.
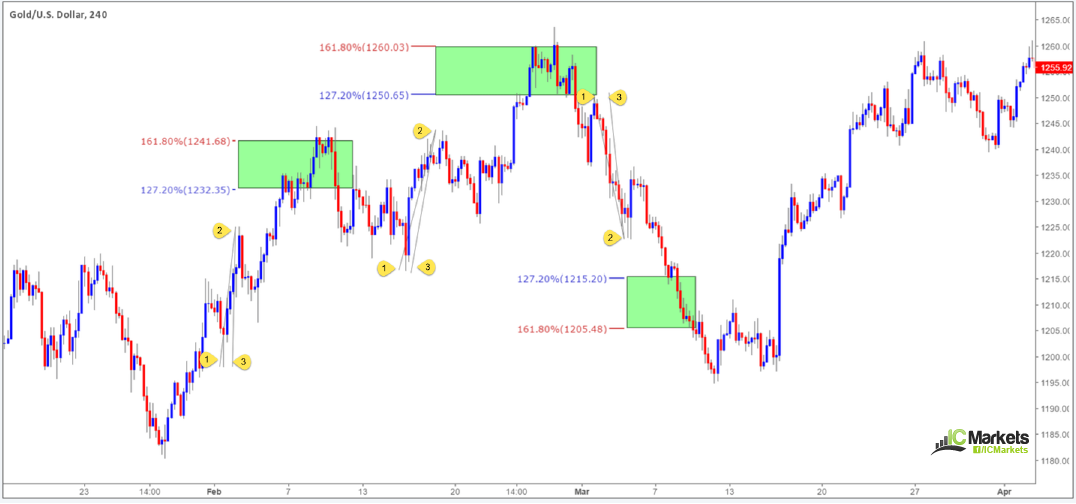
On the chart above, the first 2 examples eventually found a ceiling of resistance between the 127.2%/161.8% Fib’ extension levels. The final example, however, failed to offer any type of support.
Additional points to consider…
- Fib’ levels work well when they unite with structure i.e. supply and demand, support and resistance and psychological numbers.
- Fib’ levels are NOT the holy grail. Trading them expecting each trade to win is going to end in frustration!
- Fib’ clusters are also very attractive. We’ll try to touch on this techniques in future articles.
- The two Fib’ values 61.8 and 1.618 are known as the golden ratio or golden mean. It is said that the proportions are somewhat pleasing to the human eye, and appears throughout biology, art, music and architecture. Both numbers are looked highly upon by market speculators.
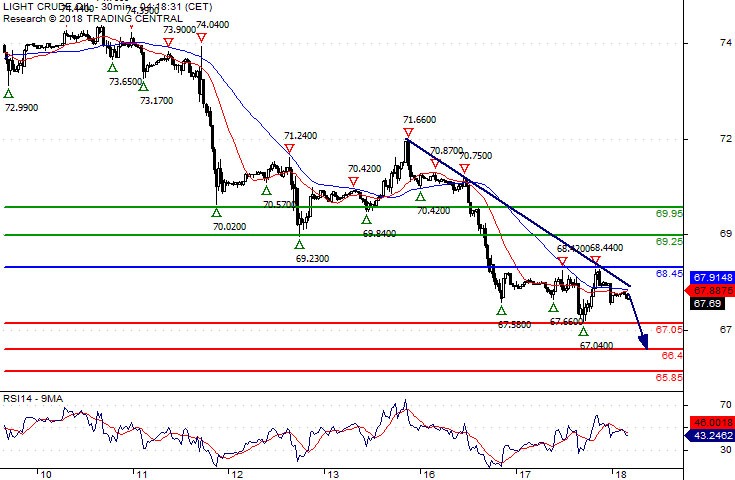
Crude Oil Key Resistance At 68.45
Pivot (invalidation): 68.45
Our preference Short positions below 68.45 with targets at 67.05 & 66.40 in extension.
Alternative scenario Above 68.45 look for further upside with 69.25 & 69.95 as targets.
Comment As Long as the resistance at 68.45 is not surpassed, the risk of the break below 67.05 remains high.
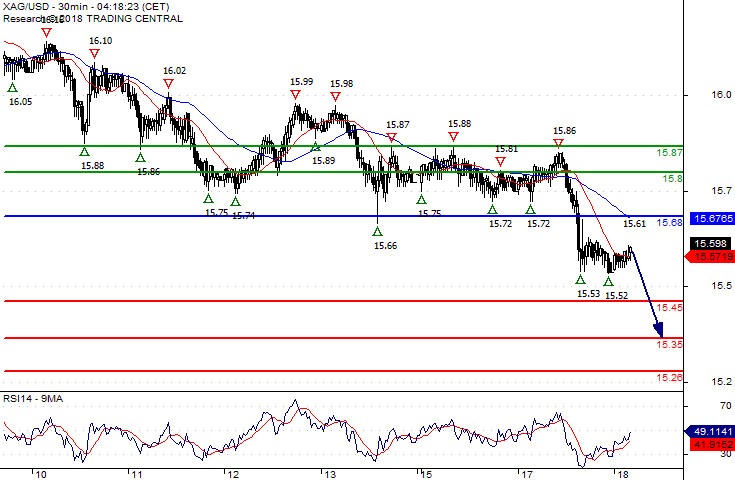
Silver Spot Target 15.4500
Pivot (invalidation): 15.6800
Our preference Short positions below 15.6800 with targets at 15.4500 & 15.3500 in extension.
Alternative scenario Above 15.6800 look for further upside with 15.8000 & 15.8700 as targets.
Comment The RSI is mixed to bearish.
Gold Spot The Downside Prevails
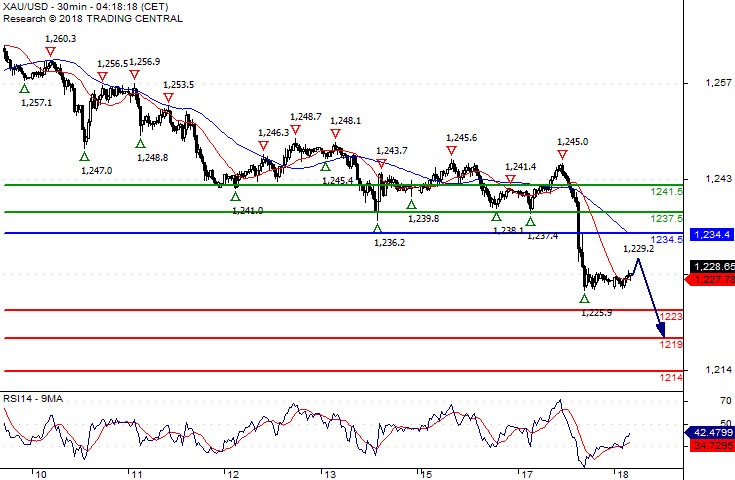
Pivot (invalidation): 1234.50
Our preference Short positions below 1234.50 with targets at 1223.00 & 1219.00 in extension.
Alternative scenario Above 1234.50 look for further upside with 1237.50 & 1241.50 as targets.
Comment The RSI is mixed to bearish.
Combatting the Dreaded Analysis Paralysis
Despite a perfectly reasonable trading opportunity in the offing, traders frequently find themselves analysing and questioning the setup’s validity, placing them in a position of uncertainty.
Overthinking a situation or a decision can lead to a phenomenon called analysis paralysis, often resulting in no decision being made at all.
Recognizing analysis paralysis in your trading
There are a multitude of variables involved in trading:
- The style of trading one adopts, be it intraday, swing or position.
- The markets traded: commodities, stocks and currencies etc.
- The timeframes and the tools used to make decisions.
- Fundamental analysis or technical analysis.
This is enough to overwhelm just about anyone, particularly newer traders!
With all these choices, deciphering what is truly important can be challenging. Unfortunately, this often translates into a chart (for you technicians) overflowing with various indicators, similar to the mess seen below:
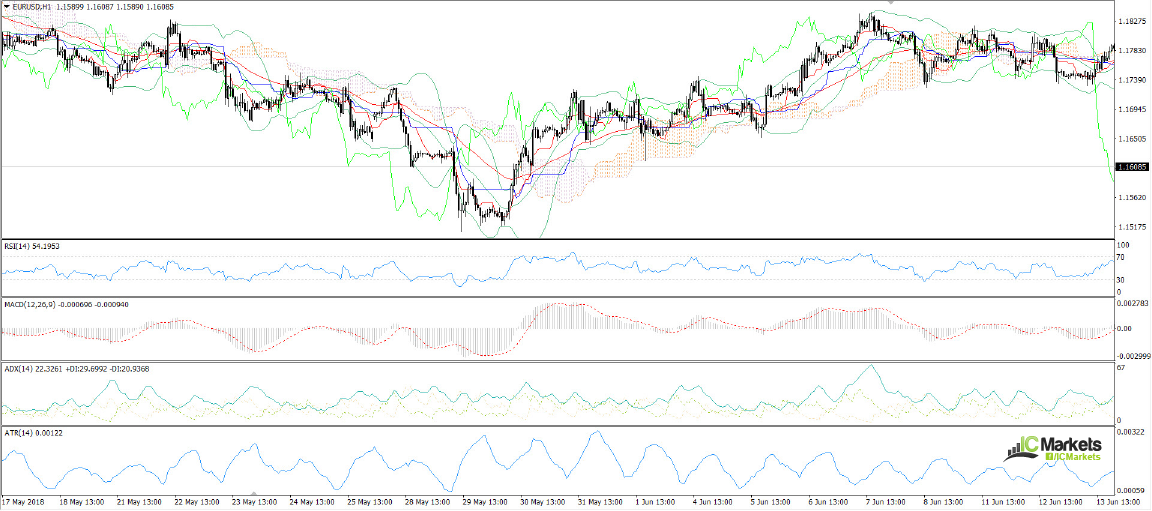
A difficult habit to overcome is the need to coat your charts with as many levels and indicators as possible. We get it. You’re trying to cover all angles of the chart. But by doing this, though, you will only hinder your development as a trader. This can lead to bad decisions which typically end with a washed-out account.
Check out the chart below. By clearing your canvas you’re able to observe market movement in a clearer light, hopefully prompting clearer decisions.
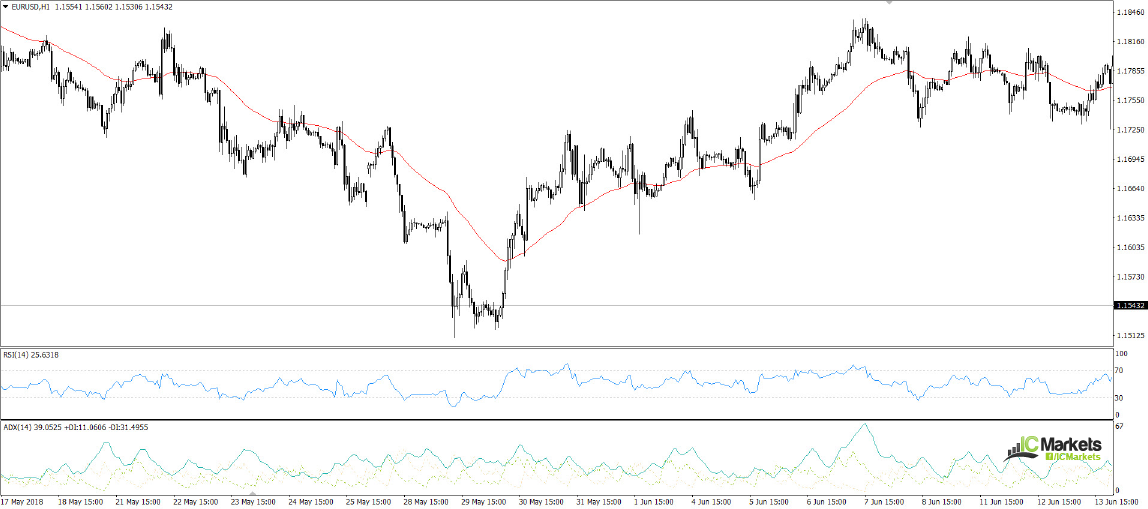
To illustrate our point further, let’s imagine you trade supply and demand combined with trend line analysis. This is how you view market movement, according to your trading plan.
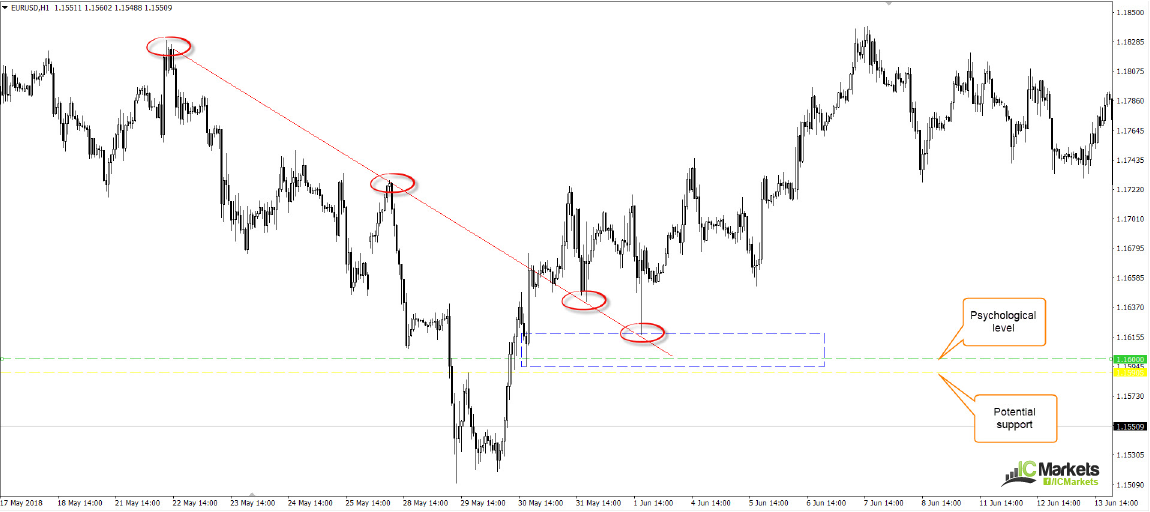
Looking at the EUR/USD H1 chart below, say you plotted the H1 demand area marked in blue and happened to notice it fused perfectly with a H1 trend line resistance-turned support. In addition to your analysis, however, you also noted the 1.16 handle positioned inside the demand zone and potential H1 support a few pips below it at 1.1590. Given these factors, you decided to wait because you thought price would visit the 1.16 neighbourhood before taking off north. By doing this – overanalysing a setup – you missed a highly profitable trade!
Had you never marked up the round number and additional H1 support, which both were not specified in your trading plan, you wouldn’t have concluded that the unit would likely drive lower before advancing north. Instead, you’d have simply followed your plan and took the trade.
Simplicity – Keep it Simple Simon
Analysis paralysis occurs when an individual becomes so lost in the process of examining and evaluating various points of data that they are unable to make a decision.
Within the trading domain, keeping it simple is often touted. Instead of overthinking the process, it is far more effective to keep everything about your approach as simple as possible.
To help avoid falling victim to analysis paralysis, developing a solid trading methodology that is mechanical will help tremendously. Although you will still likely succumb to the temptation of overanalysing a market from time to time, it will become much less of a problem with a trading plan in hand that you’re confident in. How does one attain this confidence? By meticulously back testing the method and also forward testing it under live trading conditions.
The methodology should outline which market(s) to focus on, what timeframes to analyse and what tools to use etc. For a more in-depth look at trading plans, please feel free to check out our four-part series on how to build a trading plan: How To Build a Trading Plan Part One
Final words
Remember, trading should be as objective and as mechanical as possible. Feeling the need to overanalyse a setup is a sign you’re either not following the rules of your (tried and tested) trading methodology, or you simply don’t have a plan at all. If you’re the latter, do yourself a HUGE favour and start pencilling down your approach and testing it. This, as highlighted above, will help no end and should, with time, help control the need to overthink your setups.