Sample Category Title
BoE Carney and Cunliffe to testify on financial stability at the Commons, live stream
BoE Governor Mark Carney is going to testify on the Financial Stability report at the Commons. Deputy Governor Jon Cunliffe will be there too. Starts at 0800 GMT
https://www.youtube.com/watch?v=myWRx53EZ9E
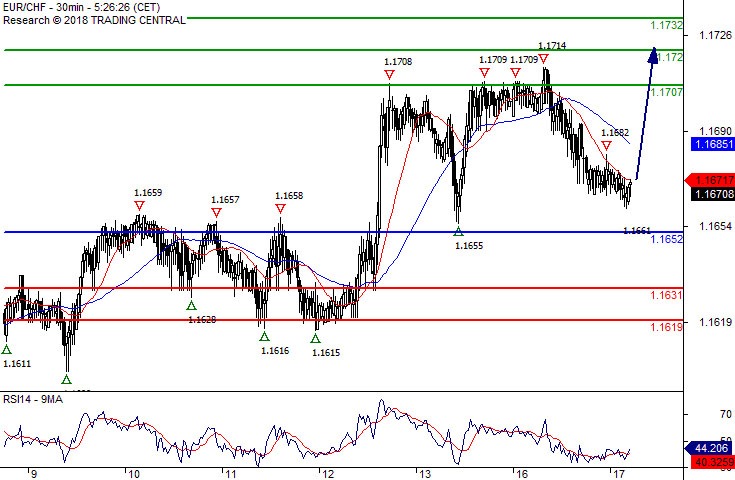
EUR/CHF Rebound Towards 1.1707
Our pivot (invalidation) point is at 1.1652.
Our preference Rebound towards 1.1707.
Alternative scenario The downside breakout of 1.1652 would call for 1.1631 and 1.1619.
Comment The RSI is below 50. The MACD is above its signal line and negative. The configuration is mixed. Moreover, the pair is trading under both its 20 and 50 MAs (respectively at 1.1673 and 1.1687).
EUR/GBP Limited Upside
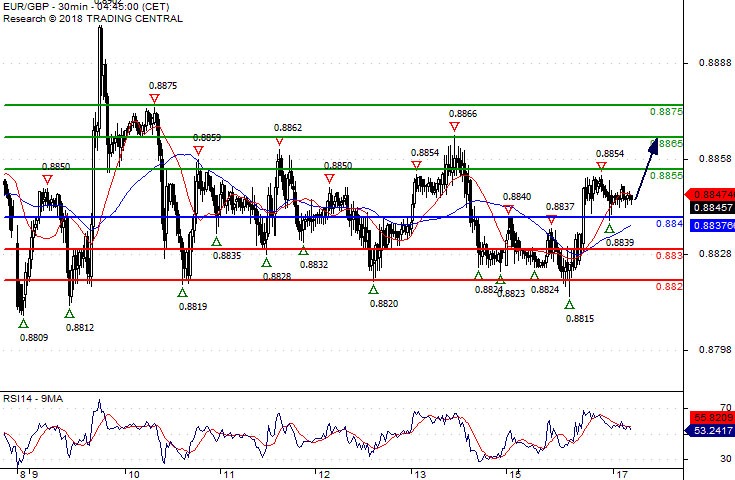
Pivot (invalidation): 0.8840
Our preference Long positions above 0.8840 with targets at 0.8855 & 0.8865 in extension.
Alternative scenario Below 0.8840 look for further downside with 0.8830 & 0.8820 as targets.
Comment A support base at 0.8840 has formed and has allowed for a temporary stabilisation.
Introduction to Trading the Flag Pattern
In this final tutorial in the series of trading the flag patterns, we take a closer look into the main elements that comprise the flag pattern and also how traders can make use of these elements in order to not only enter trades based on the flag pattern formations but also be able to manage their trades better. So far, we have learned that flag patterns can be a great way to trade, especially around a news release as it shows a perfect confluence of both fundamentals and technical analysis. Flag patterns basically come under the break out trading strategies, where trades are taken when price breaks out of a consolidation phase. The added advantage of trading with the flag patterns comes from the fact that they are often continuation pattern of the previous momentum, be it bullish or bearish. Therefore, flag patterns offer a higher level of reliability than trading traditional horizontal break outs.
Elements of a Flag Pattern
The flag pattern comprises of nothing more than support and resistance levels that are formed. The chart below gives the key levels in a flag pattern.
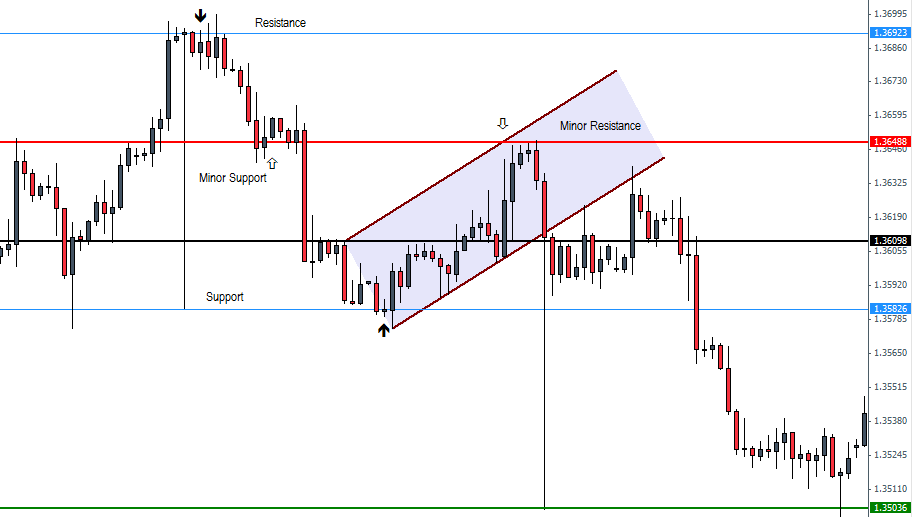
The main elements of the chart pattern can therefore be as follows:
- The flag post high and low are usually the main resistance and support levels (or reversed in case of a bullish flag).
- When price bounces off the flag post’s low (or high in case of a bullish flag), price consolidates into a flag pattern and usually reverses near what is known as a minor resistance (or support).
- After plotting the flag pattern, trades are entered on the break out of the flag or on retest to the break out level
- In most cases, traders tend to place their stops above the minor resistance formed in the flag (or below the minor support formed in a bullish flag) and target the measured distance from the break out level.
- A major flaw here being that flags can be invalidated and this is often seen based on how price reacts to the bottom of the flag post (or the high in case of a bullish flag). Flags that fail often tend to reverse from this level. In such a scenario price may or may not reach the flag’s target price level.
The importance of the support/resistance levels in the flag
Understanding the major support and resistance levels and the minor support and resistance levels can help traders to manage their trades. As noted above, traders should always look for price to clear the major resistance or support levels which generally provides good hints as to whether price will reach the flag’s target level as intended.
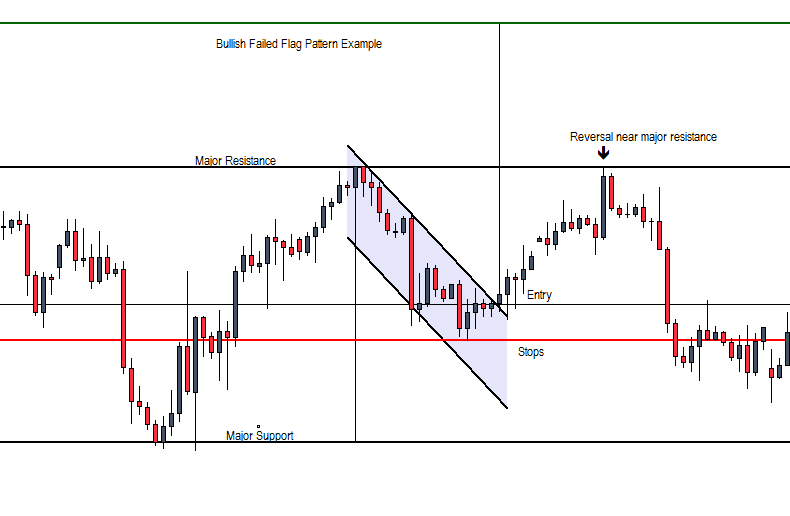
The chart below shows an example of a failed flag pattern that invalidated the set up merely based on how price reacted to the major support or resistance levels.
Here, we can notice that while initially price broke out from the bullish flag meeting most of the criteria, price failed to break above the major resistance level. For the astute trader, the reversal near this major resistance level provides early clues that the flag pattern could potentially fail. Thus, instead of continuing to keep the trade open, traders could either move their trades to break even or even look to locking some profits in anticipation of an invalidation of the flag pattern.
True enough, we notice a bearish harami candlestick pattern formed right near the major resistance which later resulted in price falling lower and invalidating the bullish flag.
Another way to ensure that you are trading on the right side of the trend is to take into consideration the major prevailing trend and only trade flag patterns that validate the major trend. For example, if the overall trend is up, look to trading only the bullish flag and if the trend is down, look to trading the bearish flag patterns in order to minimize the rate of failure.
Flag Chart Patterns – In Conclusion
As we can see in this article as well as the previous two articles, flag patterns can be a good and simple way to trade with the trend while at the same time taking advantage of break outs. While flags usually offer a low risk high reward trade set ups, combining the elements of the flag patterns as well as looking to the candlestick patterns can help traders to greatly improve their win rates at the same time be able to manage their trades as well.
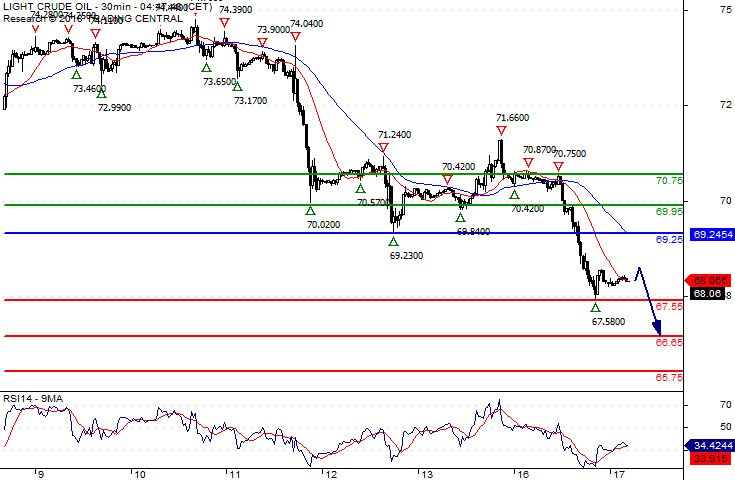
Crude Oil Key Resistance At 69.25
Pivot (invalidation): 69.25
Our preference Short positions below 69.25 with targets at 67.55 & 66.65 in extension.
Alternative scenario Above 69.25 look for further upside with 69.95 & 70.75 as targets.
Comment The RSI lacks upward momentum.
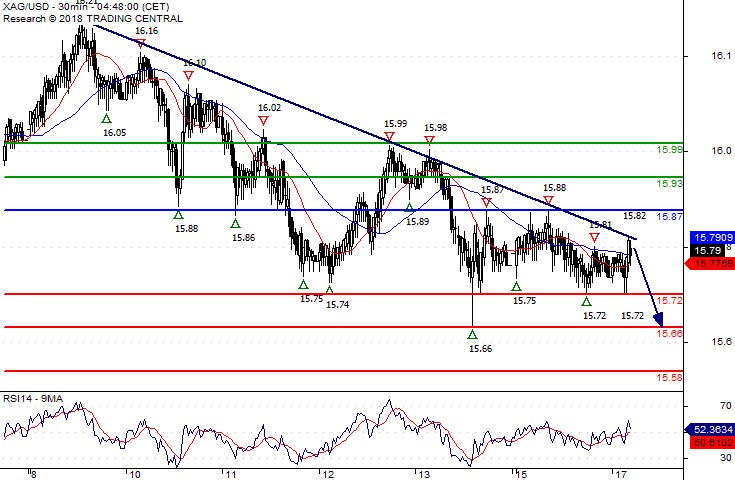
Silver Spot Key Resistance At 15.8700
Pivot (invalidation): 15.8700
Our preference Short positions below 15.8700 with targets at 15.7200 & 15.6600 in extension.
Alternative scenario Above 15.8700 look for further upside with 15.9300 & 15.9900 as targets.
Comment As Long as the resistance at 15.8700 is not surpassed, the risk of the break below 15.7200 remains high.
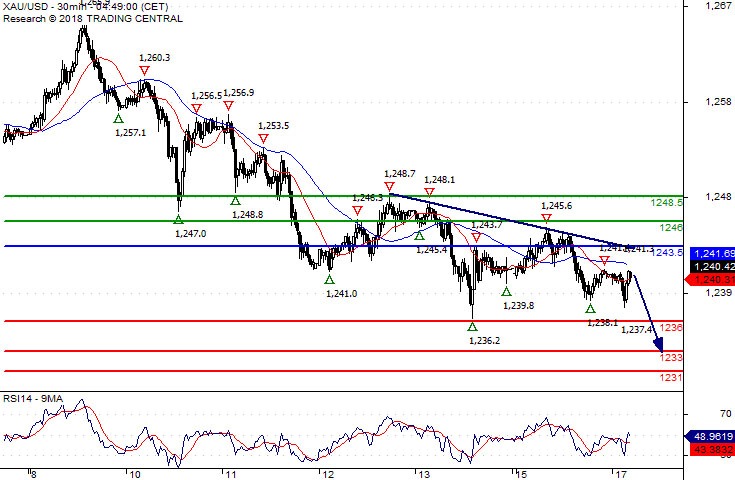
Gold Spot Capped By A Negative Trend Line
Pivot (invalidation): 1243.50
Our preference Short positions below 1243.50 with targets at 1236.00 & 1233.00 in extension.
Alternative scenario Above 1243.50 look for further upside with 1246.00 & 1248.50 as targets.
Comment As Long as 1243.50 is resistance, look for choppy price action with a bearish bias.
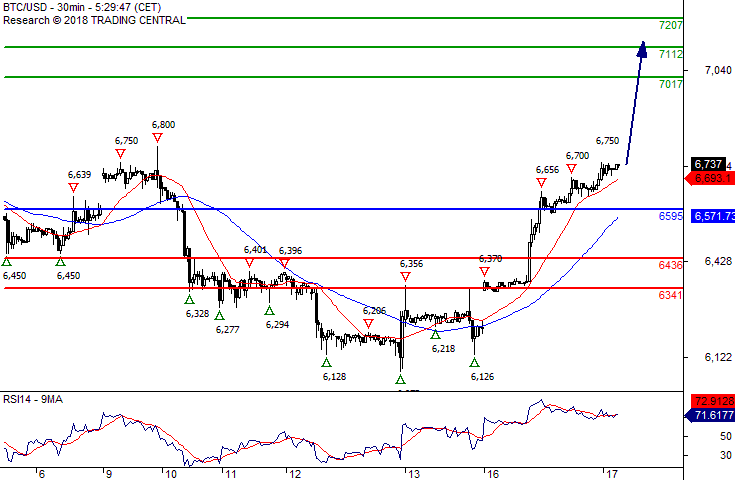
Bitcoin/Dollar As Long As 6595 Is Support Look For 7017
6595 is our pivot (invalidation) point.
Our preference As Long as 6595 is support look for 7017.
Alternative scenario The downside breakout of 6595 would call for 6436 and 6341.
Comment The RSI is above 70. It could mean either that the pair is in a lasting uptrend or just overbought and therefore bound to correct (look for bearish divergence in this case). The MACD is below its signal line and positive. The pair could retrace. Moreover, the pair is trading above both its 20 and 50 MAs (respectively at 6687 and 6563).
Should You Trade With Forex Price Action Or Indicators?
One of the most common questions that traders would at some point ask themselves is to whether to trade with the aid of indicators or to make use of forex price action charts. A quick look at any of the forums will see that a good section is dedicated to this debate. Price action traders often tend to look down upon traders who trade based on indicators, which brings to question as to which of the two a…
Understanding Price Action
In order to better answer this question, we need to first understand what is price action based trading. Price action interestingly is a very vague and broad term and can mean different things to different traders. To encompass all of it, price action is nothing but the study of price using just price and the charts without any additional indicators.
Some of the common methods of trading with price action include chart patterns such as the head and shoulders, double or triple tops and bottoms, flags and pennants and so on. Price action trading can also include other aspects such as trend lines, horizontal support and resistance levels as well as candlestick patterns.
Regardless of the methods that may be employed, the bottom line being that price action trading focuses on price as it evolves rather than rely on indicators.
Understanding the Technical Indicators
There are many technical indicators available today, from the good old trusted moving averages to oscillators and some advanced indicators such as cycle oscillators and so on.
Beginners to forex will almost certainly start off trading with indicators and the proof of this being the fact that most of the forex forums tend to focus a good section on trading systems, which is nothing but various combinations of the same old technical indicators.
When trading with technical indicators it is quite easy to miss the big picture. Technical indicators are plotted based on price. However, it is easy to ignore price as traders often tend to focus on how the indicators are moving instead of having to focus on price and this is where comes the major debate as to which of the two approaches is better.
There is no right way or the wrong way
Ask any trader who has recently switched sides and the most common answer one could get is that they believe the ‘other approach’ looks more promising. Indeed, isn’t grass always greener on the other side?
The important aspect to bear in mind is that whether you trade with price action or with indicators, the trading goal remains the same, which is to make a profit. There is no direct proof that price action trading gives better results or vice versa. It entirely depends on what the trader is comfortable with.
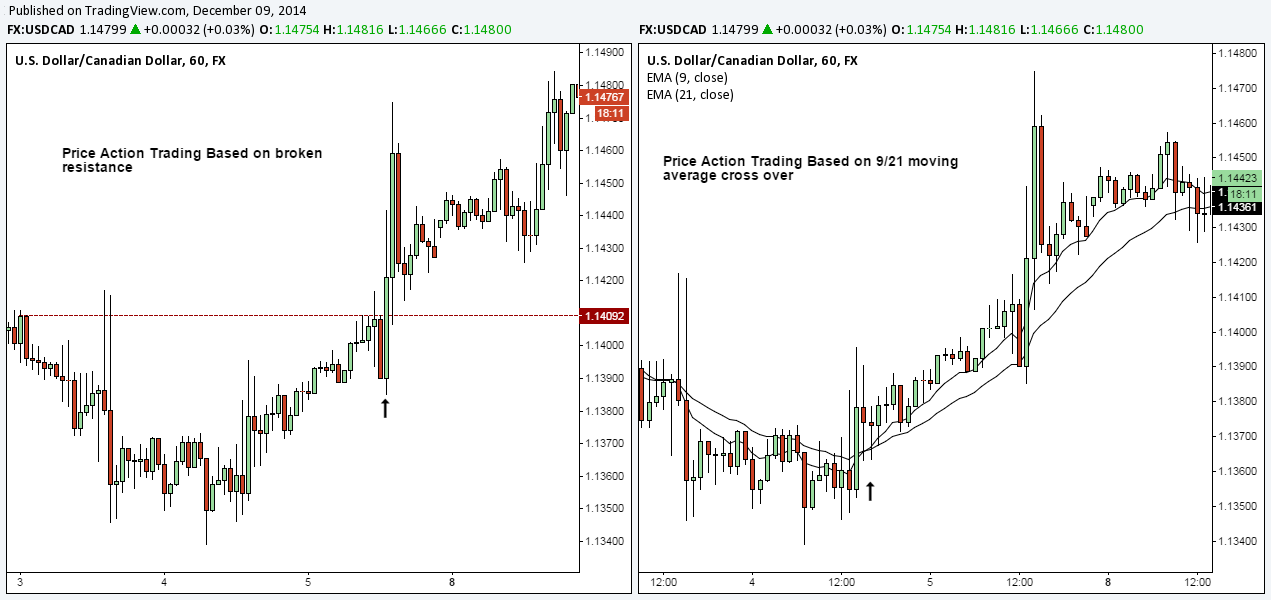
Price action trading requires a bit more experience and knowledge about the various market concepts such as supply/demand, the market sentiment and so on. New traders are often put off by price action trading as initially it might seem a bit too complicated to understand. Whereas trading with technical indicators in comparison is easy. Certainly, how hard can it be to understand the buy and sell signals when two moving averages cross over?
If you are one of those traders contemplating to switch sides, only because you think switching your trading approach might improve your odds, then think again. It doesn’t matter whether you are trading with price action or trading with technical indicators. What does matter is how well you understand your trading method.
XAUUSD Intraday Analysis
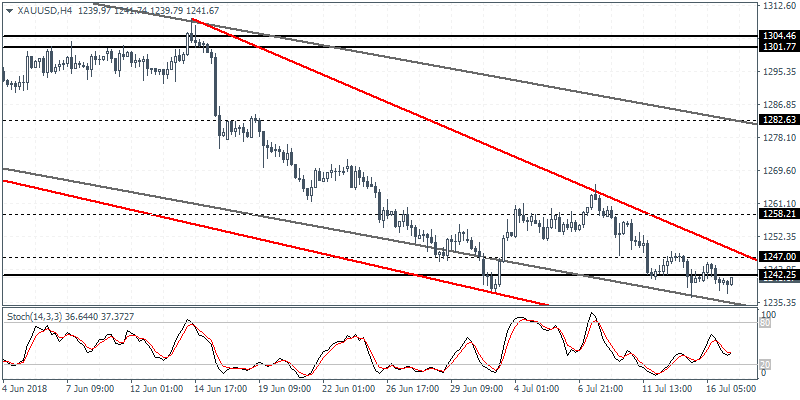
XAUUSD (1241.67): c prices continue to consolidate below 1242.25 level of support. With the currency pair failing to make fresh lows, price action is likely poised for an upside breakout. The price level of 1247 - 1242.25 could potentially offer some short-term resistance. However, a breakout above this region could trigger further gains that could push gold prices to test the 1258.21 level in the next leg to the upside