Sample Category Title
USDJPY Intraday Analysis
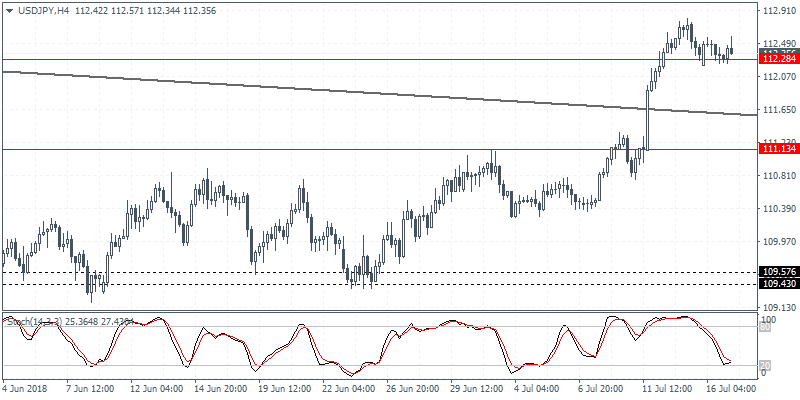
USDJPY (112.35): The USDJPY currency pair was seen testing the price level near 112.28. The 4-hour Stochastics is pointing to a hidden bullish divergence. However, failure to break past the previous highs established at 112.71 could however signal a potential move to the downside. The break down below 112.28 could trigger further declines to 111.13 level.
EURUSD Intraday Analysis
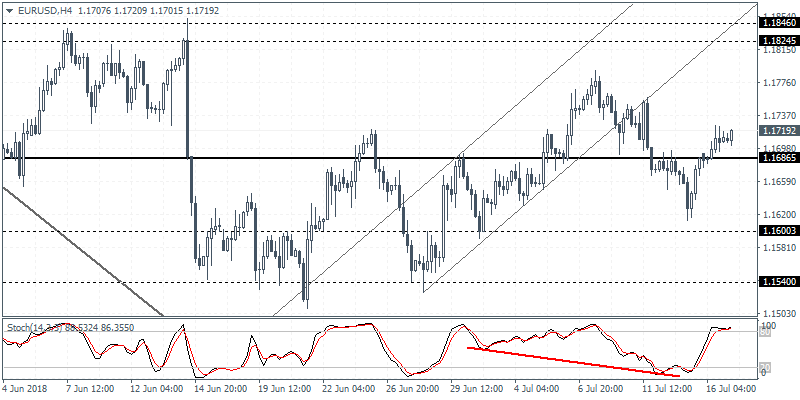
EURUSD (1.1719): The euro was seen extending the gains on Monday against the U.S. dollar. Despite a strong patch of economic releases, the euro managed to rise to intraday highs of 1.1725. Price action has now cleared the support/resistance level of 1.1686. This is expected to keep the bias to the upside. Any dips are likely to stall back near the 1.1686 level. The currency pair is now likely to attempt to rally toward the next main resistance level at 1.1960 - 1.1920 level.
Fed Chair Powell To Testify
The U.S. dollar was seen trading mixed on Monday. Economic data was supportive of the greenback. The U.S. retail sales report showed that headline retail sales increased 0.5% on the month while core retail sales rose 0.4%.
The U.S. Empire State Manufacturing index was seen rising to 22.6 on the index, up from 20.3 which was forecast but lower than 25.0 from the previous report.
In the overnight trading session, the quarterly inflation report from New Zealand showed that consumer prices advanced at a pace of 1.5% annually. On a quarterly basis, consumer prices rose 0.4% missing estimates of a 0.5% increase.
Looking ahead, the BoE Governor Mark Carney is scheduled to speak today. His speech comes ahead of the monthly labor market report. The UK's unemployment rate is expected to remain steady at 4.2% while wage growth is forecast to rise at a steady pace of 2.5%.
The NY trading session will see the Fed Chair Powell's testimony to Congress. Investors will be looking to see if the Fed Chair maintains his hawkish views on the economy. The U.S. industrial production and capacity utilization rate is also expected to be released.
Currencies: Will ‘Softer’ Powell Support A Further USD Correction?
Rates: New warning about stagflation by Fed Powell?
Disappointing Netflix earnings could hurt risk sentiment today. The eco/event calendar focusses on Powell's testimony. Last week, he warned that the worst case outcome of the trade war is stagflation. More comments in that direction could be interpreted dovish and support the US Note future even if he'll stick to the Fed's gradual rate hike approach.
Currencies: Will 'softer' Powell support a further USD correction?
The dollar lost slightly ground yesterday despite decent US retail sales. Focus turns to the Fed Powell's semi-annual testimony today. The dollar might lose some further ground if the Fed president warns on the potential impact of the trade war on the US economy. EUR/GBP is still paralyzed in the 0.88 area as the Brexit-stalemate persists
The Sunrise Headlines
- US equities ended mixed yesterday with the Dow recording small gains (+0.18%) while the Nasdaq underperformed (-0.26%). In Asia, Japan is trading in green (+0.85%). China is losing ground (-1.08%).
- FAANG club member Netflix plummeted 14% post-market after its Q2 reporting. Subscriber growth disappointed as did its outlook for the current period. The drop suggests a lower opening for the technology stocks/Nasdaq.
- Oil prices fell by more than 4% yesterday as markets focus on supply. Libyan oil terminals are reopening and the US said it could draw upon its strategic reserves. The latter are also considering country requests to import Iranian crude, despite America's total boycott demand, easing (Iranian) supply fears.
- According to the IMF, escalating trade tensions are a threat to a global growth that is already losing momentum. While it did not change its global growth forecasts, it warned global output could drop by 0.5% by 2020 if trade barriers would become reality.
- The UK government on Monday accepted the Brexiteer amendments to May's initial Brexit proposal, toughening the country's negotiating stance with Brussels.
- Russian President Putin said talks with his American counterpart were a success after he seemingly convinced Trump “the Russian state has never interfered and is not going to interfere in US internal affairs”.
- Today's economic calendar provides US industrial production and UK labour data. J&J (12:45) and Goldman Sachs (13:30) publish Q2 results. Fed's Powell testifies before the Senate. BoE's Carney, Cunliffe and Stheeman speak. Germany taps the bond market
Currencies: Will 'Softer' Powell Support A Further USD Correction?
Softer' Powell to cause further USD correction?
Yesterday, the dollar traded with a tentative negative bias but moves were limited. US retails sales were strong and suggest solid Q2 growth but had no lasting impact on the dollar. A sharp new down-leg of oil also didn't help the US dollar. EUR/USD closed at 1.1711 (from 1.1685). USD/JPY finished at 112.29 (from 112.38). There was also a lot of turmoil on president Trump's diplomacy in Russia, but it had no noticeable impact on (FX) markets. Overnight, Asian equities are mostly in negative territory. Lingering trade tensions, a sharp decline of oil and a setback in the Nasdaq future (disappointing Netflix results) are weighing. Still, the the major USD cross rates are holding tight ranges with EUR/USD near 1.1720 and USD/JPY near 112.40. New Zealand headline inflation was slightly softer than expected, but the kiwi dollar profited from a rise in a core measure closely monitored by the RBNZ. NZD/USD rebounded to the 0.6840 area. A tentative sign of a bottoming out process for the kiwi? Today, the eco calendar is thin with only US production data. Production is expected fairly strong at 0.5% M/M. However, the focus for FX trading will be on the semiannual testimony of Fed Powell before the Senate. At the June meeting, the Fed was positive on the economy and the dots signalled a rising chance of 2 additional rate hikes this year. The Fed president probably won't backtrack on his positive view, but there is also no reason to reinforce the scenario of two additional hikes in a context of rising trade tensions. If so, the dollar won't get much additional interest rate support. EUR/USD is holding the 1.15/1.1850 trading range. As the downside looks blocked, there maybe is room for EUR/USD to go back higher in the range.
Yesterday, UK PM May again faced a turbulent session in Parliament. The row between pro-Brexit support and support of a soft Brexit hardened as the government accepted amendments from the pro-Brexit camp to the Customs bill. The Brexit noise propelled EUR/GBP back higher to the 0.8850 area. Today, the UK labour data will be published. The focus remains on wage growth. A decent report might be enough for the BoE to raise rates in August. However, wage growth probably has to bring a big upside surprise to trigger any sustained GBP gains. The Brexit sage continues in Parliament (Trade Bill). As the Brexit chaos won't disappear soon, we see little reason for a sterling comeback. More consolidation in the EUR/GBP 0.88 are might be on the cards.
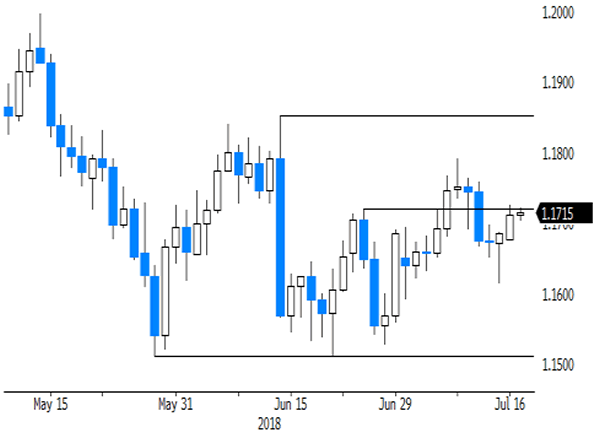
EUR/USD: holding in the middle of established range. Will 'soft' Powell assessment weaken the dollar?
GBP/USD Bullish Breakout Challenges Downtrend Channel
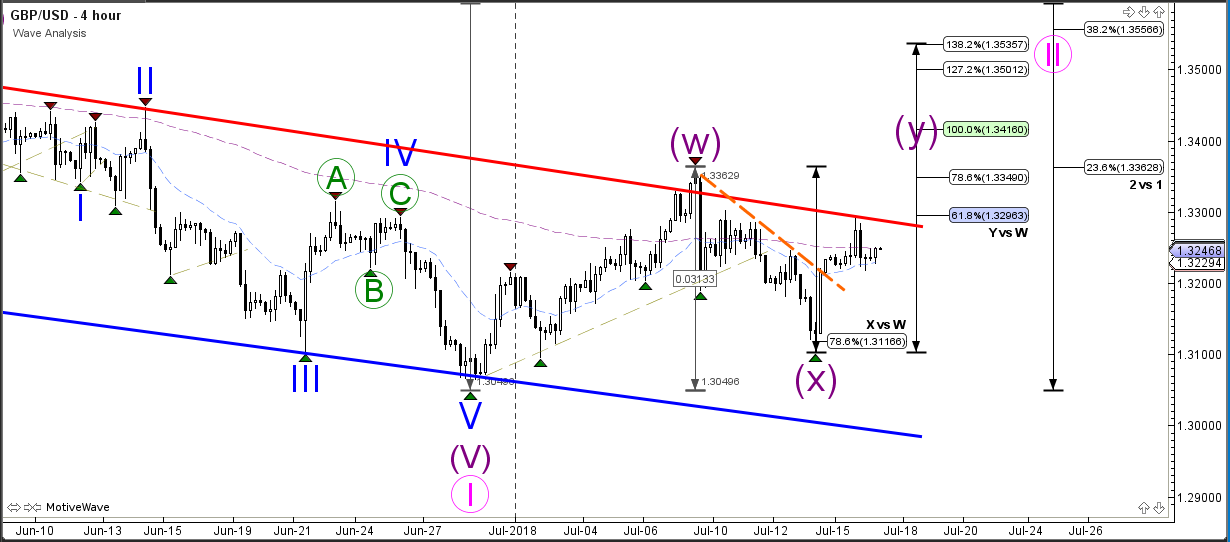
The GBP/USD broke above the resistance trend line (dotted orange) and is now testing the resistance line (red) of the downtrend channel. A bullish break of the downtrend channel could confirm a larger WXY (purple) bullish correction within wave 2 (pink). Price could move up to test the 38.2% Fibonacci retracement level of that wave 2 at 1.3550.
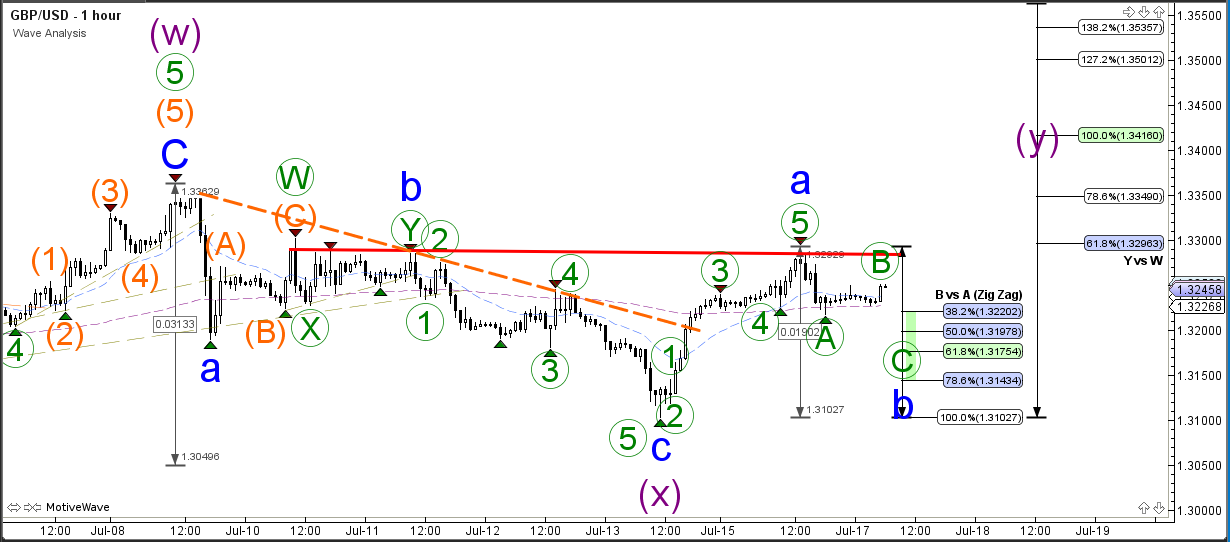
The GBP/USD could be building an ABC pattern (green) within wave B (blue) but there is also a chance that price has already completed wave B (blue) at the 38.2% Fibonacci level of wave B vs A. A break above the resistance trend line (red) could indicate an immediate bullish breakout within wave Y (purple).
EURUSD Bullish ABC Zigzag Pattern Aims At 1.1840
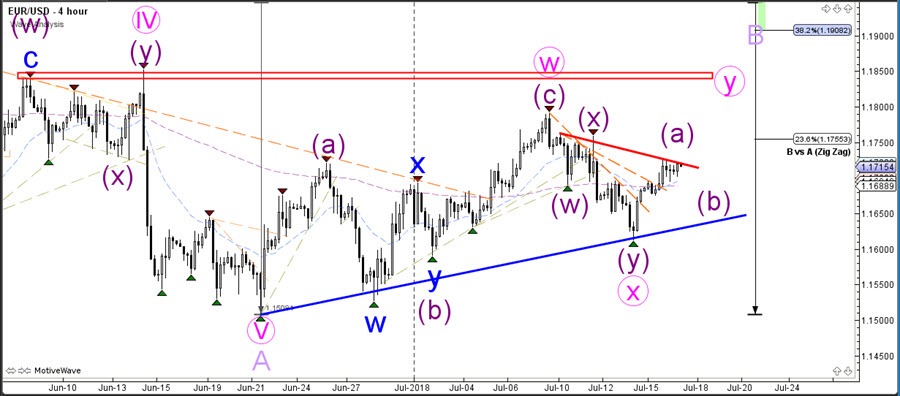
The EUR/USD made several bullish breakouts after the expected bullish reversal at support but price is now challenging a new key resistance trend line. The bulls are in control and a bullish continuation seems likely.
The EUR/USD is either still in a bullish wave A (purple) or will make a bearish retracement as part of a wave B (purple). This is the expected wave pattern if price indeed completes an ABC zigzag pattern (purple).
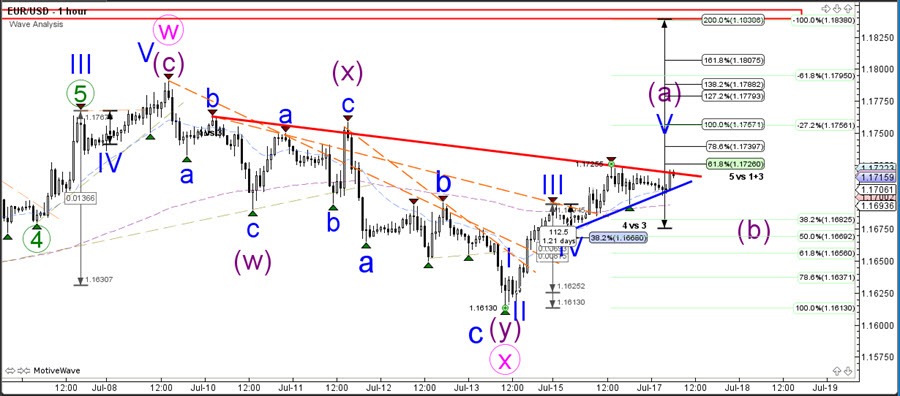
The EUR/USD bullish breakout above the resistance line (red) could confirm one more push up within wave 5 (blue) of wave A (purple). Eventually a wave B (purple) retracement is expected.
Global Shares Come Under Pressure As Oil Tumbles
Asian equities fell on Tuesday after Oil prices tumbled by more than 4.6% during the previous session, following reports that Saudi Arabia has offered additional crude supplies to some of its Asian customers and that the U.S. may release some of its strategic petroleum reserves to bring prices down.
Another factor that contributed to the fall in prices were the comments from Treasury Secretary Steven Mnuchin, who said some crude importers might receive waivers to continue buying Iranian Oil in an attempt to avoid roiling global markets. While such waivers would release some pressure off Iran, it would also cheer U.S. motorists by bringing their bills down during the summer season. After all, President Trump doesn’t want any more headaches ahead of November’s mid-term elections; so far, it seems his strategy is working.
While the fall in Oil prices dragged the U.S. energy sector down, the Dow Jones Industrial Average still managed to inch 0.2% higher supportedpetroleum reserves to bring prices down. by the financials that ended the day 3% higher. Investors appear to have shrugged off the meeting between presidents Trump and Putin, as well as warnings from the IMF that rising trade tensions could cost the global economy $430 billion.
Financial markets seem to be focusing on earnings, which have so far managed to demonstrate a strong performance as has economic data, with U.S. retail sales rising 0.5% in June. This indicates that consumers remain in good health and are supporting further economic growth. Unless trade war announcements break out again, I think fundamentals will remain strong enough to support further gains in U.S. equities.
Later today, attention will be on Federal Reserve Chair Jerome Powell as he testifies before Congress. It will be interesting to hear his views on the flat yield curve and whether he shares Neel Kashkari’s opinion that the U.S. economy may fall into a recession if short-term yields rise above the long-dated ones, indicating that the Fed needs to slow down the pace of tightening policy. However, trade tensions and fiscal policy are the two critical topics where Democrats will likely attack the Fed Chair and clarify whether the Federal Reserve has the necessary tools to avoid any disruption.
In the U.K., the focus will be shifting from politics to economic data, with the latest releases of employment and wages figures due today. Unemployment is expected to remain steady at 4.2%, while wages are expected to slip by 0.1% to 2.7%. A surprise to the upside may increase the odds of an interest rate hike in August and thus provide Sterling with some support.
GBPUSD Turns To Sideways Channel In Bollinger Band, Neutral Bias In Short Term
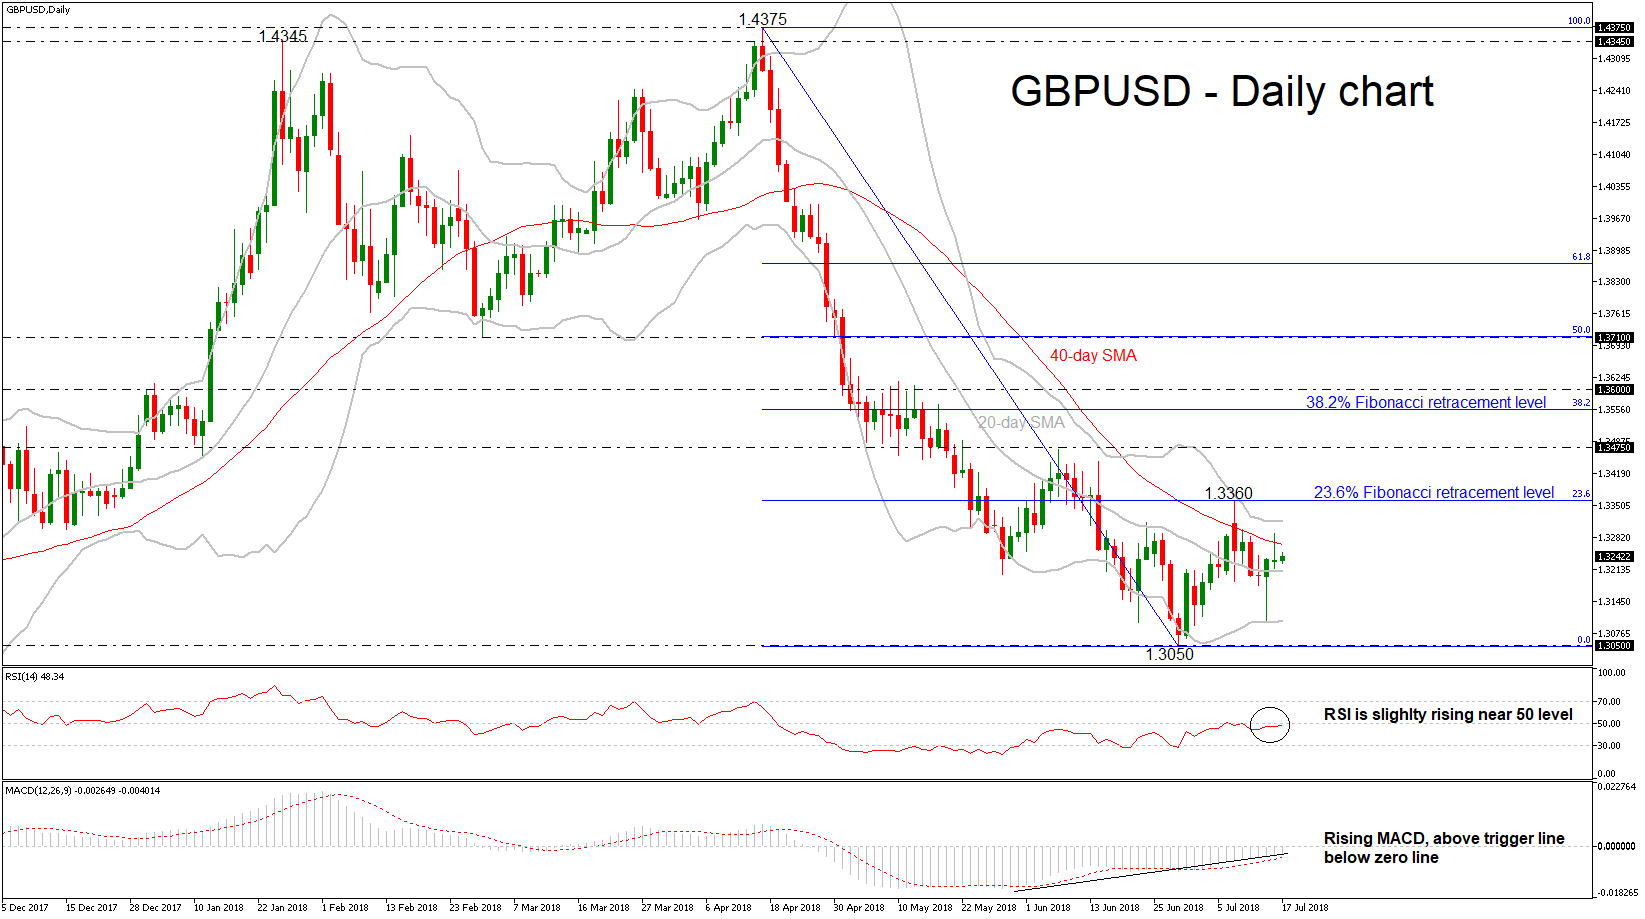
GBPUSD has been trading in a neutral mode over the last couple of days after the rebound on the lower Bollinger Band near 1.3100 on July 13. The price seems to be losing its strong negative momentum as the Bollinger Band is narrowing and suggests that the next movement will be sideways. It is worth mentioning that the cable is still developing below the 23.6% Fibonacci retracement of the downleg from 1.4375 to 1.3050, around 1.3360.
In the daily timeframe, the technical indicators are recommending a slight upside bias. The RSI indicator is rising with weak momentum near the threshold of 50, while the MACD oscillator is still moving above its trigger line but remains in the negative territory. Still, downside risks have not faded out yet as both indicators continue to fluctuate in bearish zones.
Should the price climb above the 40-day simple moving average (SMA) of 1.3267 and the upper Bollinger Band of 1.3318 at the time of writing, investors would turn their eyes towards the 23.6% Fibonacci of 1.3360. In case of further gains, bulls could push the pair until the 1.3475 resistance level, taken from the high on June 7. Clearing this level, the price could top the 38.2% Fibonacci mark of 1.3556.
Conversely, a decline could find support at the mid-level of the Bollinger Band (20-day SMA), where if the bearish moves appear stronger, the price could hit the lower Band near the 1.3100 psychological level. A failure to hold above this level would open the way for the 1.3050 support where the price bottomed during June. If there is a drop below this region the next level to have in mind is the 1.2770 support, identified by August 2018.
In the medium term, the neutral to bearish outlook remains intact, with the Bollinger Band appearing to follow a sideways movement and the price holding within the 20- and 40-day SMAs. Having a look at the weekly timeframe, the 20-SMA is ready for a bearish crossover with the 40-SMA.
GBP/JPY Daily Outlook
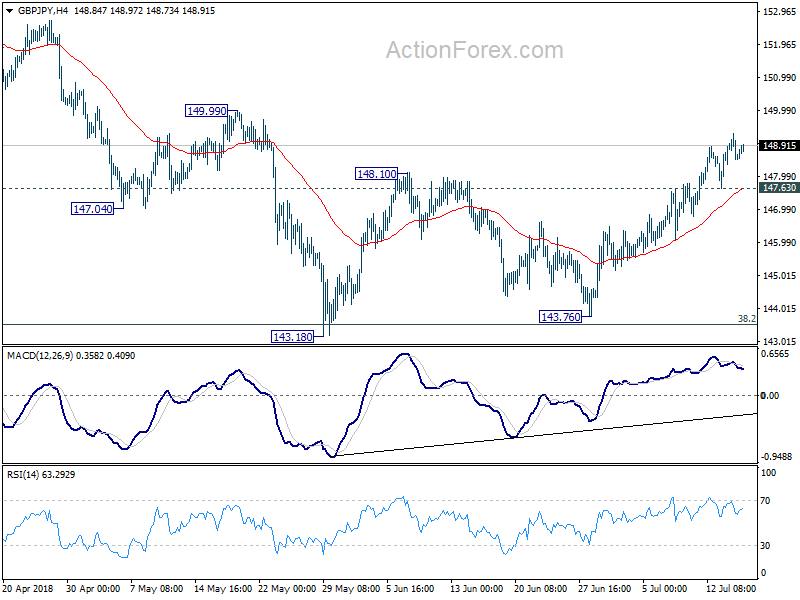
Daily Pivots: (S1) 148.29; (P) 148.81; (R1) 149.12; More...
Intraday bias in GBP/JPY remains on the upside for 149.99 resistance. Break there will add more credence to the larger bullish case and target 153.84 resistance next. On the downside, though break of 147063 minor support will argue that the rebound from 143.76 might be finished and turn bias back to the downside
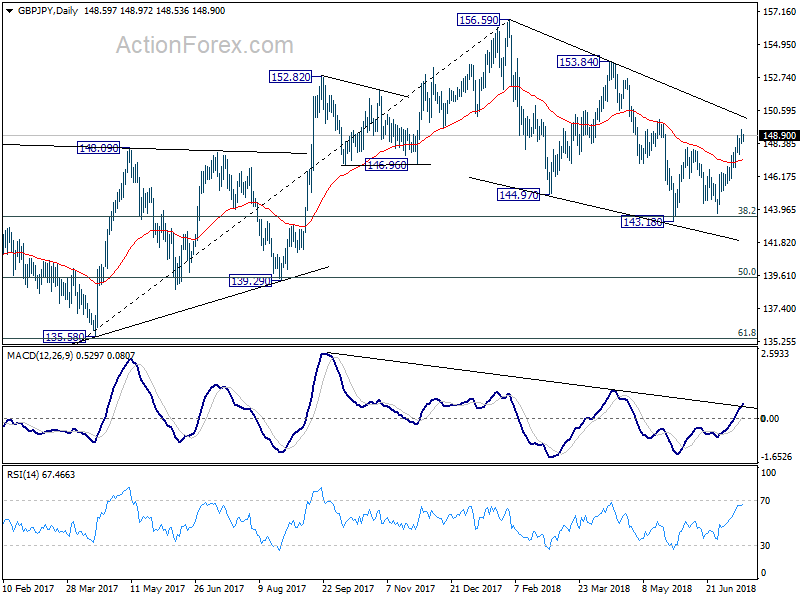
In the bigger picture, no change in the view that decline from 156.59 is a corrective move. In case of another fall, strong support should be seen above 139.29 cluster support (50% retracement of 122.36 to 156.59 at 139.47) to contain downside and bring rebound. Meanwhile, break of 153.84 should confirm that the correction is completed and target 156.59 and above to resume the medium term up trend.
EUR/JPY Daily Outlook
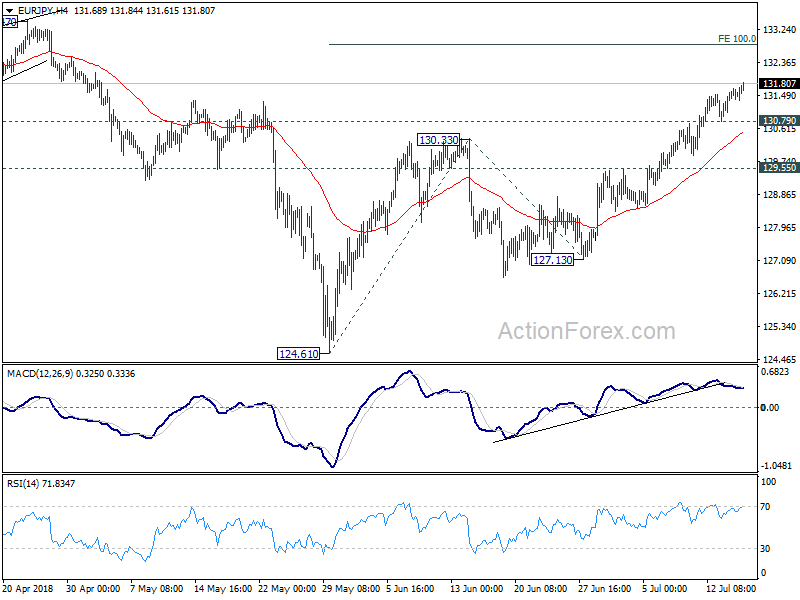
Daily Pivots: (S1) 131.18; (P) 131.45; (R1) 131.74; More....
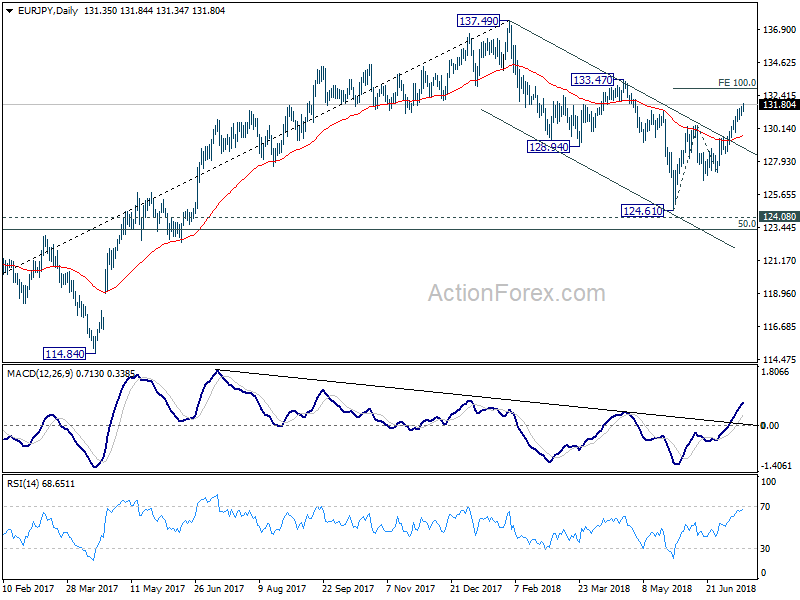
EUR/JPY's rally is still in progress and intraday bias remains on the upside. Current rally from 124.61 should target 100% projection of 124.61 to 130.33 from 127.13 at 132.85 next. On the downside, below 130.79 minor support will turn bias to the downside and bring retreat. But downside should be contained by 129.55 resistance turned support to bring another rally.
In the bigger picture, the strong break of channel resistance from 137.49 suggests that the decline from there as completed. The three wave structure suggests that it's a correction. With 124.08 key resistance turned support intact, medium term bullishness is also retained. Break of 133.47 will affirm this bullish case and target 137.49 and above. This will now be the favored case as long as 127.13 support holds.