Sample Category Title
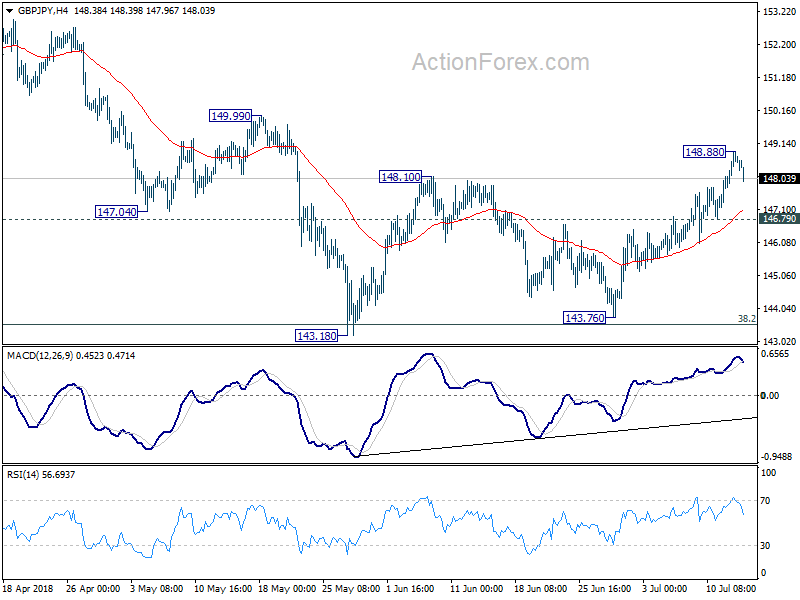
AUD/USD Further Advance
Pivot (invalidation): 0.7390
Our preference Long positions above 0.7390 with targets at 0.7430 & 0.7445 in extension.
Alternative scenario Below 0.7390 look for further downside with 0.7375 & 0.7360 as targets.
Comment The RSI is mixed to bullish.
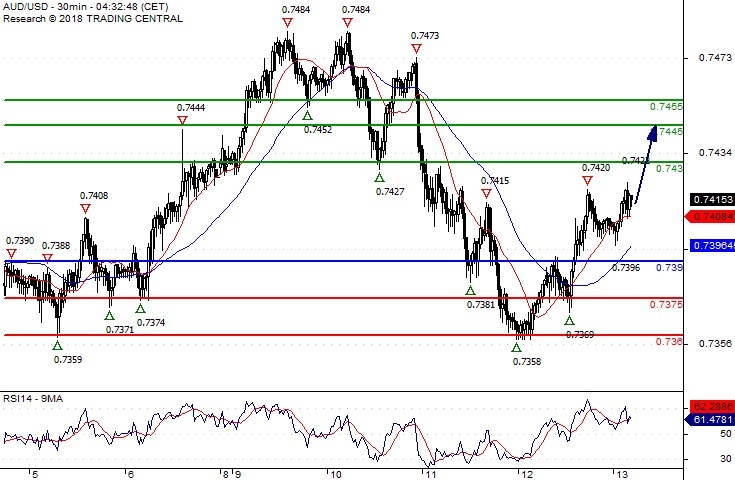
USD/CAD Under Pressure
Pivot (invalidation): 1.3190
Our preference Short positions below 1.3190 with targets at 1.3135 & 1.3115 in extension.
Alternative scenario Above 1.3190 look for further upside with 1.3220 & 1.3240 as targets.
Comment The RSI is capped by a declining trend line.
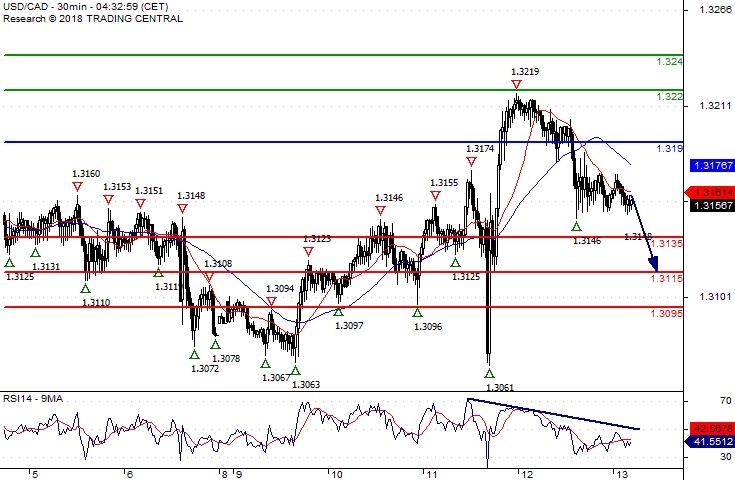
USD/CHF The Bias Remains Bullish
Pivot (invalidation): 1.0000
Our preference Long positions above 1.0000 with targets at 1.0030 & 1.0060 in extension.
Alternative scenario Below 1.0000 look for further downside with 0.9970 & 0.9940 as targets.
Comment The RSI is mixed with a bullish bias.
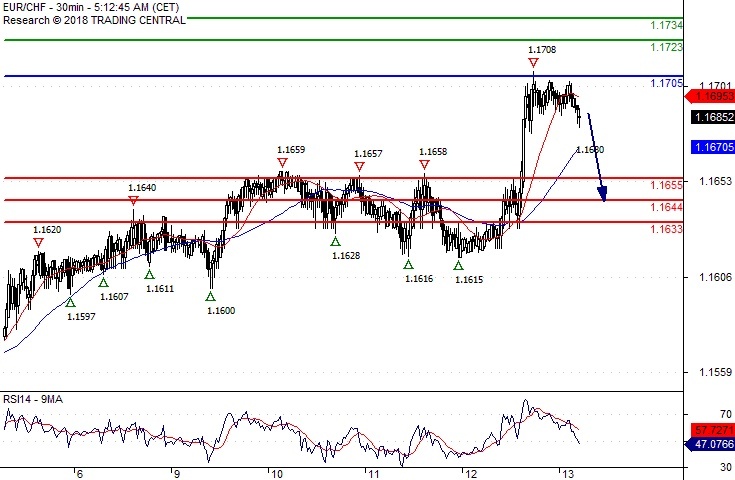
EUR/CHF Below Its Lower Bollinger Band
1.1705 is our pivot (invalidation) point.
Our preference target 1.1655.
Alternative scenario Above 1.1705, look for 1.1723 and 1.1734.
Comment The RSI is below 50. The MACD is positive and below its signal line. The MACD must penetrate its zero line to expect further downside. Moreover, the pair is trading under its 20 MA (1.1696) but above its 50 MA (1.1671). Finally, the EUR/CHF is trading below its lower Bollinger band (standing at 1.1688).
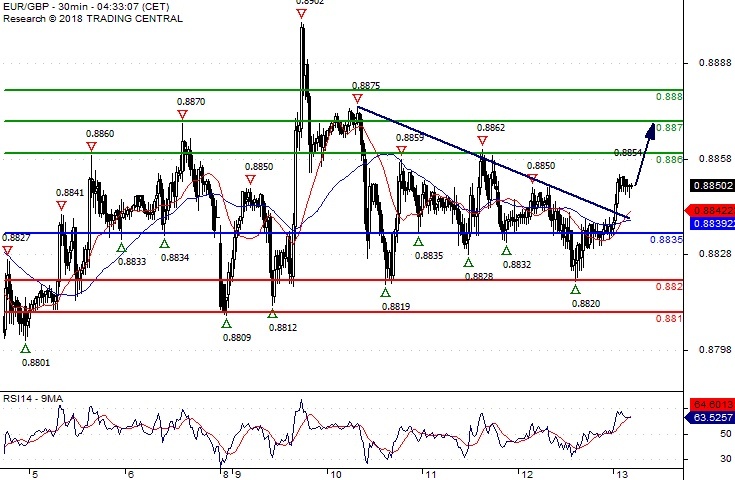
EUR/GBP Further Advance
Pivot (invalidation): 0.8835
Our preference Long positions above 0.8835 with targets at 0.8860 & 0.8870 in extension.
Alternative scenario Below 0.8835 look for further downside with 0.8820 & 0.8810 as targets.
Comment The RSI shows upside momentum.
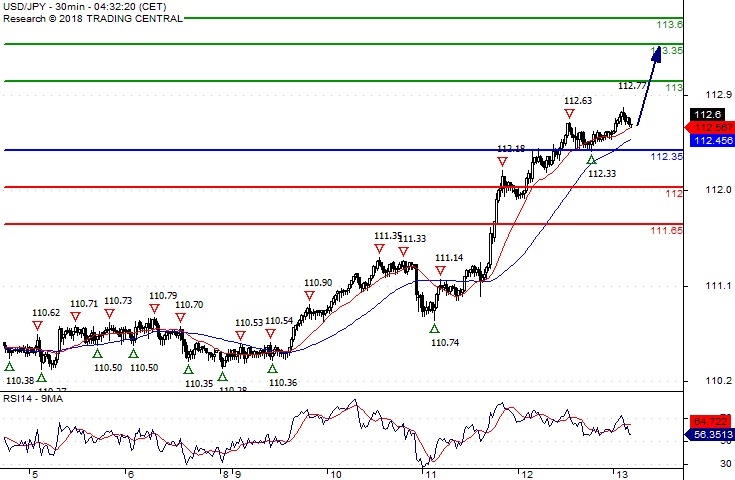
USD/JPY Bullish Bias Above 112.35
Pivot (invalidation): 112.35
Our preference Long positions above 112.35 with targets at 113.00 & 113.35 in extension.
Alternative scenario Below 112.35 look for further downside with 112.00 & 111.65 as targets.
Comment The RSI advocates for further advance.
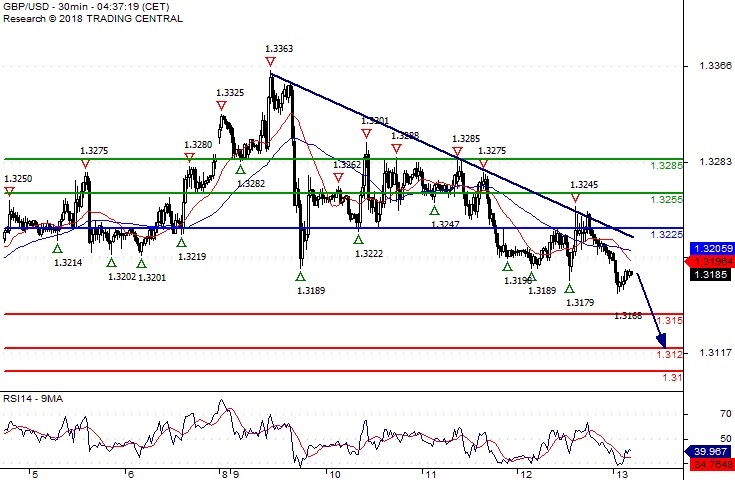
GBP/USD The Downside Prevails
Pivot (invalidation): 1.3225
Our preference Short positions below 1.3225 with targets at 1.3150 & 1.3120 in extension.
Alternative scenario Above 1.3225 look for further upside with 1.3255 & 1.3285 as targets.
Comment The RSI is mixed to bearish.
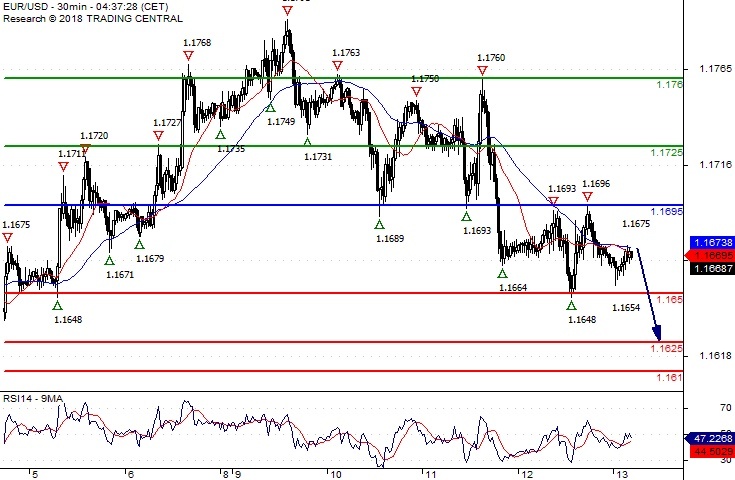
EUR/USD Key Resistance At 1.1695
Pivot (invalidation): 1.1695
Our preference Short positions below 1.1695 with targets at 1.1650 & 1.1625 in extension.
Alternative scenario Above 1.1695 look for further upside with 1.1725 & 1.1760 as targets.
Comment The RSI is mixed to bearish.
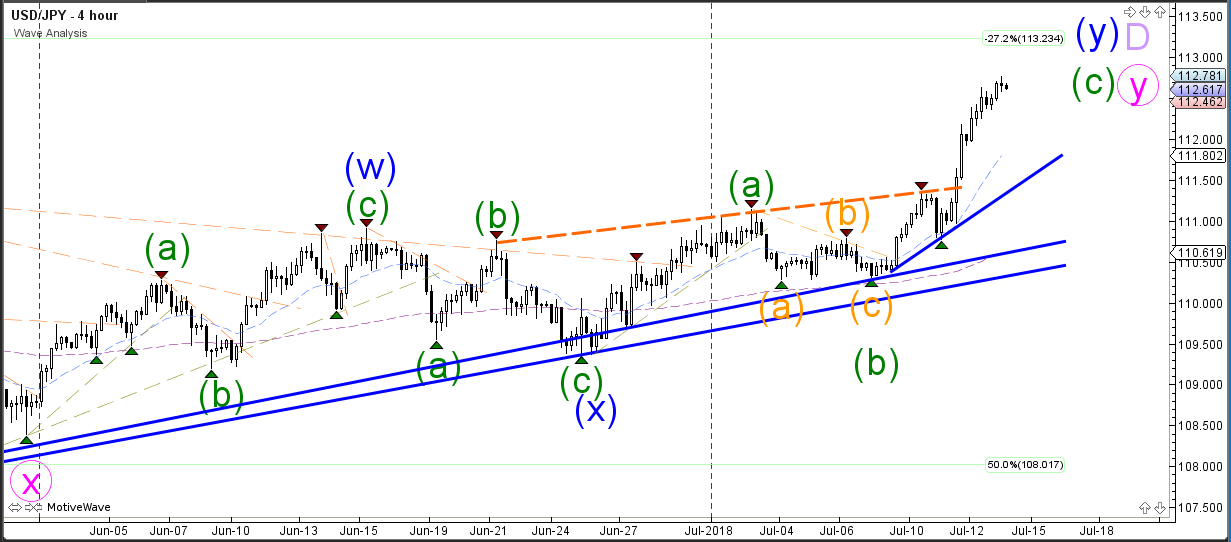
USD/JPY Bullish Wave 3 Momentum Aims At 113.25 Target
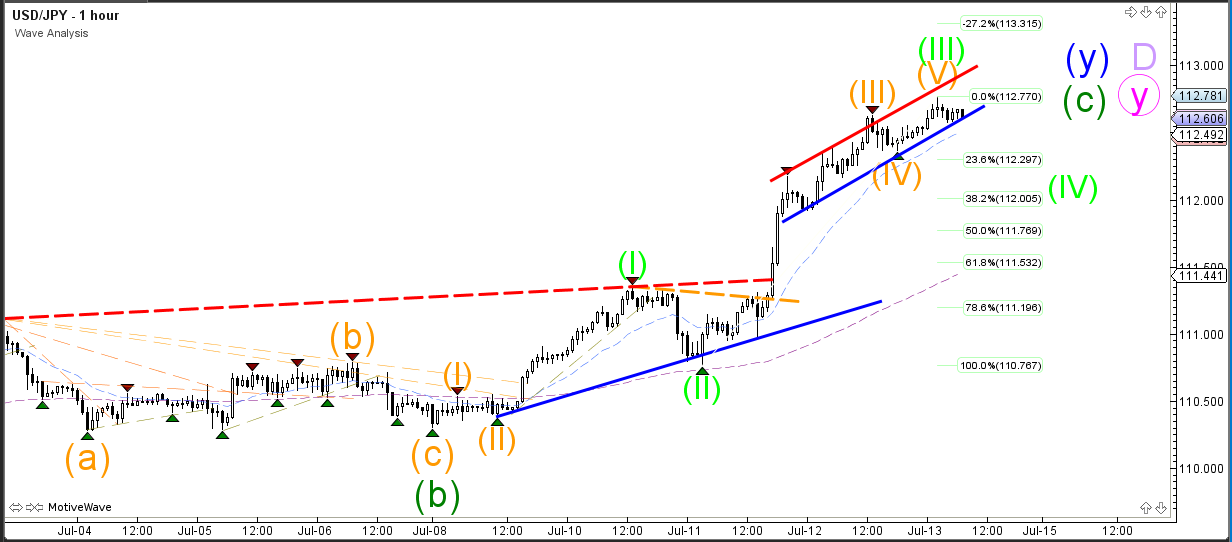
The USD/JPY bullish momentum is continuing higher and seems to be on its way towards the -27.2% Fibonacci target. The bullish swing could complete a wave C of a larger WXY correction in wave D (purple), which is a potential triangle chart pattern from the daily chart.
The USD/JPY is in a bullish channel. A bearish break below the support (blue) of that channel could confirm the end of wave 3 (green) and the start of wave 4 (green). The retracement could back to the Fibonacci levels, which have the potential to offer support and send price up to the Fibonacci target around 113.25.
GBP/JPY Daily Outlook
Daily Pivots: (S1) 147.06; (P) 147.60; (R1) 148.40; More...
GBP/JPY retreats notably after hitting 148.88. But with 146.79 minor support intact, further rise is expected for 149.99 resistance. Break of 149.99 will affirm the bullish reversal case and target 153.84 resistance next. However, break of 146.79 will turn focus back to 143.18/76 support zone instead.
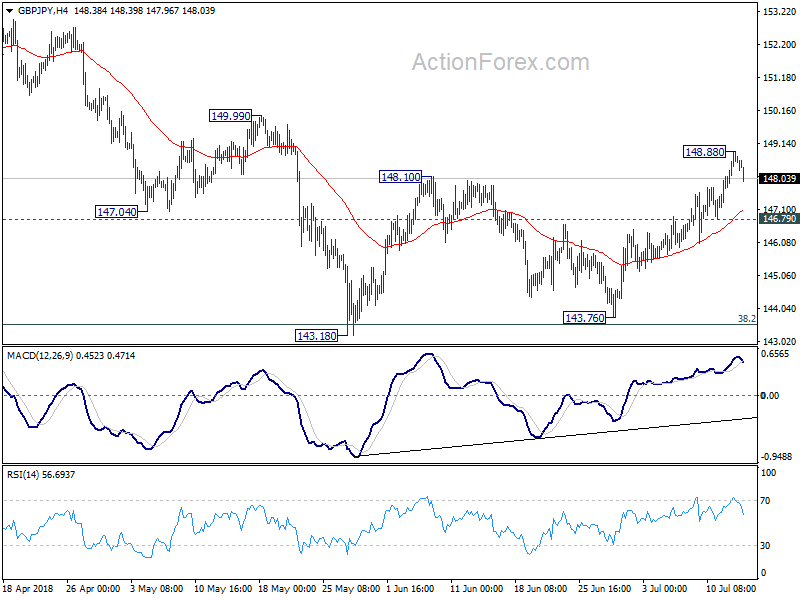
In the bigger picture, no change in the view that decline from 156.59 is a corrective move. In case of another fall, strong support should be seen above 139.29 cluster support (50% retracement of 122.36 to 156.59 at 139.47) to contain downside and bring rebound. Meanwhile, break of 153.84 should confirm that the correction is completed and target 156.59 and above to resume the medium term up trend.