Sample Category Title
EUR/JPY Daily Outlook
Daily Pivots: (S1) 129.85; (P) 130.05; (R1) 130.45; More....
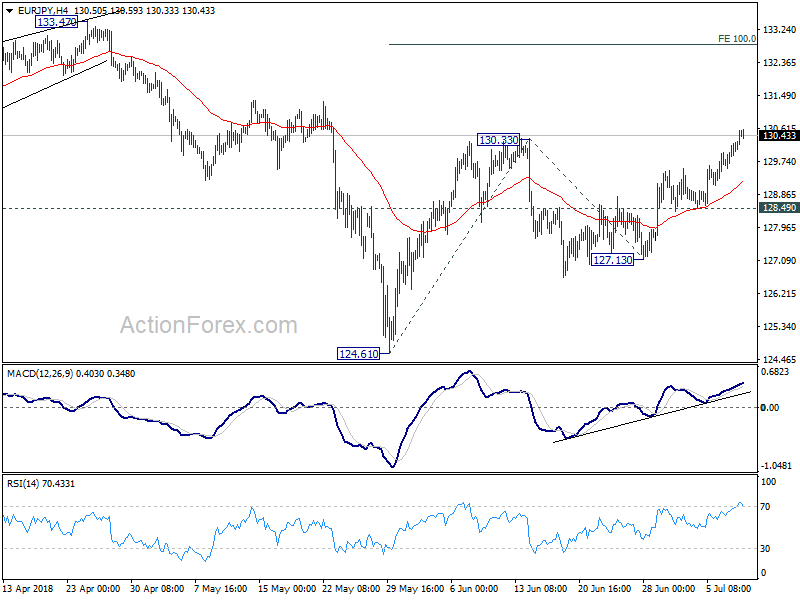
EUR/JPY rises to as high as 103.59 so far today. The break of 130.33 resistance and sustained trading above near term falling channel indicate trend reversal. Further rise should be seen to 100% projection of 124.61 to 130.33 from 127.13 at 132.85 next. On the downside break of 128.49 support in now needed to indicate completion of rise from 127.13. Otherwise, outlook will remain cautiously bullish in case of retreat.
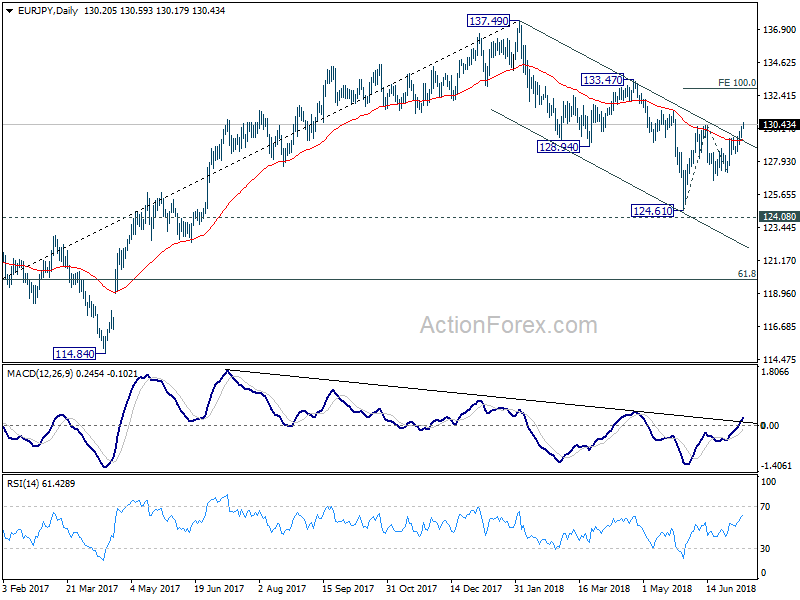
In the bigger picture, for now, EUR/JPY is holding above 124.08 key resistance turned support. Fall from 137.49 could be proven to be a correction. Decisive break of 133.47 resistance will confirm its completion and should extend the rise from 109.03 (2016 low) through 137.49 high. However, firm break of 124.08 will confirm trend reversal. That is, whole rise from 109.03 (2016 low) has completed at 137.49 already. In that case, deeper fall should be seen back to 61.8% retracement of 109.03 to 137.49 at 119.90 and below.
Aussie Trading On A Stronger Footing This Morning
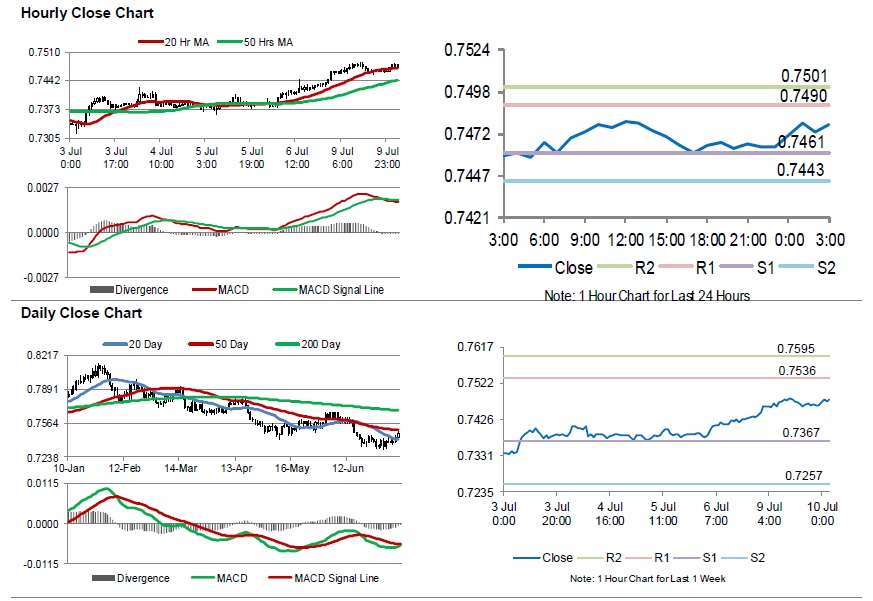
For the 24 hours to 23:00 GMT, the AUD rose slightly against the USD and closed at 0.7464.
LME Copper prices rose 0.9% or $57.0/MT to $6383.0/MT. Aluminium prices rose 1.8% or $37.0/MT to $2135.5/MT.
In the Asian session, at GMT0300, the pair is trading at 0.7478, with the AUD trading 0.19% higher against the USD from yesterday’s close.
Overnight data indicated that Australia’s NAB business confidence index recorded an unchanged reading of 6.0 in June. Additionally, the nation’s NAB business conditions index registered a steady reading of 15.0 in June.
Elsewhere in China, Australia’s largest trading partner, the consumer price index jumped 1.9% on a yearly basis in June, meeting market expectations. The index had increased 1.8% in the prior month. Moreover, the nation’s producer price index climbed of 4.7% on an annual basis in June, more than market expectations for an advance of 4.5%. In the prior month, the index rose 4.1%.
The pair is expected to find support at 0.7461, and a fall through could take it to the next support level of 0.7443. The pair is expected to find its first resistance at 0.7490, and a rise through could take it to the next resistance level of 0.7501.
Going forward, investors sentiment will be determined by Australia’s Westpac consumer confidence index for July, set to release overnight.
The currency pair is showing convergence with its 20 Hr moving average and trading above its 50 Hr moving average.
Gold: Yellow Metal Reverses Its Losses In The Asian Session
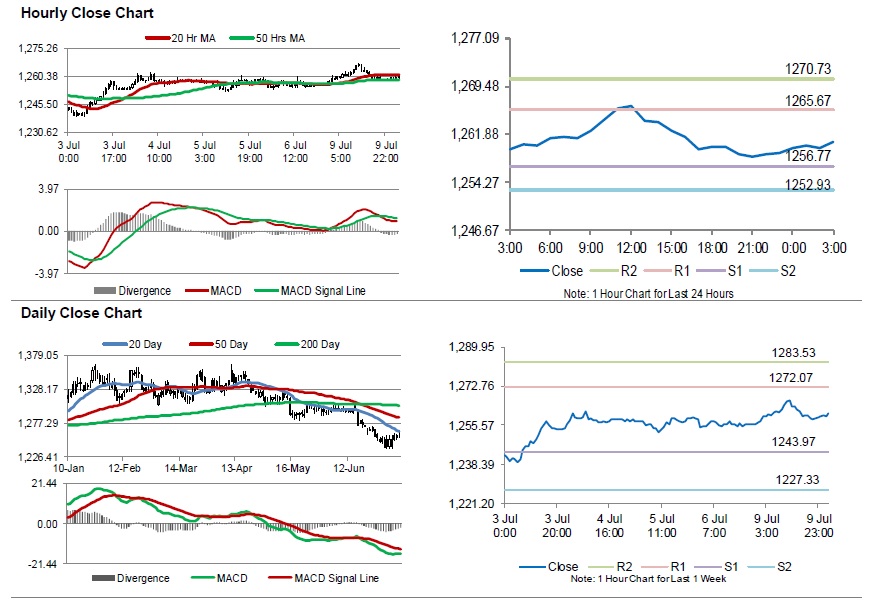
For the 24 hours to 23:00 GMT, Gold declined 0.08% against the USD and closed at USD1258.60 per ounce.
In the Asian session, at GMT0300, the pair is trading at 1260.60, with gold trading 0.16% higher against the USD from yesterday’s close, amid Brexit uncertainty and weaker dollar.
The pair is expected to find support at 1256.77, and a fall through could take it to the next support level of 1252.93. The pair is expected to find its first resistance at 1265.67, and a rise through could take it to the next resistance level of 1270.73.
The yellow metal is showing convergence with its 20 Hr and 50 Hr moving averages.
Silver: White Metal Trading On A Stronger Footing This Morning
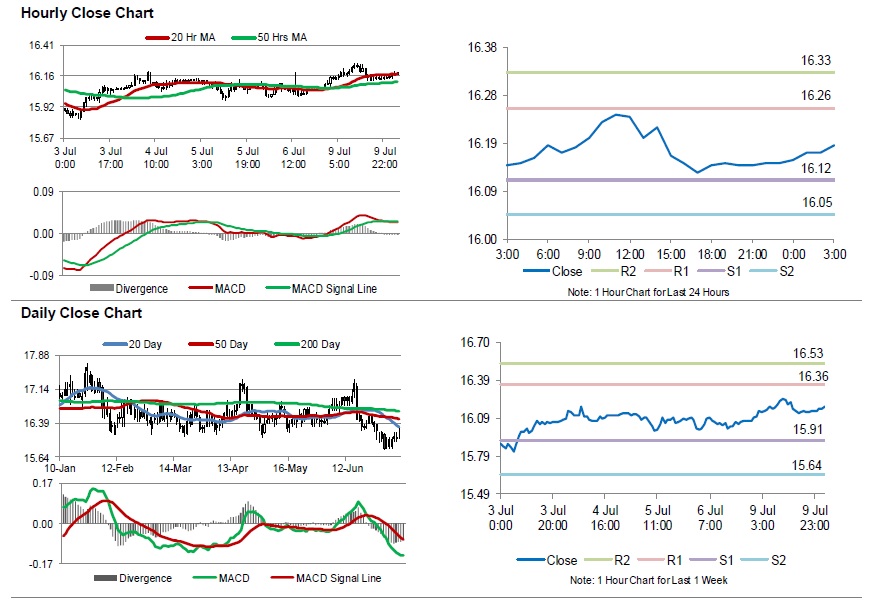
For the 24 hours to 23:00 GMT, Silver traded flat against the USD and closed at USD16.15 per ounce.
In the Asian session, at GMT0300, the pair is trading at 16.18, with silver trading 0.22% higher against the USD from yesterday’s close.
The pair is expected to find support at 16.12, and a fall through could take it to the next support level of 16.05. The pair is expected to find its first resistance at 16.26, and a rise through could take it to the next resistance level of 16.33.
The white metal is showing convergence with its 20 Hr moving average and trading above its 50 Hr moving average.
Crude Oil: Oil Trading Higher, Ahead Of API’s Weekly Crude Oil Stockpiles Data
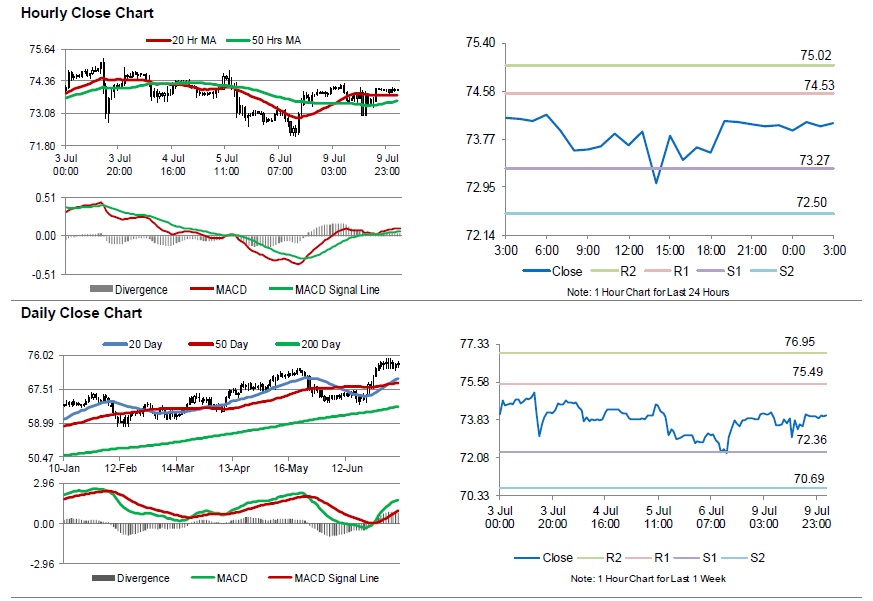
For the 24 hours to 23:00 GMT, Crude Oil declined 0.13% against the USD and closed at USD74.00 per barrel.
In the Asian session, at GMT0300, the pair is trading at 74.04, with oil trading 0.05% higher against the USD from yesterday's close, amid worries over potential supply shortages.
The pair is expected to find support at 73.27, and a fall through could take it to the next support level of 72.50. The pair is expected to find its first resistance at 74.53, and a rise through could take it to the next resistance level of 75.02.
Crude oil is trading above its 20 Hr and 50 Hr moving averages.
GBP/JPY Daily Outlook
Daily Pivots: (S1) 146.23; (P) 146.93; (R1) 147.64; More...
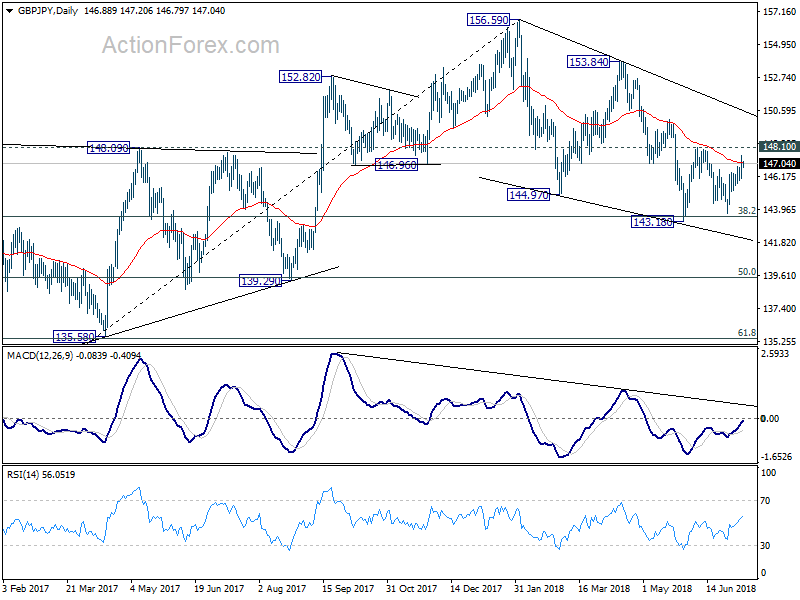
GBP/JPY retreated sharply ahead of 148.10 resistance. But downside is contained well above 145.17 minor support. Intraday bias remains neutral first. On the downside, break of 145.17 will confirm completion of rebound from 143.76. Intraday bias will be turned back to the downside for retesting 143.17 low. Break will resume the fall from 156.59. Meanwhile, break of 1481.0 will be a strong signal of near term reversal. Further rally would be seen to 149.99 resistance for confirmation.
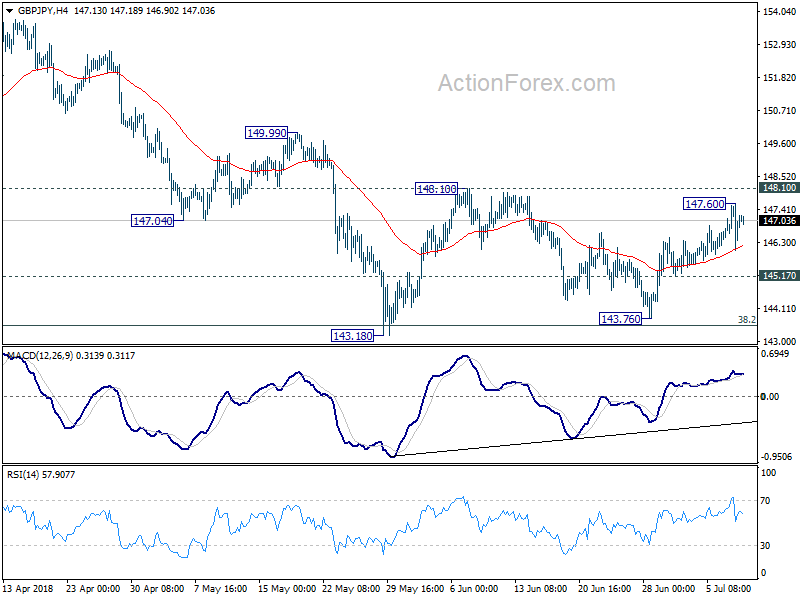
In the bigger picture, no change in the view that decline from 156.59 is a corrective move. In case of another fall, strong support should be seen above 139.29 cluster support (50% retracement of 122.36 to 156.59 at 139.47) to contain downside and bring rebound. Meanwhile, break of 153.84 should confirm that the correction is completed and target 156.59 and above to resume the medium term up trend.
EUR/GBP Daily Outlook
Daily Pivots: (S1) 0.8817; (P) 0.8859; (R1) 0.8905; More...
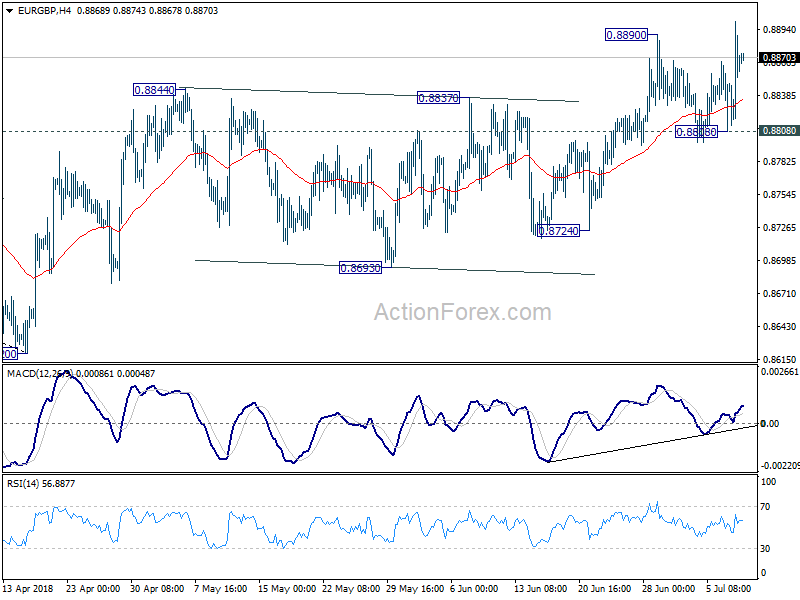
EUR/GBP's break of 0.8890 resistance suggests resumption of rise from 0.8620. Intraday bias is now on the upside. Current rally would target 0.8967 cluster resistance (50% retracement of 0.9305 to 0.8620 at 0.8963). However, upside momentum is rather unconvincing. Break of 0.8808 support will be the first sign that whole rebound from 0.8620 is completed. Deeper fall would then be seen to 0.8724 support for confirmation.
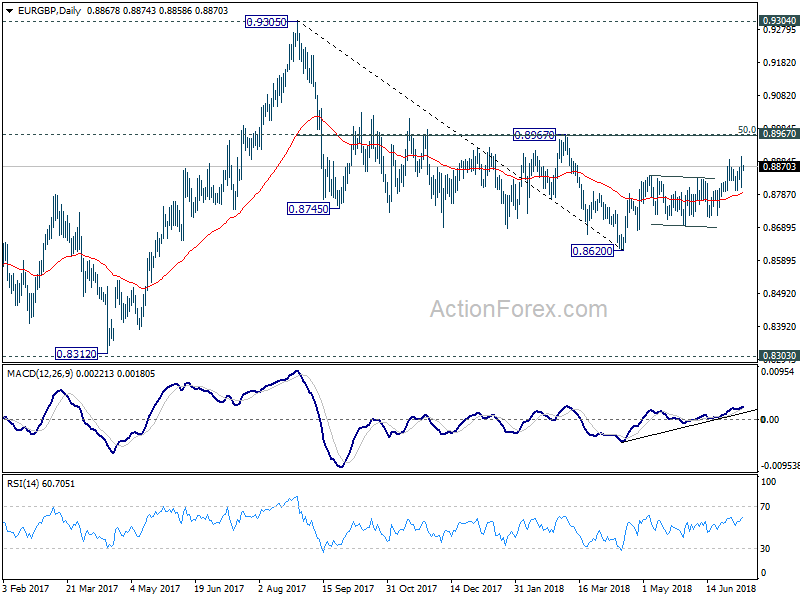
In the bigger picture, EUR/GBP is staying in long term consolidation pattern from 0.9304 (2016 high). Such consolidation pattern could extend further. Hence, in case of strong rally, we'd be cautious on strong resistance by 0.9304/5 to limit upside. Meanwhile, in another decline attempt, we'd expect strong support from 0.8116 cluster support (50% retracement of 0.6935 to 0.9304 at 0.8120) to contain downside.
EUR/AUD Daily Outlook
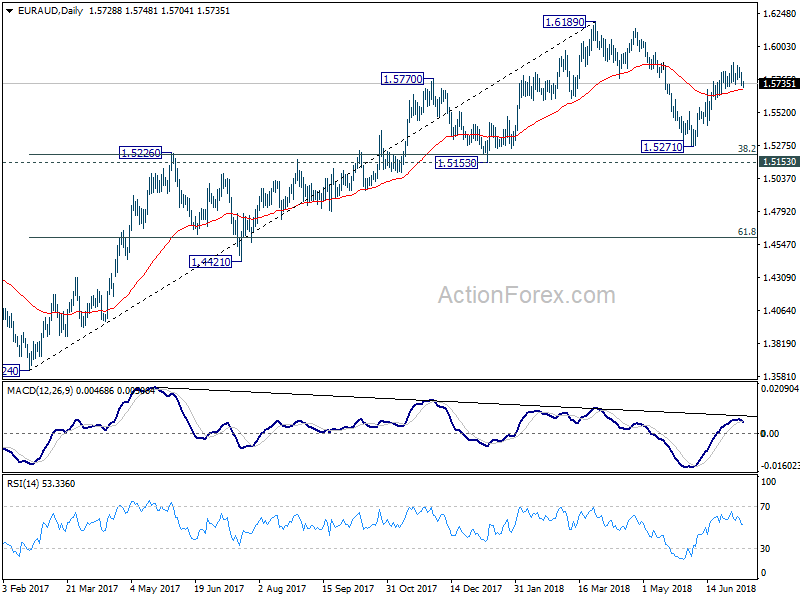
Daily Pivots: (S1) 1.5700; (P) 1.5761; (R1) 1.5800; More....
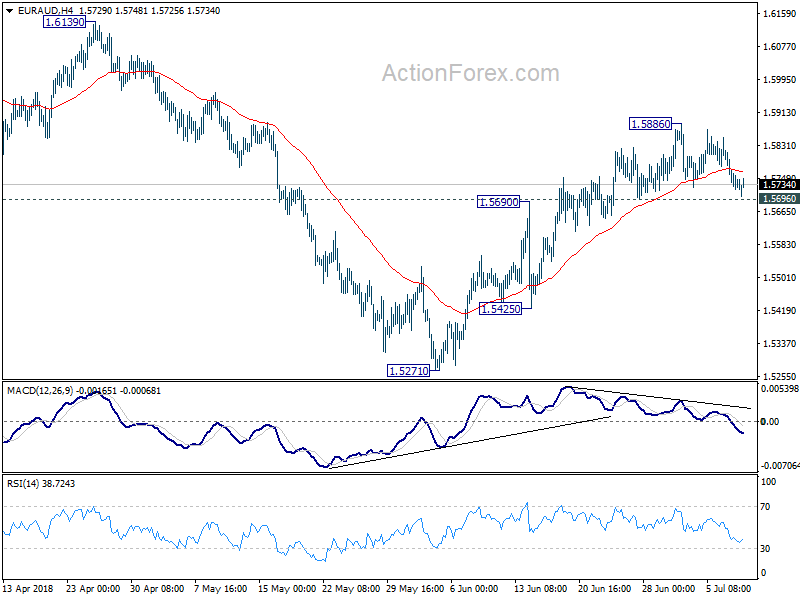
EUR/AUD's consolidation from 1.5886 is still in progress and outlook is unchanged. Intraday bias stays neutral and further rally is expected with 1.5696 minor support intact. On the upside, break of 1.5886 will resume the rebound from 1.5271 and target 1.6189 high. However, as the rebound from 1.5271 is not clearly impulsive yet and momentum isn't too convincing. Break of 1.5695 minor support could be an early sign of near term topping. In such case, bias will be turned back to the downside for 1.5425 support.
In the bigger picture, current development suggests that fall from 1.6189 is a corrective move and has completed at 1.5217 already. Key support levels of 1.5153 and 38.2% retracement of 1.3624 to 1.6189 at 1.5209 were defended. And medium term rise from 1.3624 (2017 low) is still in progress. Break of 1.6189 will target 1.6587 key resistance (2015 high).
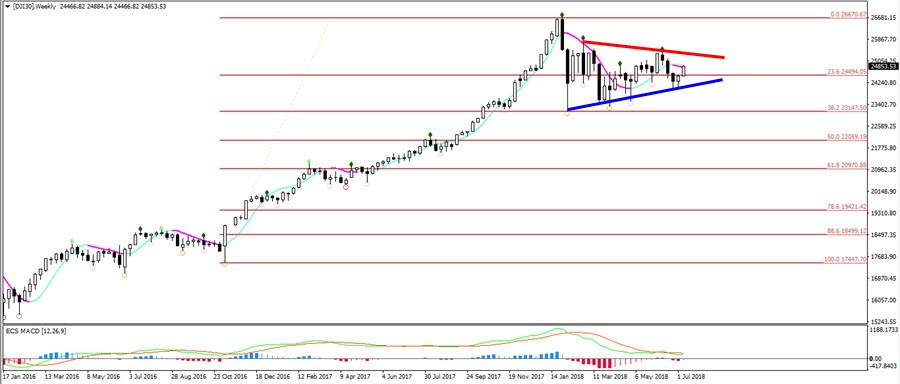
Dow Jones Index Completes Bullish Triangle Chart Pattern
Week
The Dow Jones Index (DJI) is building a triangle chart pattern after bouncing at the 38.2% Fibonacci retracement level. More upside is likely once price breaks above the triangle pattern.
A bullish breakout above the resistance trend line (red) would confirm a potential uptrend continuation. A break below the support however would indicate a bearish reversal or extended correction.
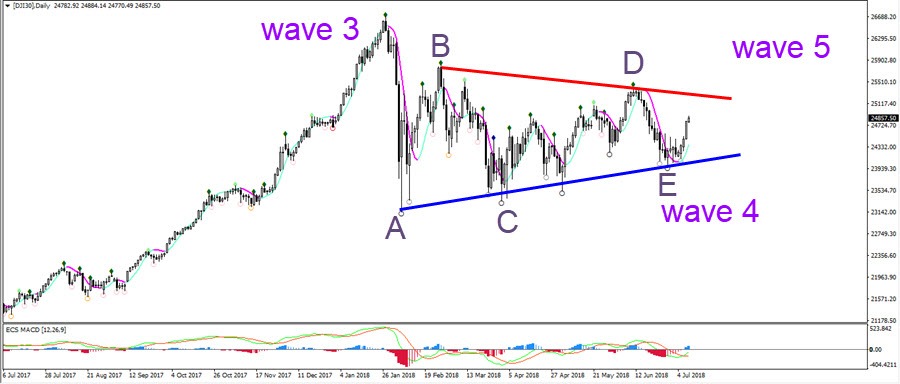
Day
The DJI seems to have completed a wave 3 (purple) and price is now potentially building a wave 4 (purple). The triangle chart pattern seems to have been completed now that a potential wave E (light purple) is visible. The confirmation is the breakout.
Brexit Resignations Sends GBP/USD Lower In Bearish ABC
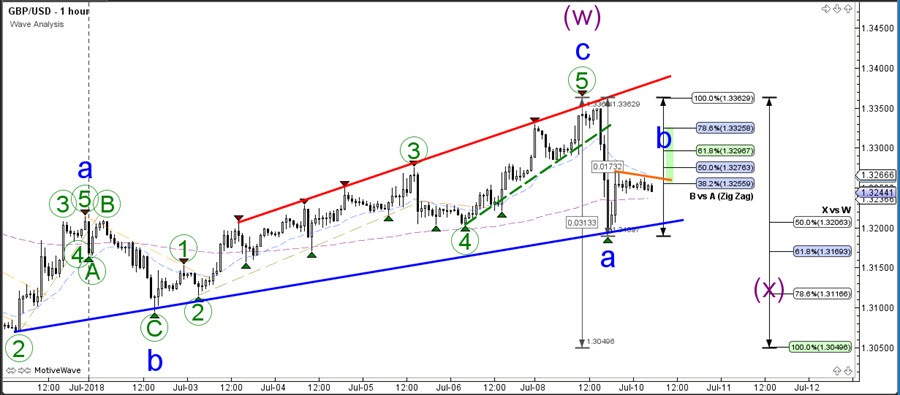
The GBP/USD made a strong bearish bounce at the 23.6% Fibonacci retracement level and resistance of the downtrend channel (red). The GBP weakened strongly after the resignation of two senior Cabinet ministers over the Brexit process.
For the moment though a larger bullish WXY (purple) correction within wave 2 (pink) seems the most likely. The wave X would become less likely if price continues to show very strong bearish momentum, otherwise the Fib levels of wave X could provide support for a wave 2 retracement.
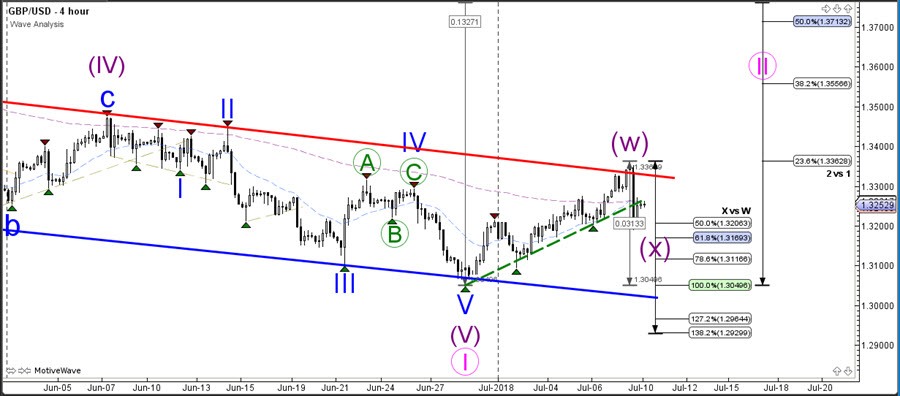
The GBP/USD made a strong bearish reversal after completing a bullish wave 5 (green) of wave C (blue). The bearish drop is probably a wave A (blue) of the anticipated wave X (purple) correction. Any bullish bounce is probably going to find resistance at the Fib levels of wave B vs A, which could cause price to fall for wave C.