Sample Category Title
US Jobs Report Sidelined By Trade Frictions But Wage Data Could Still Set Dollar Path
The nonfarm payrolls report will be eagerly awaited on Friday at 12:30 GMT for the latest indications on the United States labour market. However, with Sino-US trade tensions running high and tariffs on $34 billion worth of Chinese imports and counter tariffs of similar value on US products due to come into effect the same day, the jobs report may fail to generate the usual amount of fanfare. That is not to say that any surprises to the data won't sway the dollar as any positive shocks could still lift the currency higher given that a fourth rate hike is not yet fully priced in by the markets.
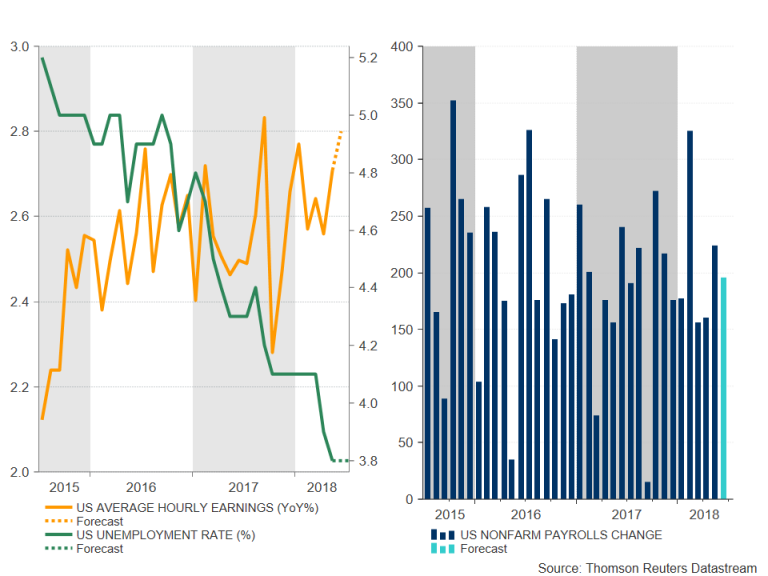
After solid job gains of 223k in May, the US economy is forecast to have added a somewhat more moderate 195k positions in June. The unemployment rate is expected to have held steady at the 18-year low of 3.8% in June. At this point, with the labour market so tight, a miss in the headline payrolls figure wouldn't cause much concern for investors, while a beat in expectations would only underscore the strength of the US economy.
On the other hand, any big surprises in the other key component of the NFP report – average hourly earnings – could trigger some repricing in fed fund futures. With the Federal Reserve keeping a close watch on wage growth, signs that wages are rising faster than anticipated could worry policymakers, especially now that the Fed has achieved in raising inflation to its 2% target. Average hourly earnings are forecast to have increased by 0.3% month-on-month and by 2.8% on a 12-month basis.
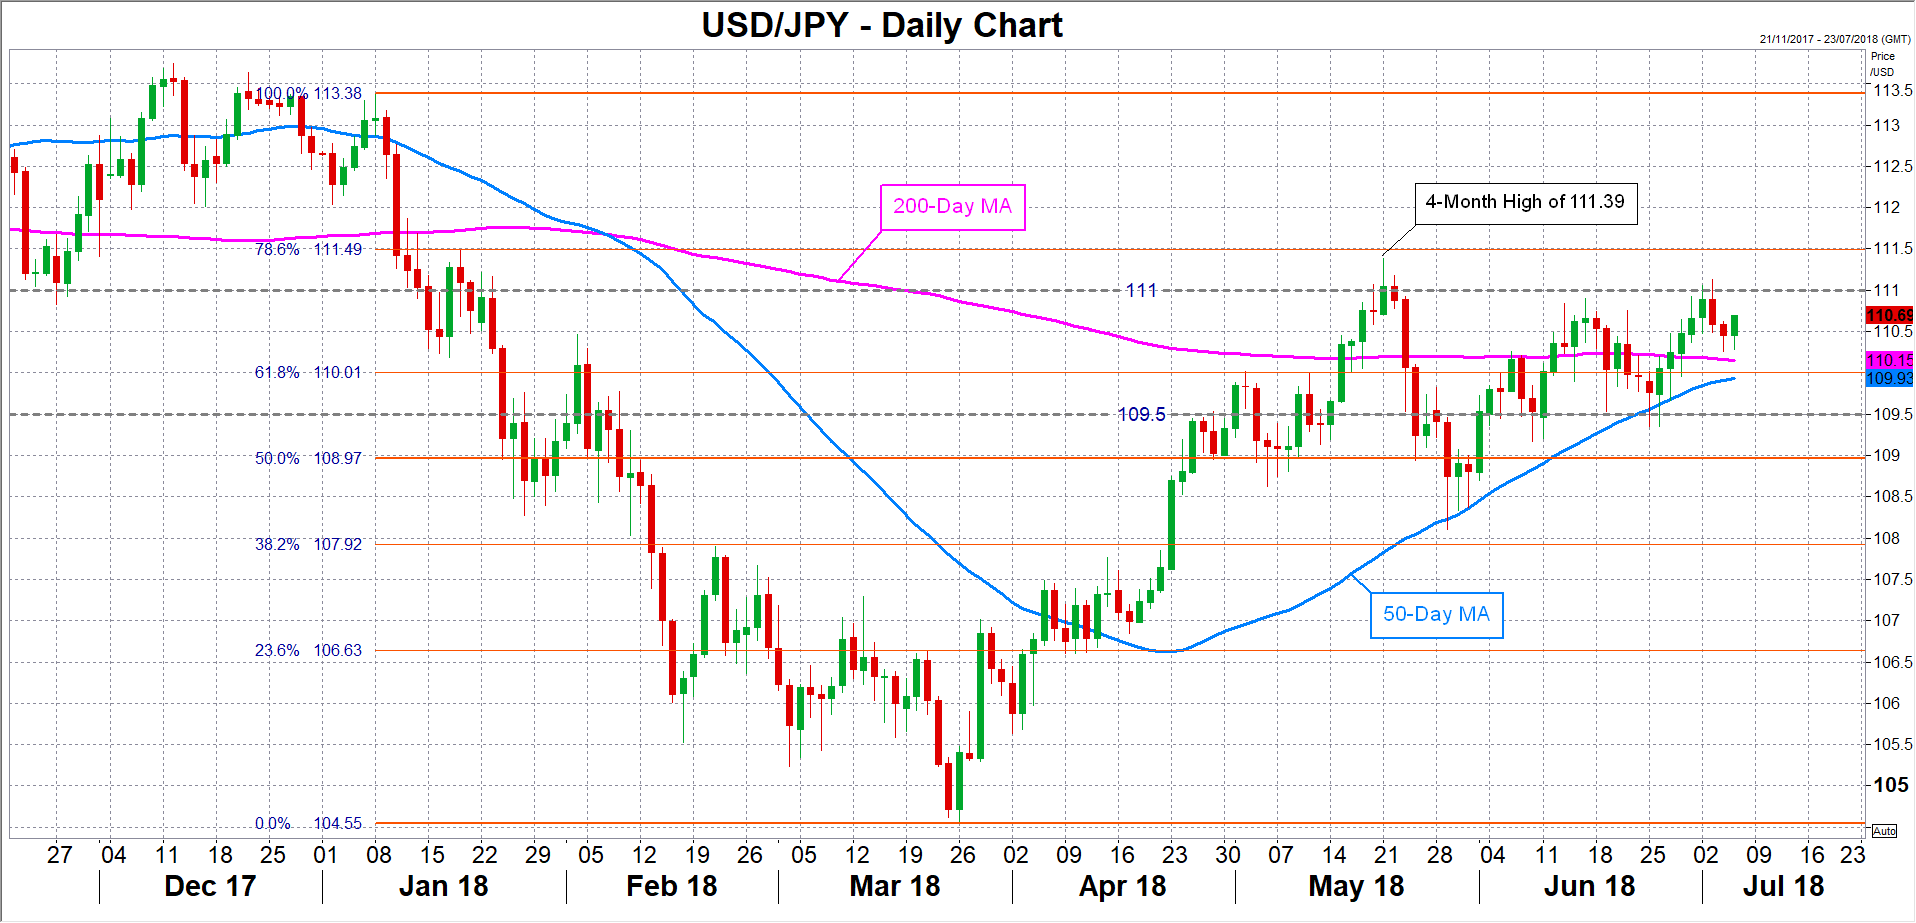
Stronger-than-expected growth in earnings could push up the odds of the Fed hiking rates two more times this year, which are currently hovering around 70%. It could also drive the US dollar higher versus the yen, which this week hit a 6-week peak. The pair could aim for a successful close above the 111 handle, having failed to do so several times this week. A decisive break above the level would clear the way for the May 4-month high of 111.39 with the 78.6% Fibonacci retracement of the January-March downleg at 111.50 not too far away.
Alternatively, a jobs report that is broadly in line or misses the expectations could lead to dollar/yen retreating from the week's highs. Initial support should come at around the 110 region, which is not only the 61.8% Fibonacci level but also a possible conversion point for the 50- and the 200-day moving averages. Sharper losses could see the pair stalling around 109.50. A breach of that support would open the way to the 109 handle.
However, a bigger threat to the greenback may not come from the NFP data but from trade-related headlines. Any new comments by President Trump or his team that escalates the stand-off between the US and China could hurt investor sentiment in a week where risk appetite is already in short supply. But even in the absence of fresh rhetoric or further retaliatory action, the market mood could still take a turn for the worse as the tariffs look set to come into force with no sign of either side making any concessions and no end in sight to the ongoing uncertainty.
Should fears of a full-blown trade war intensify and trigger another market rout at the end of the week, the dollar would once again likely enjoy demand from safety flows and post fresh gains versus emerging market and risk-sensitive currencies. However, against the safe-haven yen, the dollar would be faced with selling pressure on renewed market volatility.
Sterling lifted mildly as domestic data gave Carney some confidence
BoE Governor Mark Carney delivers a speech titled "From Protectionism to Prosperity" where he also talked about monetary policy. He noted that the current path the economy is going is "consistent with the MPC's current projection", with the assumption of a relatively smooth Brexit.
Since the May meeting "international data have been mixed" with robust growth in the US and fading momentum in Eurozone. And there were marked loss of momentum in some merging markets. However, domestically, Carney said "the incoming data have given me greater confidence that the softness of UK activity in the first quarter was largely due to the weather, not the economic climate."
He pointed to some "number of indicators of household spending and sentiment have bounced back strongly" erratic Q1. Labor market has "remained strong" and there is "widespread evidence that slack is largely used up." Pay and domestic cost growth have "continued to firm up broadly. And headline inflation is still "expected to rise in the short term" due to energy prices.
The overall impressions from Carney is that he's rather confidence that economy developed as expected. And that would add to the case for an August rate hike.
Sterling is limited mildly against Dollar and Yen after the speech.
Forex Analysis: GBPUSD And GBPJPY
The British Pound is in focus this morning after The Bank of England (BOE) Governor Mark Carney gave a speech where he suggested that the soft patch in the first quarter was due to the weather and not the economic climate. He also added that inflationary pressures are gradually building, domestic cost growth has continued to firm broadly as expected, and that a tighter monetary policy will be needed. The GBP is strengthened with an increase in the probability of a rate hike in August. Moreover, economic data in the shape of retail sales, wages and inflation are due 17-19 July and will be pivotal for any rate hike in August
GBPUSD
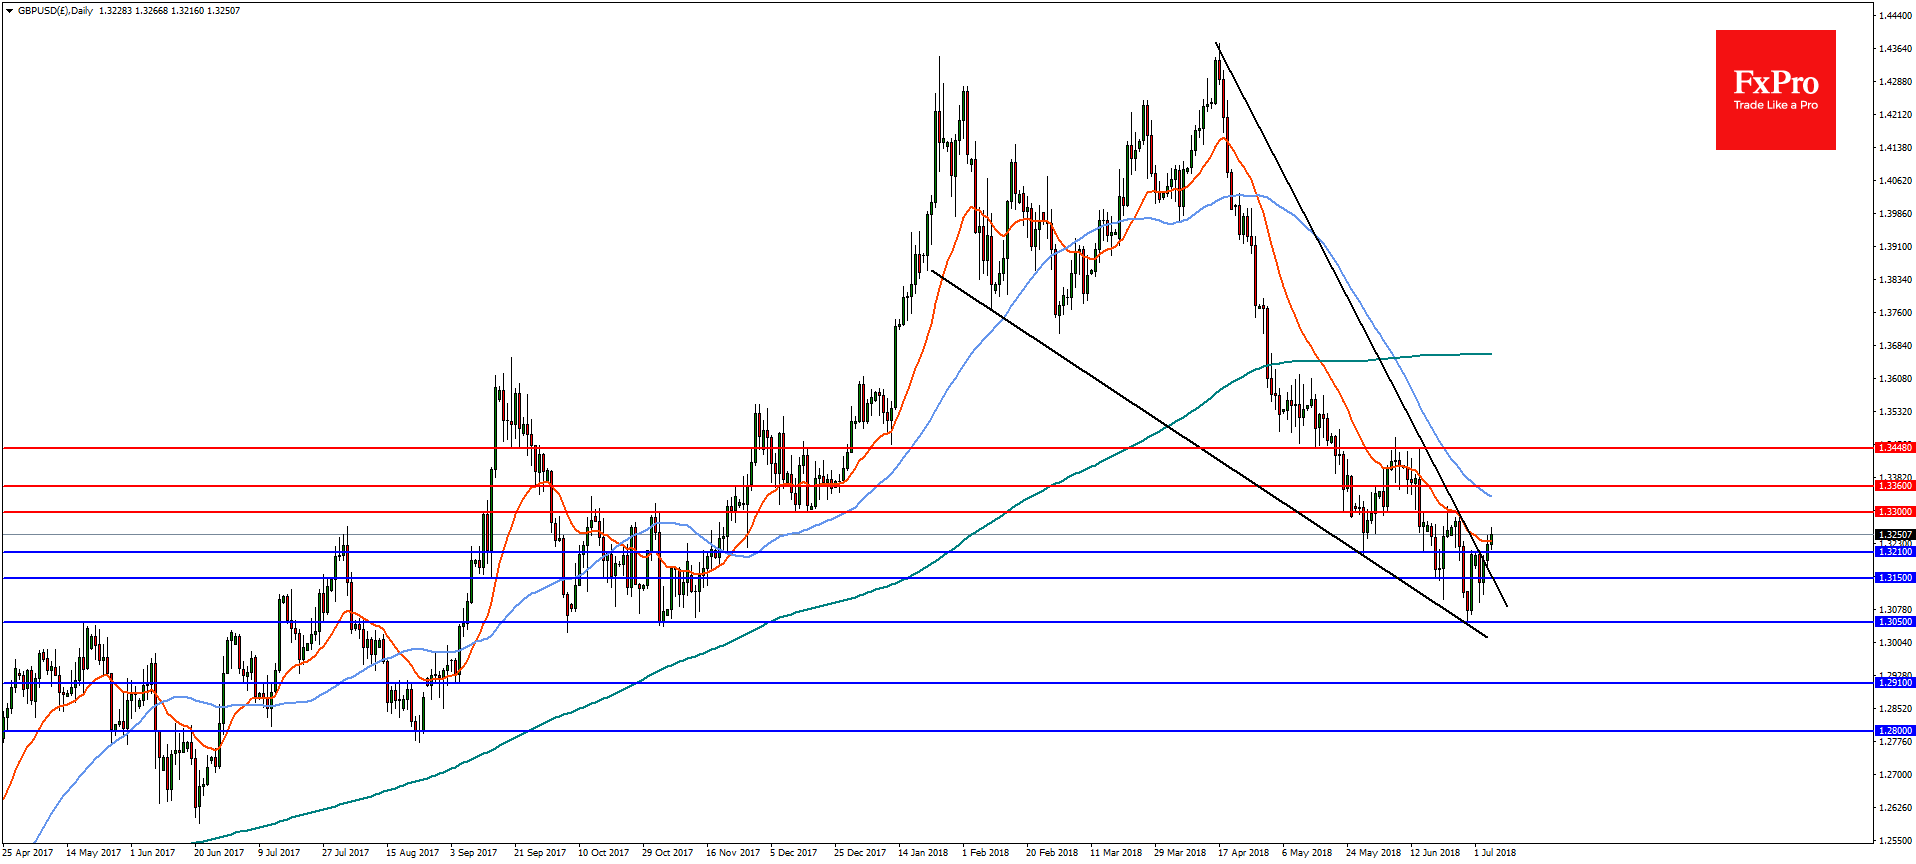
On the daily chart, GBPUSD has broken out of a bullish descending wedge after a sharp rebound from the yearly lows at 1.3050. If the pair can remain above support at 1.3210, further gains are likely towards the 23.6% retracement from the highs of April at 1.3560 with resistance at 1.3300. A reversal below horizontal and trend line support at 1.3150 would change the near term bullish stance and the pair could again test 1.3050.
GBPJPY
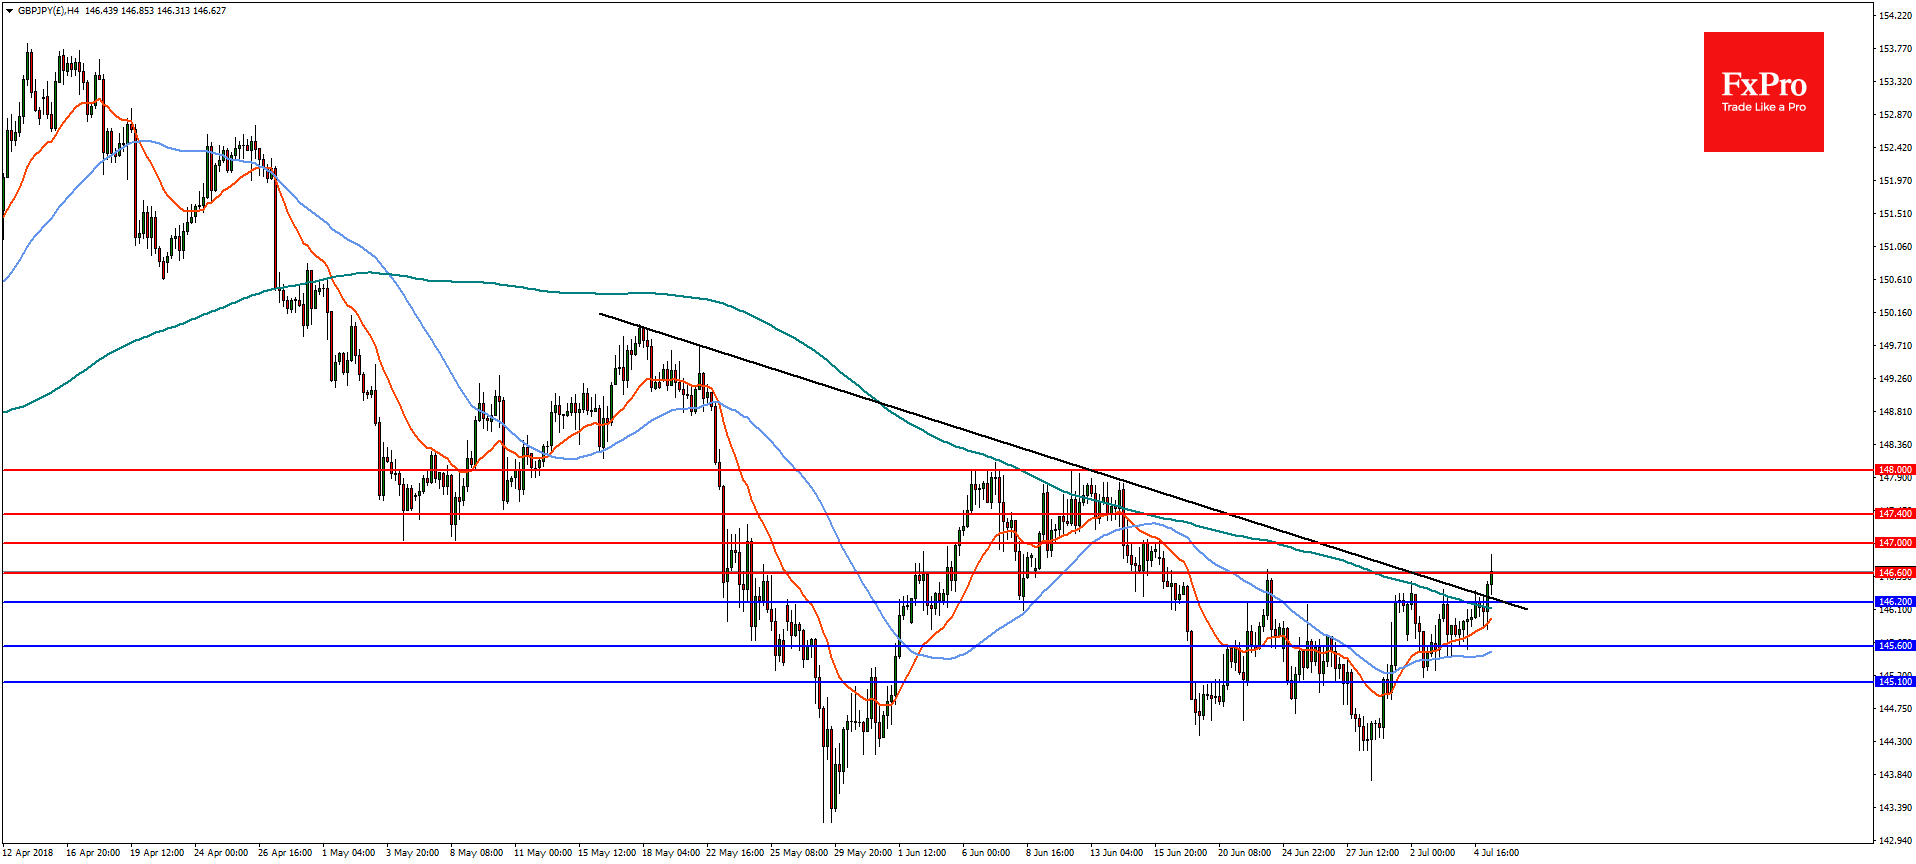
In the 4-hourly timeframe, GBPJPY is breaking above a confluence of trend line resistance, 200MA and 50% retracement of the 150.00 to 143.20 drop at 146.60. Provided the pair can remain above 146.20, upside continuation is likely towards 148.00 with resistance at 147.00 and 147.40. A drop through 146.20 would negate the outlook with further support at 145.60.
Forex Analysis: EURGBP
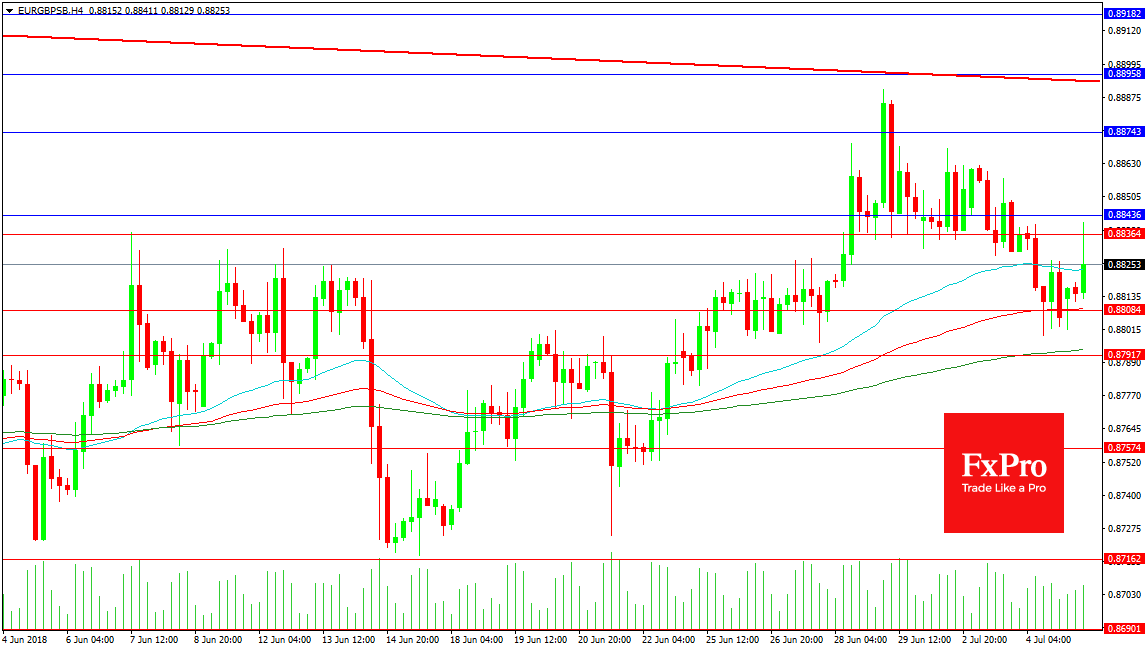
The EURGBP is trading at its 50 period MA in a 4 hour time frame at 0.88235 after it reversed its fall from yesterday this morning to reach 0.88411. This was on the back of reports that some members of the ECB are of the opinion that hiking in the autumn of 2019 will be too late. Resistance comes in at 0.88436 above today’s high forming an area that was first tested early in June and was used as support and resistance as June turned to July. A break above this area would target the highs at 0.88743 followed by 0.88920. The falling trend line at 0.88900 is longer timeframe resistance giving strength to the 0.89000 level.
The fall yesterday was triggered by a reaction to stronger UK Retail Sales, and better economic data from the UK will add strength to the GBP, with price in the pair pushing lower towards yesterday’s lows and the 200 period MA at 0.87938. A break under this level and the 0.88000 area can see a drop towards 0.87574 followed by 0.87162 and the 0.86900 area.
Forex Analysis: USDCAD
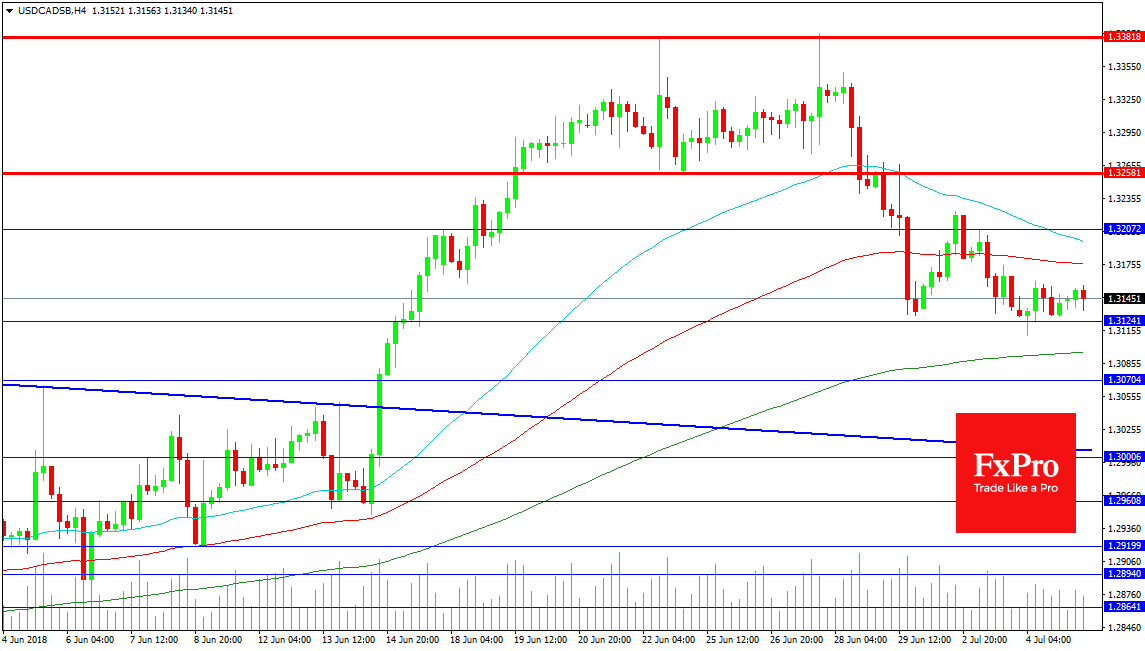
USDCAD is consolidating and building energy as liquidity conditions were tight this week with the Canada day holiday on Monday and US Independence day yesterday. The price is confined to a tight range around 1.31450 with resistance at 1.31755 and the 100 period MA followed by 50 MA at 1.31967 and the 1.32000 level. A break above this area could point to a retest of 1.32581. This was the trough of the double top from late June with further resistance at the highs of 1.33818.
Support for the pair is at the 1.31241 area followed by the low at 1.31108. The 200 MA is found at 1.30962 with the 1.30704 level providing support that was formerly resistance. The falling support trend line at 1.30100 is adding strength to the 1.31000 level and this is a point at which buyers may wish to engage with the market. A loss of this area points to further declines through 1.29600, 1.29200 and 1.28940 with stronger support at 1.29640.
Canadian Jobs Data Due With Bank Of Canada Decision Looming
The Canadian employment report for June is due on Friday at 1230 GMT. The release will constitute the last major data print before the Bank of Canada (BoC) meets to decide on rates next week and is seen as having the capacity to shift expectations regarding the delivery of an interest rate increase. Besides that, NAFTA negotiations, another loonie driver, may receive new traction following the recently-completed Mexican elections.
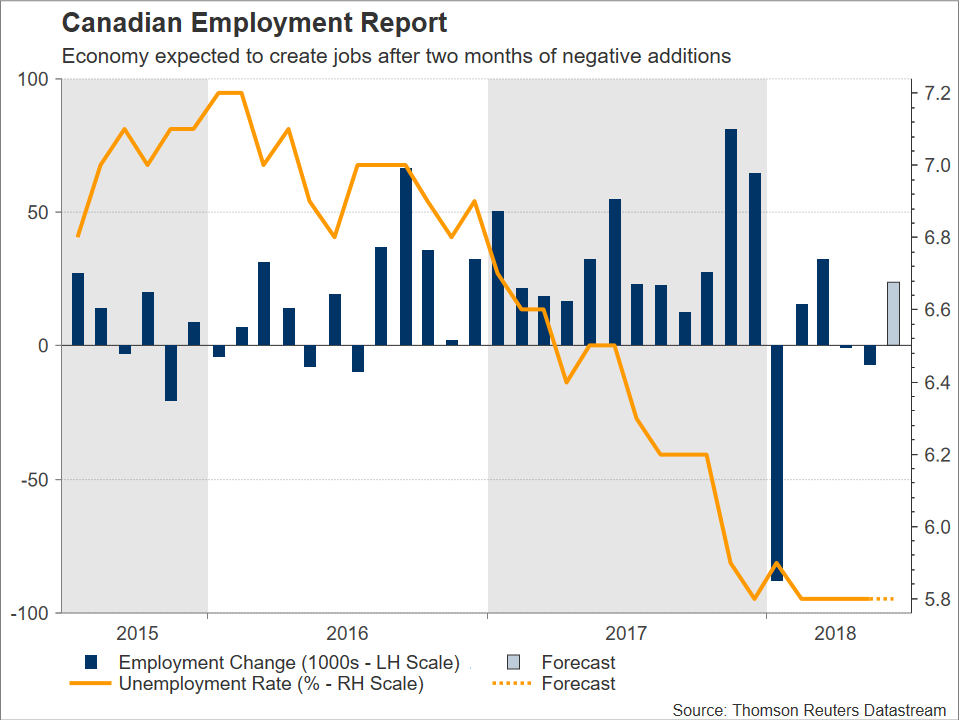
Canada's economy is anticipated to have added 24k positions during June, which compares to a reduction of 7.5k in May. Still, despite May's negative jobs growth, household incomes – a data point that is closely monitored by the BoC – rose to match their highest pace of expansion since July 2012. Meanwhile, the unemployment rate is projected to remain unchanged at 5.8%, its lowest since the 1970s. Overall, the nation's labor market seems to have cooled a bit in 2018 after a strong 2017 (this can be seen from the following chart as well).
Currently, the consensus view is that the Bank of Canada will proceed with the delivery of a 25bps rate hike upon completion of its meeting on monetary policy on July 11. Specifically, the probability for such an outcome stands at 71% according to Canadian overnight index swaps. For the record, the Canadian central bank has delivered three quarter percentage point interest rate increases since beginning its hiking cycle in July last year.
An upbeat report on Friday has the potential to more conclusively put on the table a rate hike by the BoC, consequently supporting the loonie (the opposite holds true as well of course) which is performing poorly versus its US counterpart so far in 2018. Particularly, the currency has lost 4.5% year-to-date against the greenback, with the underperformance largely attributed to uncertainty over the future of NAFTA negotiations.
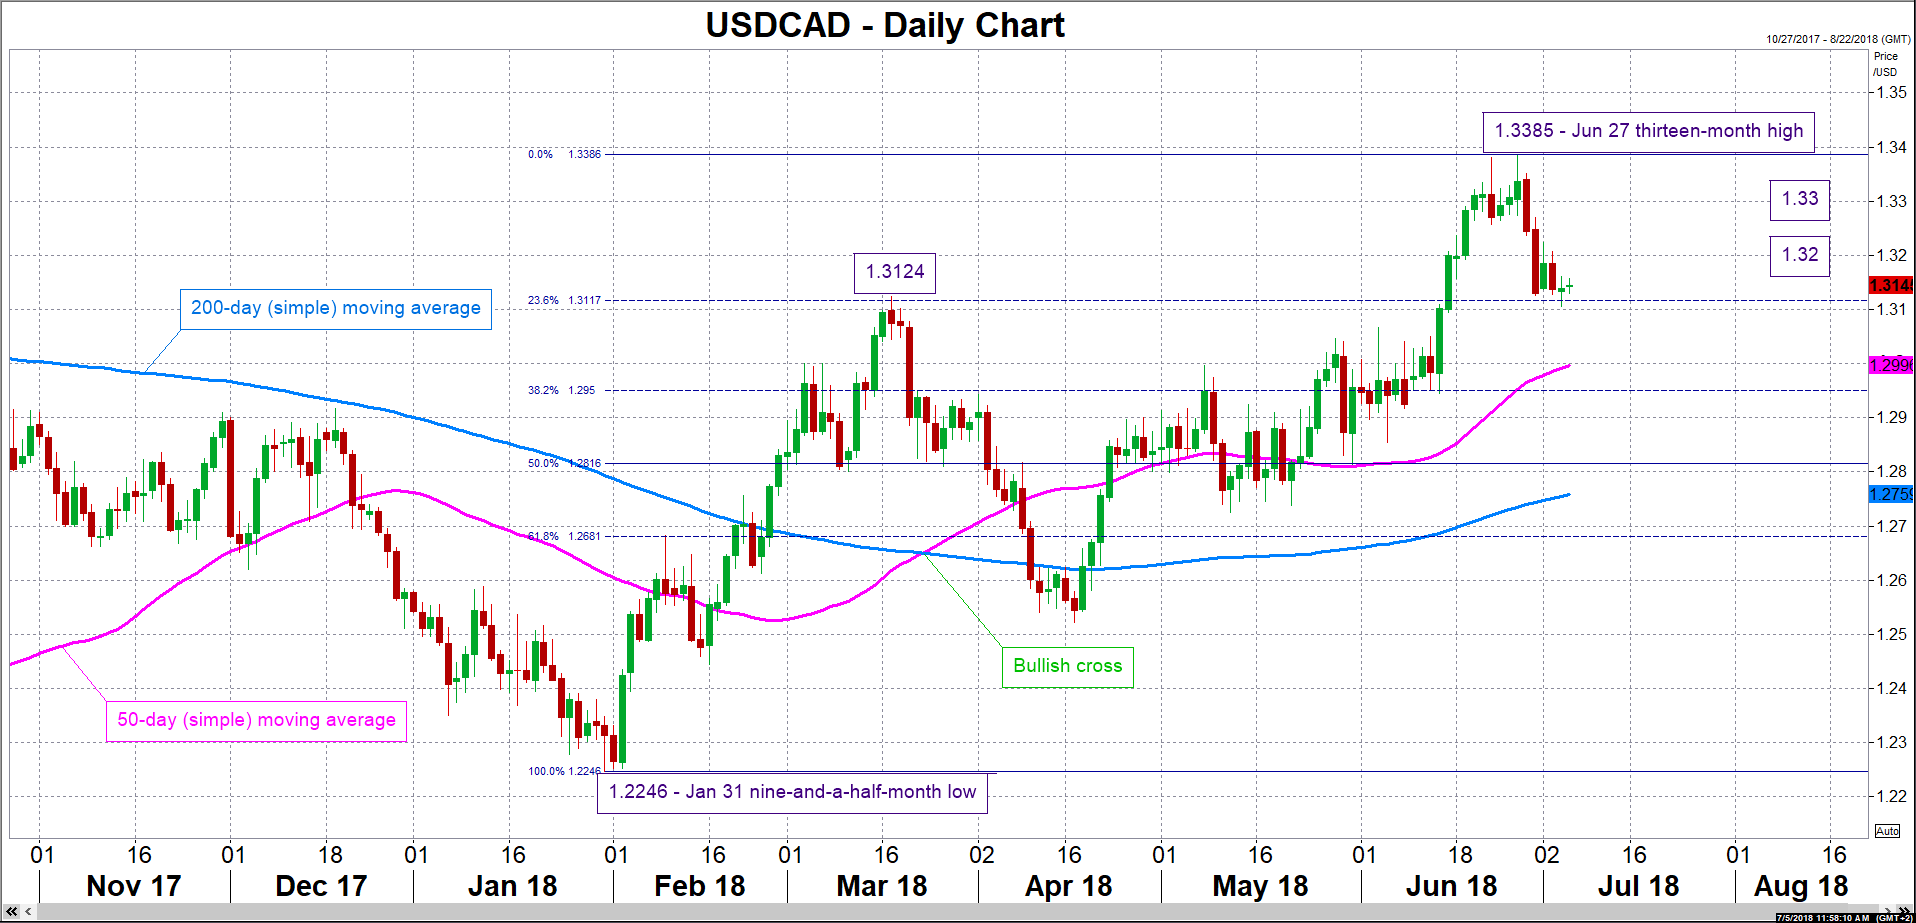
Technically, a rising USDCAD (this is equivalent to a weakening loonie) may meet resistance around the 1.32 and 1.33 round figures, before the attention turns to the 13-month high of 1.3385 recorded in late June. On the downside, immediate support could come around the 23.6% Fibonacci retracement level of the January 31 to June 27 upleg at 1.3117, with the area around it encapsulating the 1.31 handle, as well as a peak from late March at 1.3124. Further below, the focus would shift to the region around the current level of the 50-day moving average at 1.2996, including the 1.30 mark.
In terms of FX market reaction, it should also be kept in mind that the corresponding jobs report for June out of the US will also be made public at 1230 GMT; in other words, movements in the dollar/loonie pair will not be solely dictated by the Canadian data. Additionally, Canada will be seeing the release of numbers on May's trade balance at the same time.
Lastly, volatility in oil prices – Canada is a major exporter of the precious liquid – and perhaps more importantly NAFTA-related developments should also be monitored, as they could offer direction to the loonie. As regards the latter, there have been signals, at least from the Mexican side, that the completion of the Mexican elections and the victory of leftist Andres Manuel Lopez Obrador will be met with a new round of NAFTA-renegotiation talks. Such discussions could lead to an agreement between the various parties even before the incoming government takes power in December according to Lopez Obrador's chief negotiator for NAFTA. Should positive momentum for a deal indeed emerge, then the Canadian dollar is expected to gain relative to its US counterpart.
Will Euro Central Bank Hike Rates Earlier?
EUR better bid as investors re-price ECB first rate hike
The greenback lost ground on Thursday as investors started to question the narrative that trade tensions would be dollar positive. The dollar index slid 0.20% to 94.35 amid a broad rally of its G10 peers. The single currency rose 0.30% against the buck after German factory orders unexpectedly surged 2.6%m/m in May, widely beating forecast of 1.1%. Previous month's reading was also upwardly revised to -1.6% from -2.5%. This is the first time this year that the gauge came in positive territory, suggesting that the weakness of the start of the year was only temporary.
In addition, there are some rumours that ECB members believe that a rate hike around the end of 2019 would be “too late”. This development provided a much-needed push to the euro. German yields rose across the curve with the 2-year yield increase 3bps to -0.63%, while the 10-year one added 3.3bps to 0.336%. Despite an improving risk sentiment across financial markets – equities are blinking green across the board – there is a good chance the euro's gains will prove short-lived, as investors are getting nervous ahead of trade tariffs deadline. Indeed, both the US and China said the tariffs take effect on July 6.
Watch the Fed's minutes
At 14.00 Washington DC time today, the US Federal Reserve will publish the minutes of its June meeting on monetary policy. This will drive the USD and US yield curves. Economic growth continues to accelerate, despite expectations of a cyclical slowdown. This increases the probability of additional rate hikes – perhaps a fourth one late this year. Also interesting will be the Fed's view on trade and inflation.
Impact on G10 currencies should be limited, since the Fed's tightening cycle is already priced in. Still, emerging market, interest rate sensitive currencies should come under pressure. Currencies with significant USD liabilities such as TRY and INR are extremely exposed.
Forex Technical Analysis: EUR/USD, USD/JPY, GBP/USD
EUR/USD
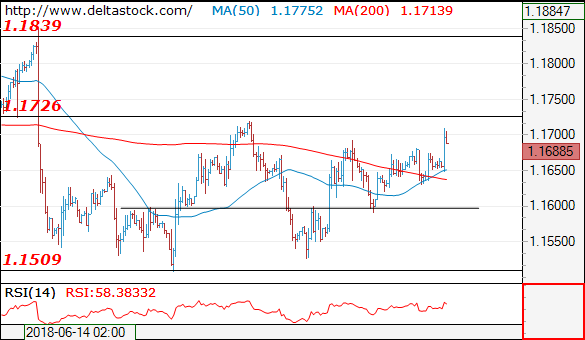
Current level - 1.1688
I favor a break through 1.1730 resistance to allow a rise towards 1.1830 zone. Initial minor support lies at 1.1680 and crucial on the downside is 1.1630.
| Resistance | Support | ||
| intraday | intraweek | intraday | intraweek |
| 1.1730 | 1.1730 | 1.1680 | 1.1510 |
| 1.1830 | 1.1830 | 1.1600 | 1.1300 |
USD/JPY
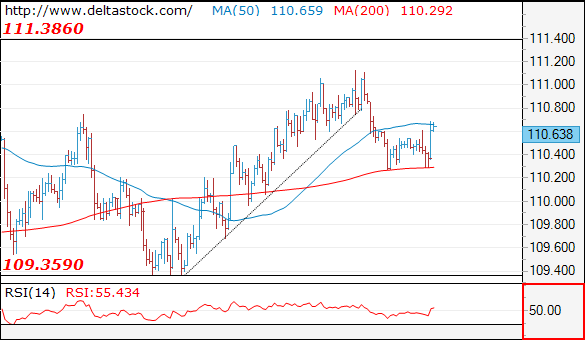
Current level - 110.63
A reversal has been confirmed at yesterday's peak at 111.13 and the bias is bearish, for a slide towards 109.40 area.
| Resistance | Support | ||
| intraday | intraweek | intraday | intraweek |
| 110.75 | 111.40 | 110.40 | 107.80 |
| 111.40 | 114.40 | 109.40 | 106.70 |
GBP/USD
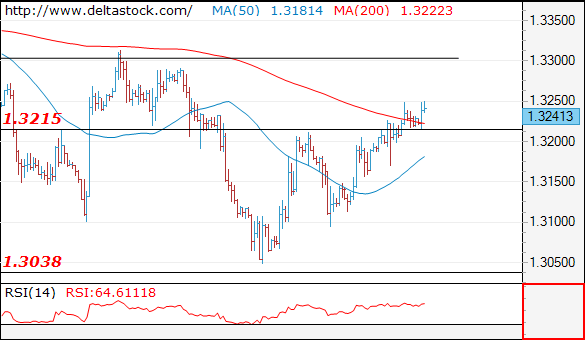
Current level - 1.3241
I expect the upmove to continue towards 1.3310 area, as intraday support is projected at 1.3215 and crucial on the downside is 1.3170 low.
| Resistance | Support | ||
| intraday | intraweek | intraday | intraweek |
| 1.3310 | 1.3618 | 1.3215 | 1.3040 |
| 1.3310 | 1.3990 | 1.3100 | 1.2770 |
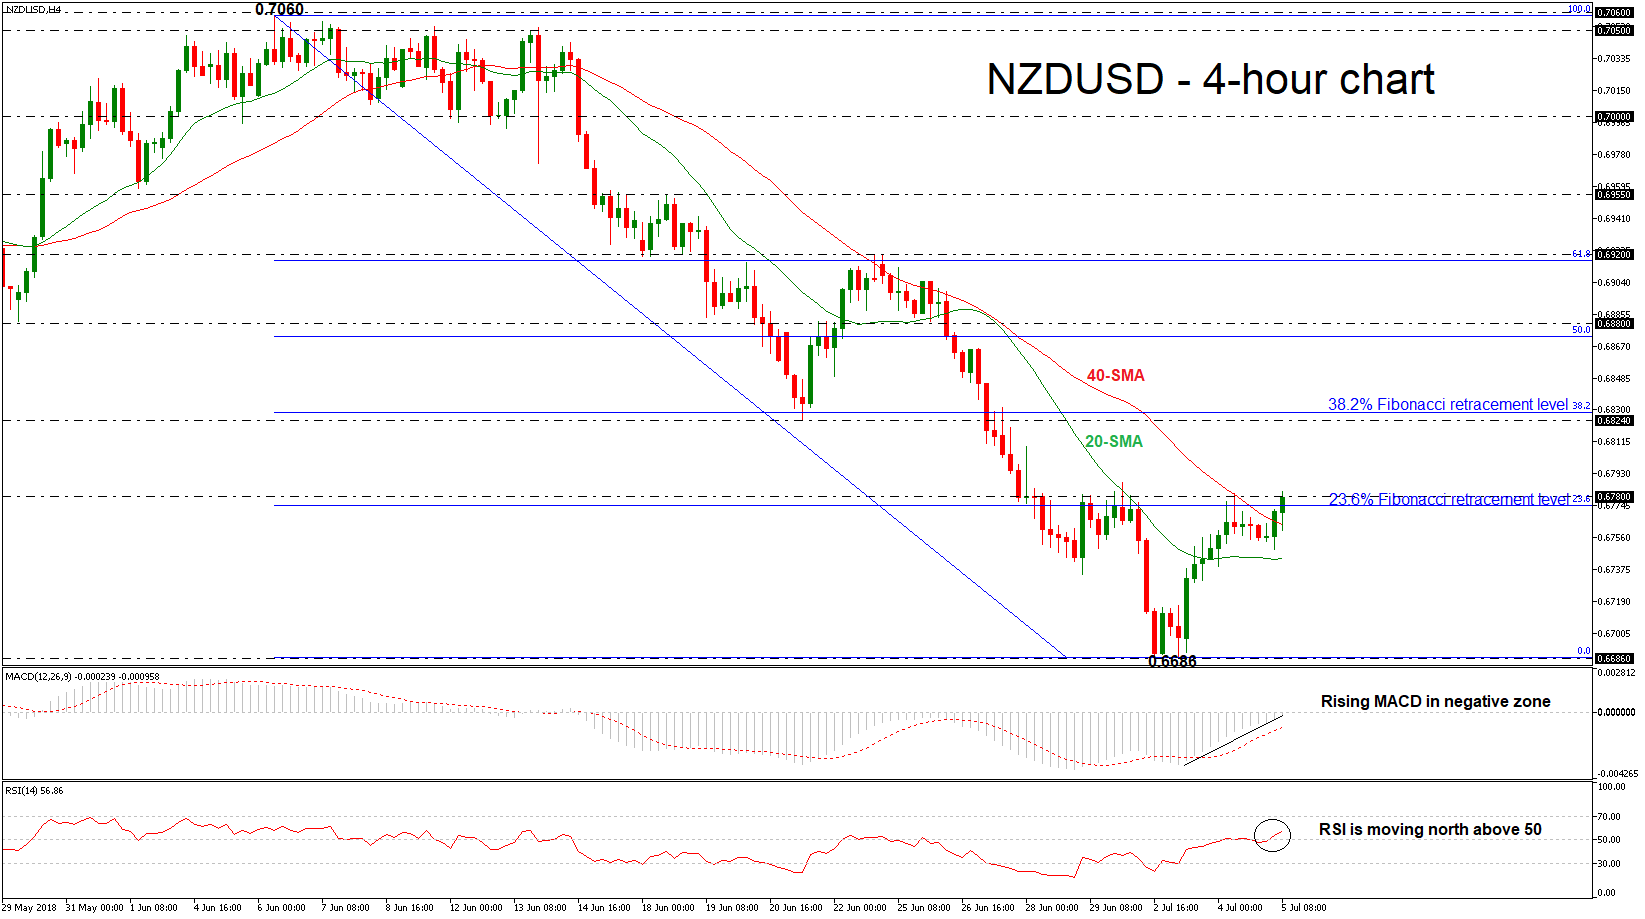
NZDUSD Turns Bullish In Short Term After Dramatic Slump
NZDUSD has advanced considerably since roughly the beginning of the month, hitting the 0.6780 resistance level again, during Thursday’s European session. The price surpassed the 20- and 40-simple moving averages (SMAs) in the 4-hour chart, while the technical indicators suggest further advances.
Momentum indicators are pointing to a bullish bias in the short term with the RSI above threshold of 50 and the MACD oscillator is rising in the negative territory with strong momentum, indicating a further upside reversal is nearing.
Further gains should see the June 21 bottom of 0.6824 before being able to hit the 38.2% Fibonacci retracement level of the downleg from 0.7060 to 0.6686, around 0.6830. A rise above these strong key levels would reinforce the bullish correction in the short-term and open the way towards the 50.0% Fibonacci mark of 0.6872.
In the event of a downside movement, the 20-SMA near 0.6745 at the time of writing could act as support barrier. A break below this zone would drive the price until the more than two-year low of 0.6686 support.
Overall, NZDUSD seems to be giving back all the losses that it posted in the previous days this week endorsing the scenario for a possible upside retracement.
USDJPY Hovers Above SMAs, Bullish Extension Is Expected
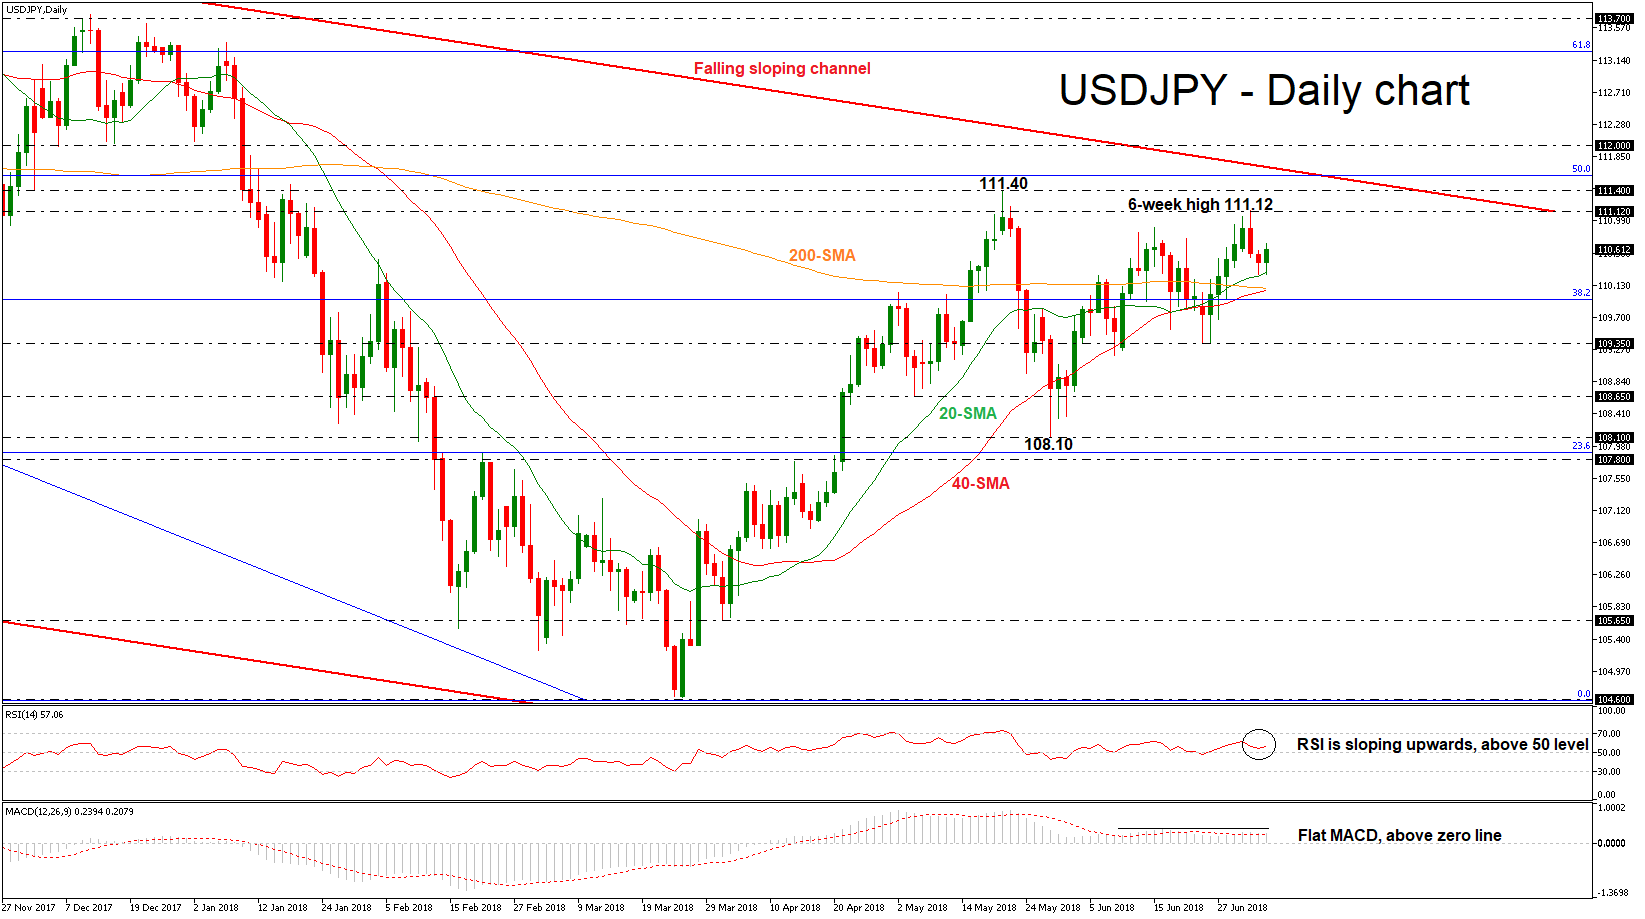
USDJPY is on course to set a bullish day after two straight negative sessions. The price surpassed the moving averages in the previous week and challenged a fresh six-week high of 111.12 before the slip to the 20-day simple moving average (SMA). The momentum indicators are supportive of the neutral to bullish picture in the near-term.
Technically, the RSI indicator is sloping slightly to the upside in the positive territory, while the MACD oscillator is flattening above the zero line and near its red-trigger line.
Should the market edge higher, resistance could be met between the 111.12 resistance level and the 111.40 barrier. Slightly higher the 50.0% Fibonacci mark near 111.60 could be in focus. A leg above this area could send prices towards the 112.00 psychological barrier, which currently is in the path of the descending trend line of the longer-term falling sloping channel. In case of an upside violation of this level, it could shift the bearish bias to bullish.
However, if the pair records some losses and closes below the 38.2% Fibonacci, support could be met at the 109.35 hurdle. A dive below this level could drive the pair until the 108.65 obstacle, taken from the low on May 4.
Having a look at the bigger picture, USDJPY has been trading within a descending sloping channel since December 2016, while in the medium-term the market holds in an ascending movement after the rebound on the 104.60 support.