Sample Category Title
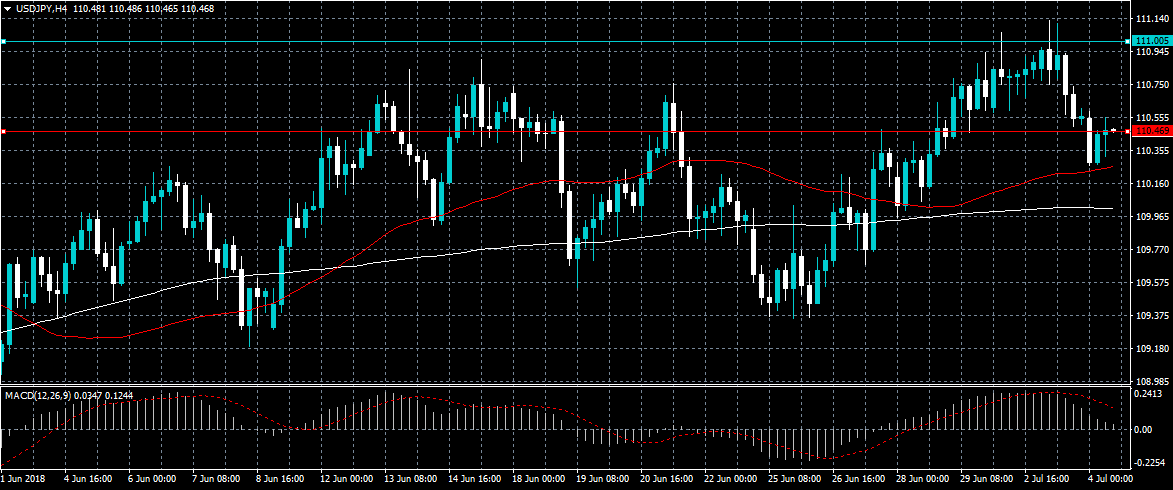
USDJPY Further Bearish Below 110.46 Level
The US dollar has tumbled towards the 110.25 support level against the Japanese yen currency, after repeated technical failure around the 111.00 level. The USDJPY pair currently trades around the 110.46 level and is being supported by intraday strength in the greenback. Sellers will look for further losses towards the 110.00 level, while buyers will look to hold price above the 110.46 level.
The USDJPY pair is intraday bearish while trading below the 110.46 level, further downside towards the 110.00 and 109.54 levels remains possible.
If the USDJPY pair moves above the 110.46 level, buyers will likely test towards the 110.80 and 111.10 resistance levels.
Forex Analysis: AUDUSD And USDJPY
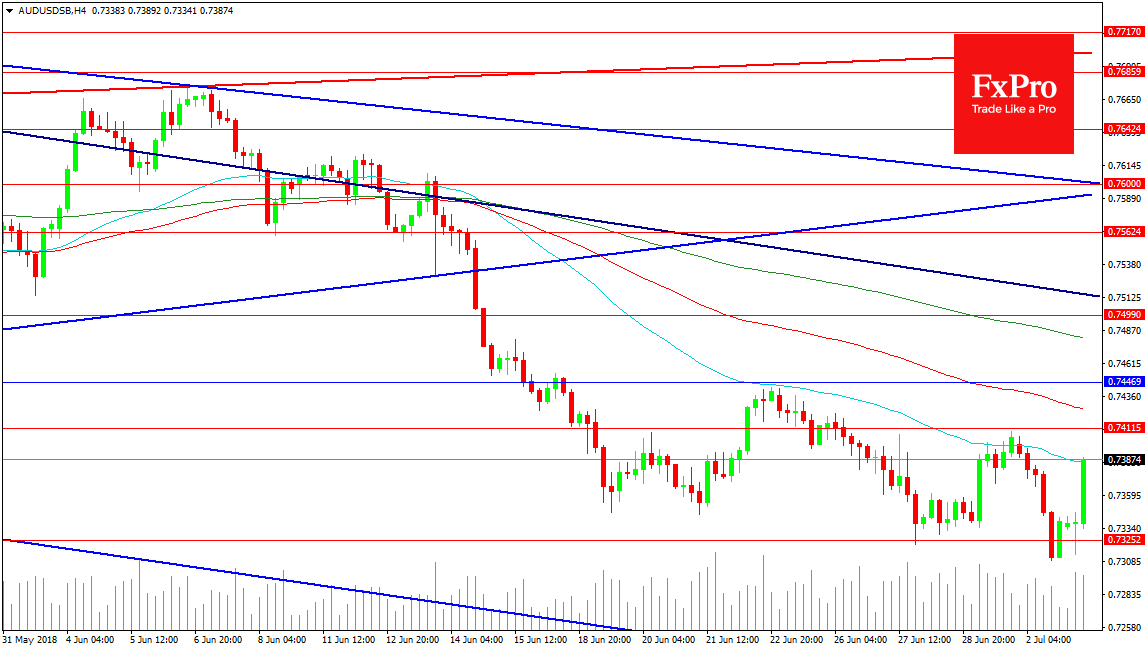
The AUDUSD pair has moved higher to its 50 period MA today at 0.73875 after the RBA decided to maintain rates at 1.50%. The tone of the statement was neutral and the AUD moved higher towards the 0.74000 level. The support for the move came from yesterday’s low at 0.73099 and price was able to gather more support around 0.73250. A drop under this area can see price test 0.73000 followed by 0.72580 and the falling support trend line at 0.72050.
Resistance can be tested on a break above 0.74115 with the 100 period MA at 0.74270. The area around 0.74470 has seen price fail early last week and a break above this area would be decisive in an attempt to get back above 0.75000. The 200 period MA is placed at 0.74814 with falling resistance trend lines at 0.75125 and 0.76000. The latter level also plays host to rising resistance trend line and can be quite strong however price is 220 pips lower at present.
USDJPY
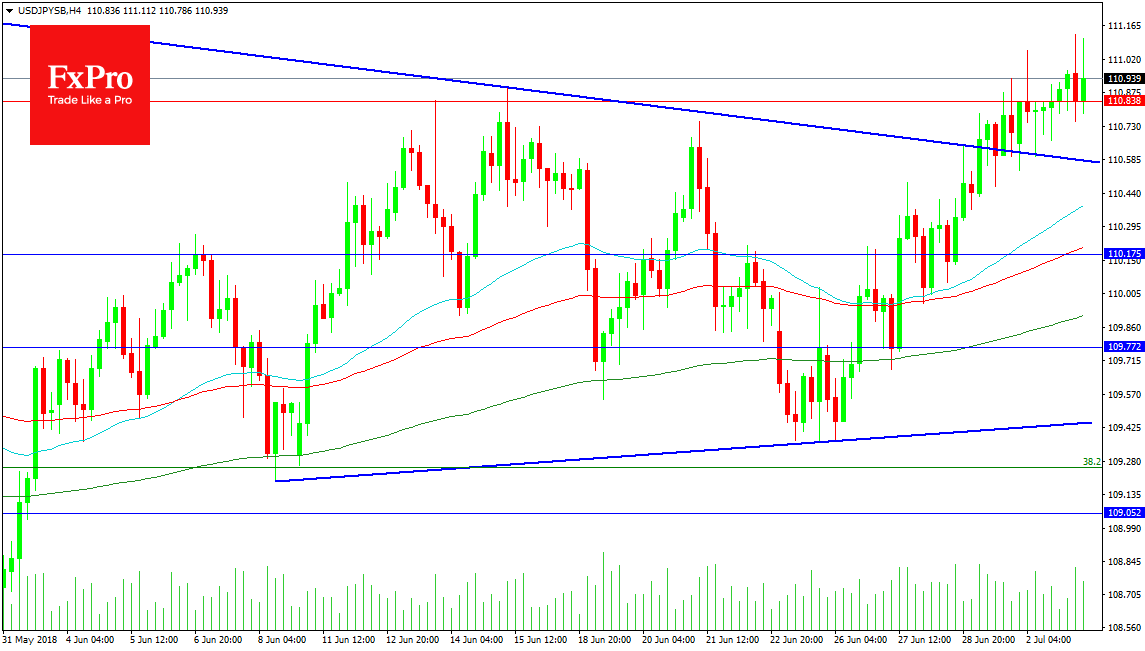
This pair is serving time trading between 111.400 and 108.000 at present with a tighter range seen here in 4 hour between 110.900 and 109.250. The upper limit of the latter range has been broken today and this has seen a test of 111.000 today. A confirmed break out higher would test 111.390 followed by 111.750 and ultimately the 112.000 area.
Support can be seen at the broken trend line at 110.580 with a breakdown of the line resulting in more sideways consolidation. The 50 period MA is found at 110.385, the 100 at 110.206 and the 200 at 109.910. A break under 110.000 can see buyers step in at lower levels but a loss of 109.440 and trend line support could see their stops taken out and sellers try for another leg down towards 109.000 followed by 108.540, 108.277 and 107.917.
Forex Analysis: GBPUSD
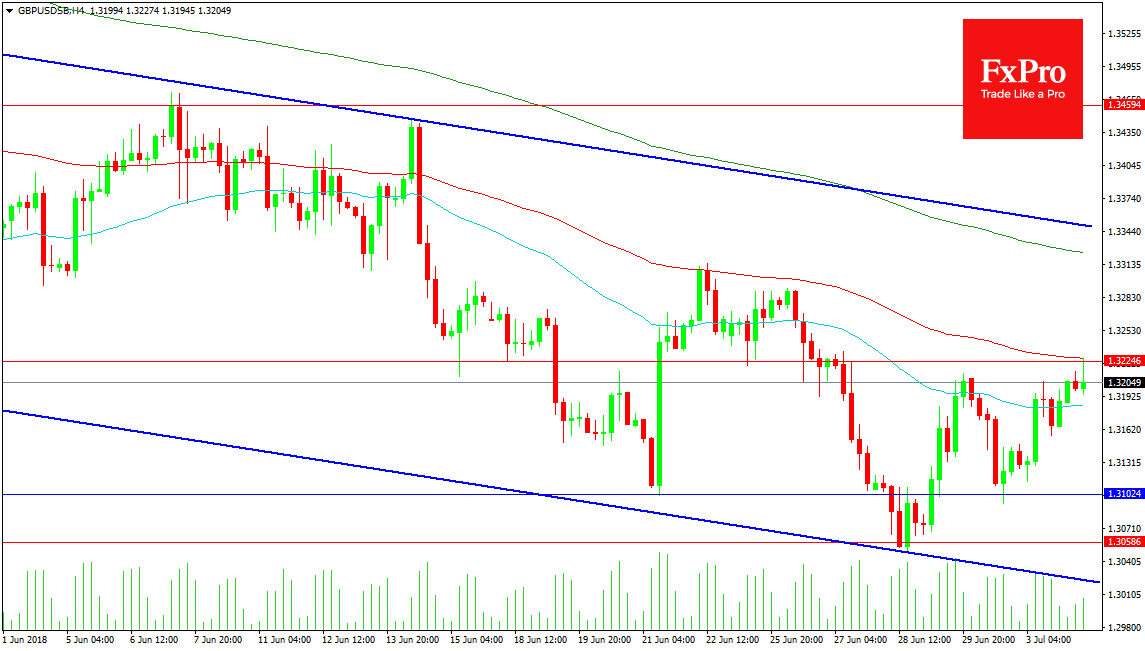
The GBPUSD pair has bounced back to its 100 period MA at 1.32273 from its low of 1.30493 last week. We now have support at the 50 period MA at 1.31841. The next level of support is 1.31024 which is an important area for traders who are trying to keep price moving higher. A loss of this area would likely see a retest of the lows that may result in a double bottom. This would entice buyers to look for a target of 1.33400 and the channel top. A drop under the low would see price move to the channel bottom at 1.30250 or the 1.30000 level.
Resistance can be seen at 1.32246 and the channel top at 1.33500 with a break above this area giving long traders confidence of a move to test 1.34594. A above this level the 200 period MA at 1.33244 may be a point of resistance that saps energy from the drive higher. The 1.35000 area is increasing in importance and a successful breakout of the channel can hinge on interactions with this level. From here the next level of resistance is 1.36135 followed by 1.37117 which is the February low.
Forex Analysis: Gold Analysis
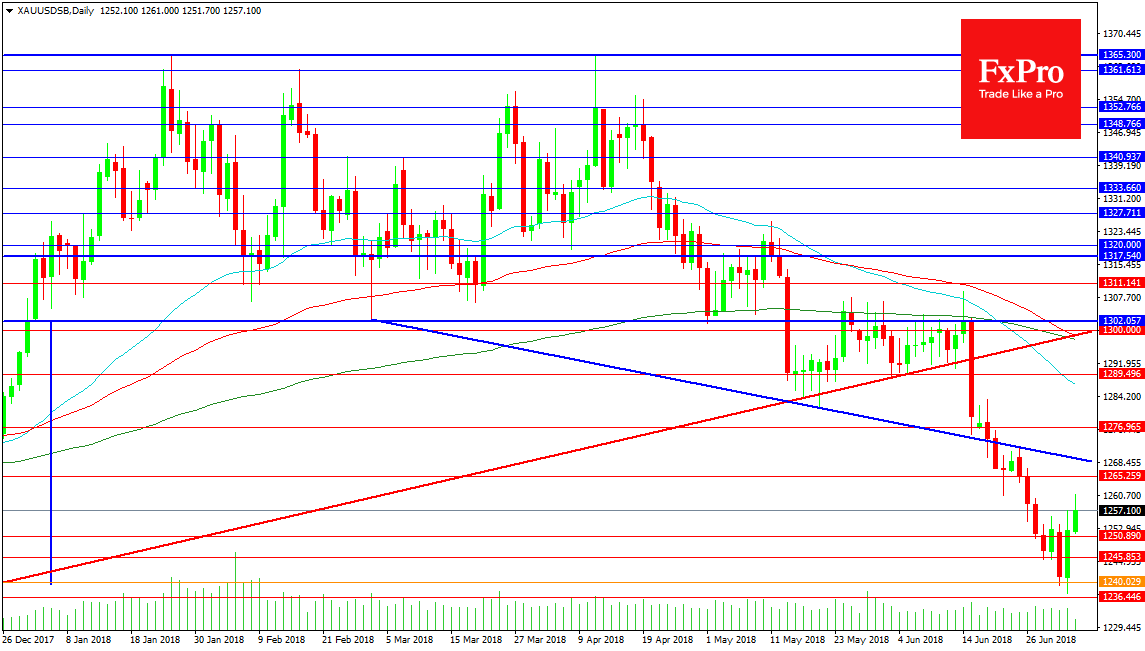
The gold chart has played out as a double top with a break under 1300.00 signalling a move down to 1240.00 from its highs at 1365.00. We have now hit the 1240.00 target area and some profits have been taken here with buyers stepping in to drive price higher. With 1240.00 broken support was found at 1236.45 and price moved back higher. Further support can be seen at 1229.40. Below this area a drop to 1200.00 could be forecasted with 1204.50 on the way as satellite support.
Resistance above the current level comes in at 1265.25 with the descending blue trend line at 1268.50. A break out higher would give long traders a chance to enter or add to their positions provided 1276.95 is cleared. At this point 1300.00 becomes a target with 1289.45 and the 50 DMA at 1287.08 providing resistance. The rising red trend line has reached 1300.00 adding support to the level and can provide additional interest at that point. The 200 DMA is sitting on 1297.76 and the move under this MA by the 50 DMA provided a death cross for the chart a couple of weeks ago. The 100 DMA at 1298.60 is in danger of following suit.
Gold Has Gained Some Momentum
Gold showing some strong bull signal
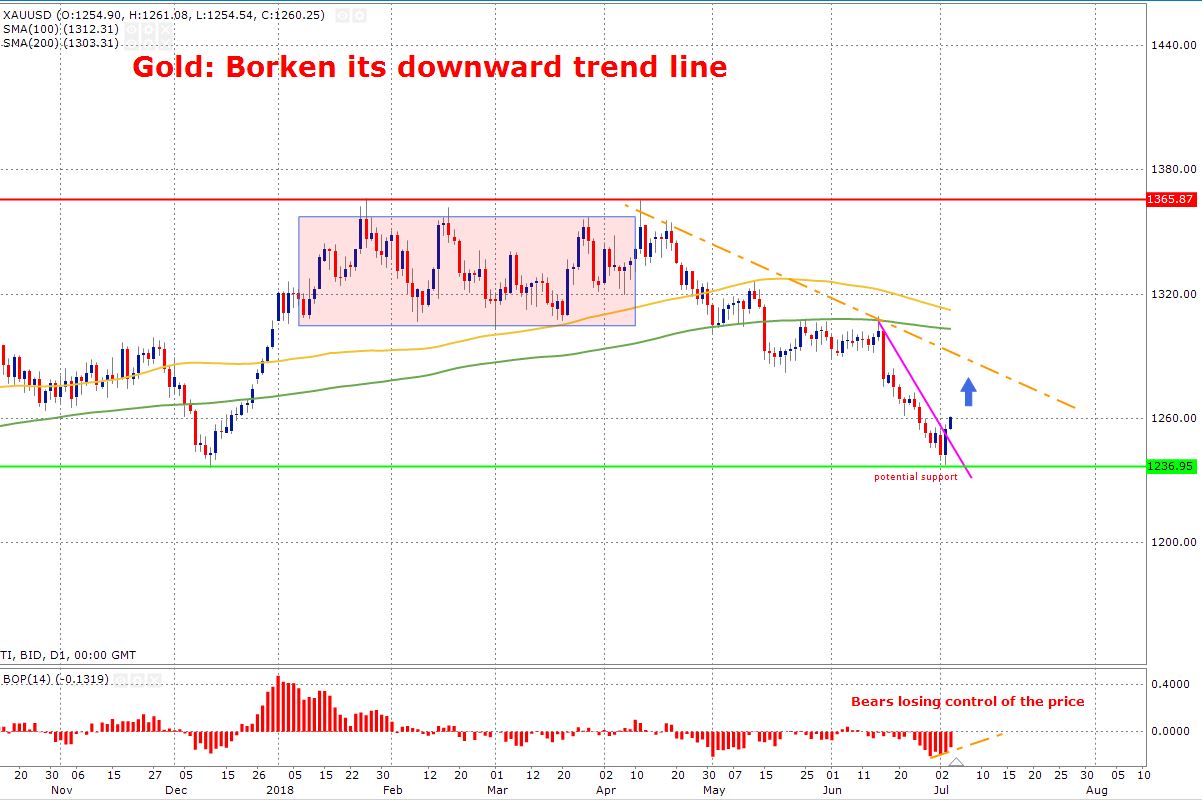
Bargain hunters have stepped into the market and this is supporting the price of gold. The precious metal is in demand to some extent as the dollar index has retraced from its highs. The softening of the dollar index is definitely an important element, and this softness is mainly due to some weakness in the economic data. From a technical perspective, if the support of 1250 holds, the odds would be strongly stacked for a move which could lead the price to 1300 mark. Between now and the end of the week, we think the US Non-Farm-Payroll data has the most importance and any weakness in this number, would take more steam out of the dollar index. The weaker dollar would push the price of the metal even higher.
In terms of techncial analysis, the price has broken its downward trend and would enourage a move to test the second downdward trend line. Only a break of that would lead the price to test its moving 200 & 100 day (green and yellow respectively) moving averages.
Expect Lower Volume Today | Euro Trading Boring While Sterling Breaks Out
- Lack of US session would impact trading volume
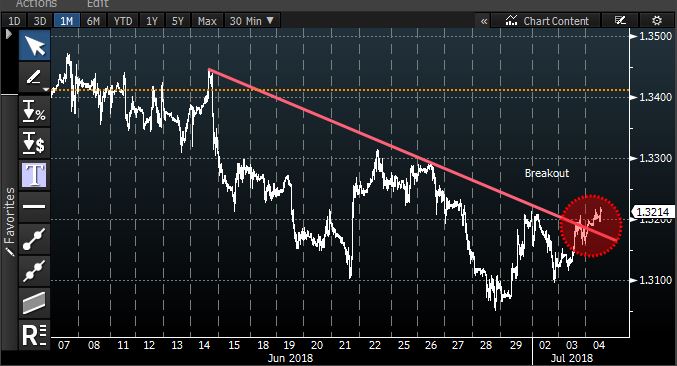
- Euro trades in a sideway pattern while sterling breaks its downward trend line
Investors over in the US are going to appreciate their public holiday and traders over in the U.K. may still be in the celebration mode after England’s clinical finish in a football match yesterday. The overall volume in the market would remain subsided due to the lack of trading participation from the US side.
Wall Street finished lower yesterday as the trade war saga continues to dampen the investor appetite. Having said this, investors over in Europe are feeling much calmer given that Merkel has avoided a political disaster and agreed on the immigration deal. However, the scepticism remains and the question is; if the current deal will hold?
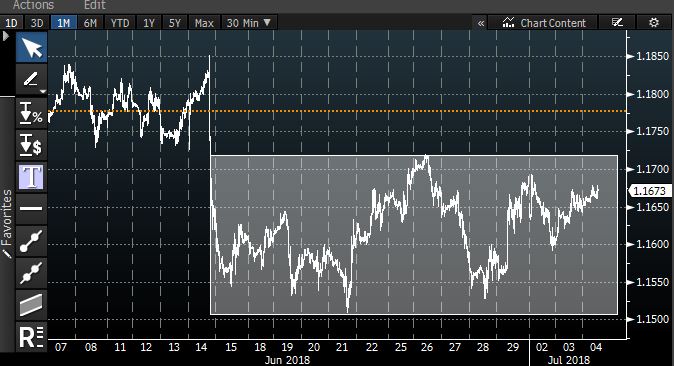
On the data front, investors would like to see more encouraging signs. The services PMI data for France, Spain, Italy and Europe is due and it would likely move the needle for the euro-dollar pair. In terms of range, the price is very much consolidating between 1.15 to 1.17 since mid June. we need to break out of this zone, to form a trading range.
Bank in the UK, Theresa May faces a fresh showdown and her pro-Brexit colleagues are pushing her to support the agenda that the UK would be closely tied to EU rules for trading goods after Brexit. May, on the other hand, would prefer to have a mutual understanding of regulations, a task which is easier to think than implement, rather than following EU rules. By looking at the sterling-dollar pair, the price has broken its downward trend and this could be start of a new trend.
EUR/USD – Euro Edges Lower, Services PMIs Climb
EUR/USD has posted slight gains in the Wednesday session, erasing the losses seen on Tuesday. Currently, the pair is trading at 1.1636, down 0.20% on the day. On the release front, the focus is on services indicators. German Services PMI improved to 54.5, beating the estimate of 53.9. Eurozone Services PMI rose to 55.2, above the forecast of 55.o points. U.S banks and stock markets are closed for the Fourth of July, so we’re unlikely to see much movement from EUR/USD. On Thursday, Germany releases Factory Orders. The U.S will release key employment data and the FOMC will release the minutes of the June policy meeting.
Investors are keeping an eye on the FOMC minutes from the June meeting, which will be published on Thursday. The minutes could be a market-mover, as the Federal Reserve raised rates at the meeting for the second time this year. How many more hikes will we see in 2018? Policymakers appear split between three and four moves, as the U.S economy is booming, but the threat from escalating trade tensions has the Fed concerned. Investors will be looking for clues from the minutes as to Fed monetary policy in the second half of 2018.
German and eurozone manufacturing PMIs in June pointed to expansion. However, the indicators also continued a troubling downward trend, as the both PMIs have dropped for six straight months, raising concerns among investors about the strength of the eurozone economy. Recent trade tensions are threatening to hamper the eurozone export sector, which in turn could weigh on manufacturing output. This has put the spotlight on German and eurozone manufacturing PMIs, which are bellwethers of the strength of the manufacturing sector. Germany, the locomotive of the eurozone, produced soft consumer numbers last week. Retail Sales plunged 2.1%, its steepest decline in 2018. As well, Preliminary CPI fell to 0.1%, down from 0.5% a month earlier.
GBP/USD: UK Service PMI
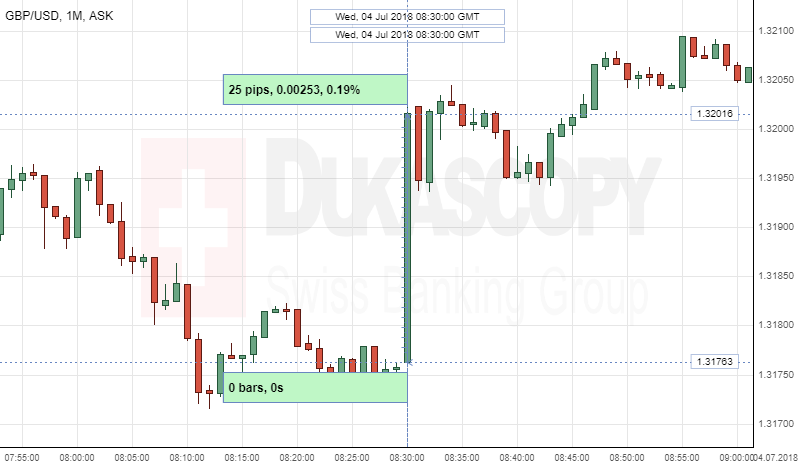
The British Pound strengthened against the Greenback, following the UK Service PMI data release on Wednesday at 08:30 GMT. The GBP/USD currency pair gained 25 pips, or 0.19%, to continue fluctuating in the 1.3209 area.
The Markit released the monthly UK Purchasing Managers' Index data that came out better-than-expected of 55.1, and also better from the previous period.
A currency analyst at TorFX Laura Parsons stands: "A combination of better-than-forecast UK construction data and worse-than-expected Eurozone retail sales figures kept the GBP/EUR exchange rate steady on Tuesday,"
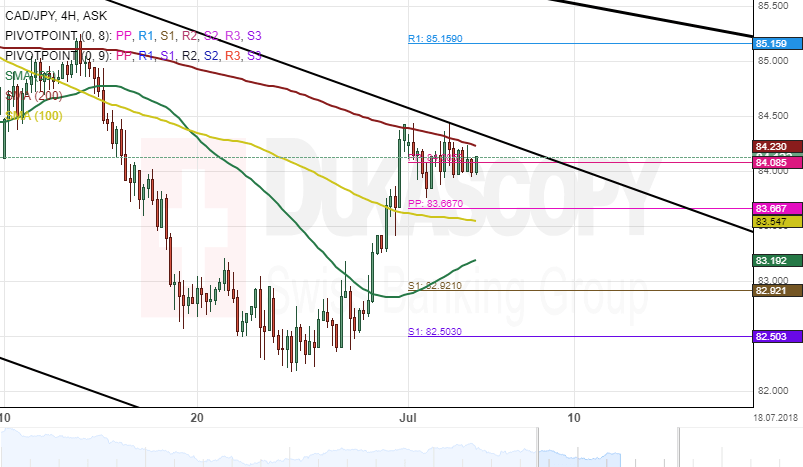
CAD/JPY 4H Chart: Bullish Movement
Bullish momentum dominated the CAD/JPY currency pair last week and thus sent the pair to breach the previously drawn pattern. As a result, the rate gained 201 base points or 2.44%.
Given that the exchange rate broke the previous channel, a new junior pattern has been mapped to monitor the price movement. Furthermore, the 200-hour simple moving average was providing strong resistance near the 84.24 mark.
As for near future, the Canadian Dollar is likely to continue trading in the channel down against the Japanese Yen during the following trading sessions. The currency exchange rate could decline further south to test either the 100-hour or 55-hour SMAs within the next hours.
CHF/JPY 4H Chart: Poised To Rally
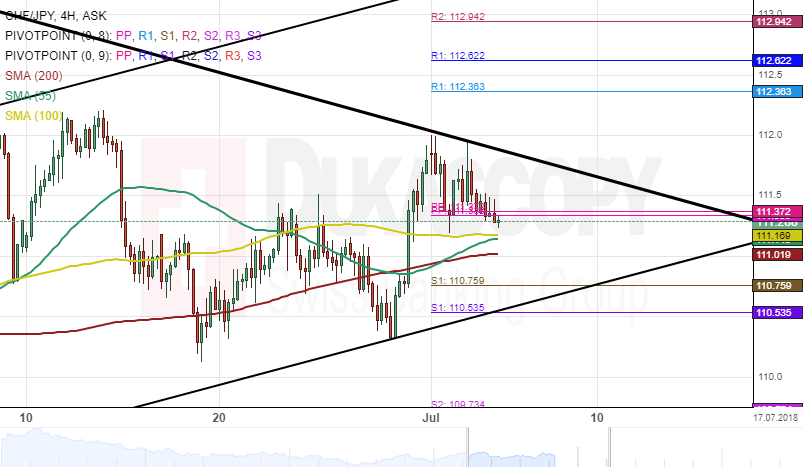
The price movement of the CHF/JPY currency pair has been constrained by a junior ascending pattern. The pair bounced off its lower boundary on May 8 and has since rallied.
The exchange rate could continue appreciating within the following trading sessions in line with the junior pattern. The pair is likely going to breach the upper boundary of a dominant descending channel in the short term. At the time of this analysis, a combined support set by the weekly and the monthly PPS near the 111.37 regions was providing support for the pair.
In the meantime, technical indicators flash strong buy signals. This suggests that bulls dominance over the rate is likely to grow stronger.