Sample Category Title
GBP/USD Shows Potential Inverted Head & Shoulders Pattern
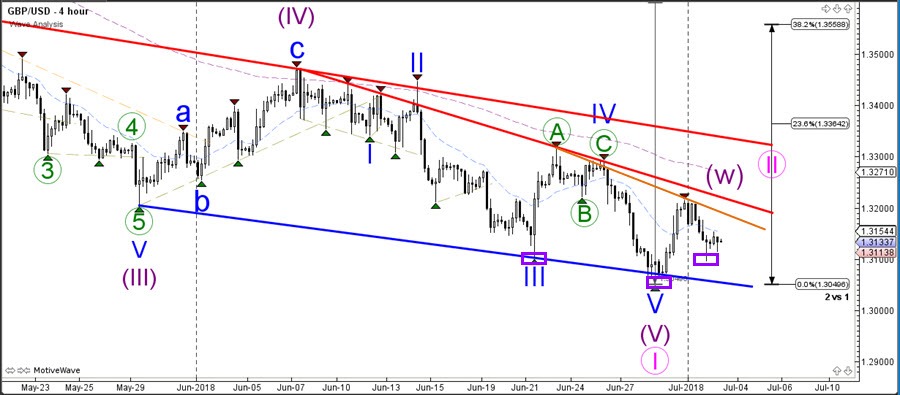
The GBP/USD could be building an inverted head and shoulders reversal chart pattern (purple boxes) if price manages to break above the neck line (orange). The downtrend channel is still active and a bearish continuation is still on the table.
The GBP/USD will either needs to break below the key support levels, which are represented by the purple and blue lines, or above the key resistance trend lines (red) before a clear direction is known. For the moment, a bullish reversal seems more likely to me due to the inverted H&S pattern and falling wedge chart pattern
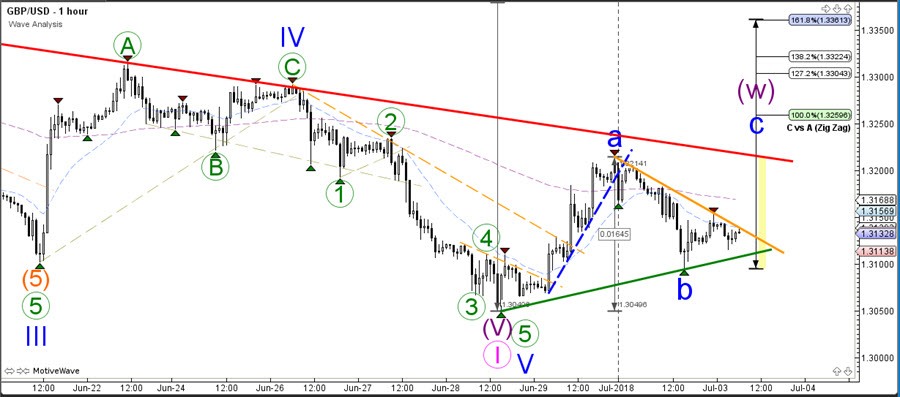
The GBP/USD could be building a bullish ABC zigzag (blue) if price manages to break above the resistance trend lines. A break below the green support trend line could indicate a larger downtrend, rather than a bullish correction.
RBA Maintains Key Interest Rate Unchanged For A 23rd Consecutive Month
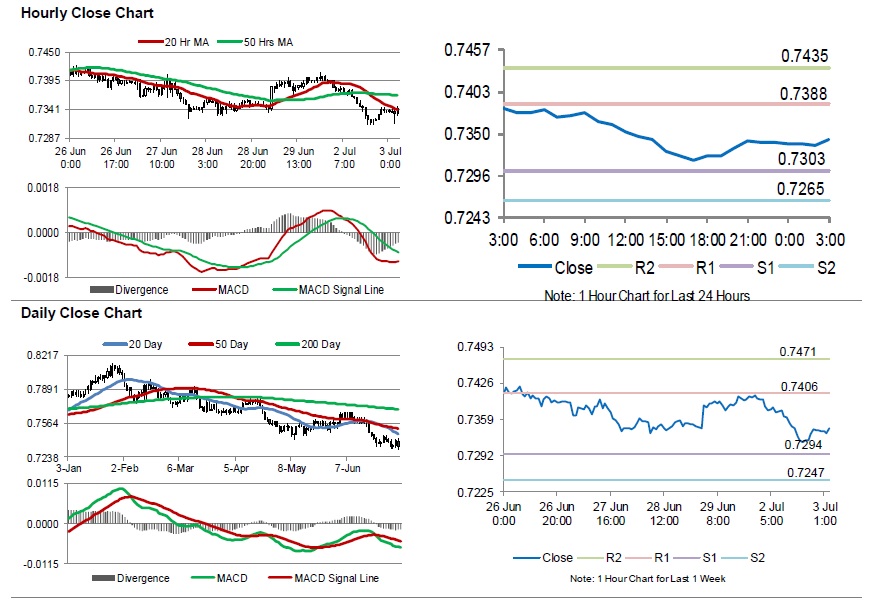
For the 24 hours to 23:00 GMT, the AUD declined 0.76% against the USD and closed at 0.7339.
LME Copper prices declined 0.8% or $51.0/MT to $6595.0/MT. Aluminium prices declined 1.4% or $30.0/MT to $2153.0/MT.
In the Asian session, at GMT0300, the pair is trading at 0.7342, with the AUD trading marginally higher against the USD from yesterday’s close.
Overnight data indicated that Australia’s seasonally adjusted building approvals surprisingly dropped to 3.2% on a monthly basis in May, compared to a revised fall of 5.6% in the previous month. Market participants had envisaged the building approvals to record a flat reading.
Earlier today, the Reserve Bank of Australia (RBA), at its June rate decision, opted to keep the benchmark interest rate steady at 1.50%, as widely expected. Meanwhile, RBA Governor, Philip Lowe highlighted optimism over the jobs market and signalled “solid” employment growth in the future.
The pair is expected to find support at 0.7303, and a fall through could take it to the next support level of 0.7265. The pair is expected to find its first resistance at 0.7388, and a rise through could take it to the next resistance level of 0.7435.
Trading trend in the Aussie will be determined by Australia’s trade balance figures and retail sales data, both for May, due to be released overnight. Also, the AiG performance of service index for June, will keep investors on their toes.
The currency pair is showing convergence with its 20 Hr moving average and trading below its 50 Hr moving average.
Euro-Zone’s Manufacturing Activity Eased To An 18-Month Low Level In June
For the 24 hours to 23:00 GMT, the EUR declined 0.16% against the USD and closed at 1.1640, amid political uncertainty in Germany concerning the migration policy.
Macroeconomic data revealed that Euro-zone's final Markit manufacturing PMI dropped to an 18-month low level of 54.9 in June, compared to a reading of 55.5 in the previous month. Market participants had anticipated the PMI to fall to 55.0. The preliminary figures had indicated a decline to 55.0. Moreover, the region's unemployment rate fell to a nine-year low level of 8.4% in May, compared to 8.5% in the prior month.
Meanwhile, Germany's final manufacturing PMI eased to a level of 55.9 in June, in line with market expectations and confirming the preliminary print. In the prior month, PMI had registered a reading of 56.9.
In the US, data showed that final Markit manufacturing PMI eased to a level of 55.4 in June, compared to a reading of 56.6 in the prior month. Further, the nation's construction spending advanced 0.4% on a monthly basis in May, less than market expectations. In the previous month, construction spending had recorded a revised rise of 0.9%. The ISM manufacturing activity index unexpectedly climbed to a level of 60.20 in June, compared to a level of 58.70 in the prior month.
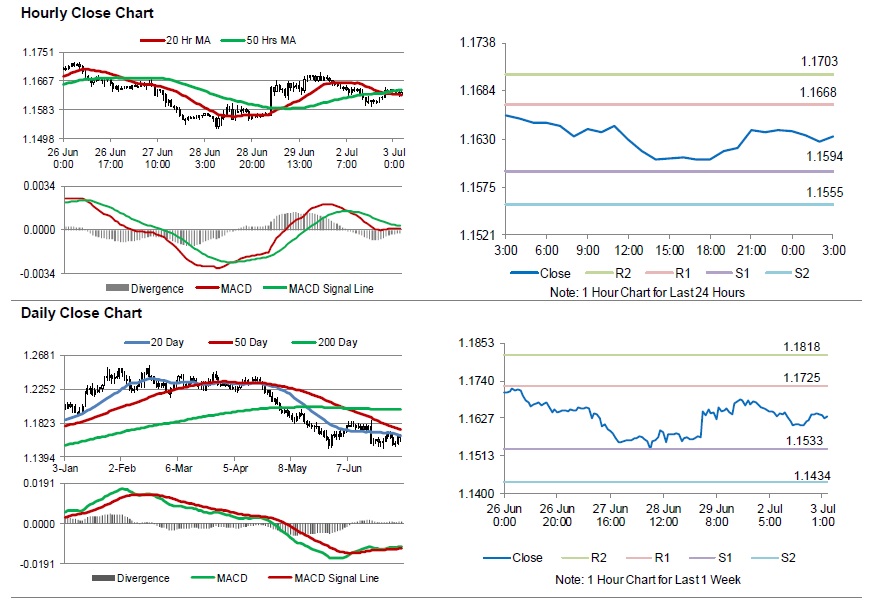
In the Asian session, at GMT0300, the pair is trading at 1.1632, with the EUR trading 0.07% lower against the USD from yesterday's close.
The pair is expected to find support at 1.1594, and a fall through could take it to the next support level of 1.1555. The pair is expected to find its first resistance at 1.1668, and a rise through could take it to the next resistance level of 1.1703.
Moving ahead, investors would closely monitor Euro-zone's retail sales data and producer price index, both for May, due to be released in a few hours. Later in the day, the US factory orders and flash durable goods orders, both for May, will pique significant amount of investor attention.
The currency pair is showing convergence with its 20 Hr and 50 Hr moving averages.
Britain’s Manufacturing PMI Surprisingly Increased In June
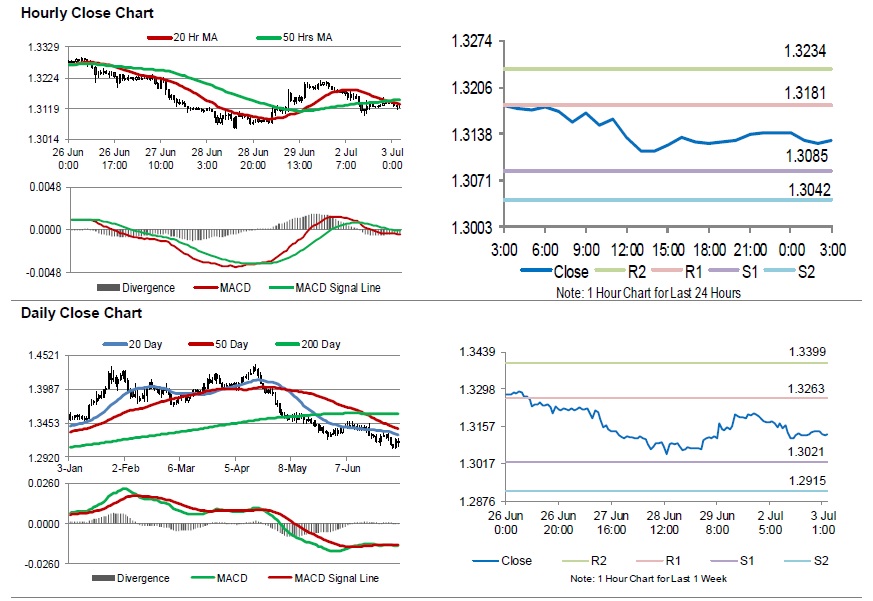
For the 24 hours to 23:00 GMT, the GBP declined 0.34% against the USD and closed at 1.3141.
On the data front, UK's Markit manufacturing PMI unexpectedly rose to a level of 54.4 in June, defying market expectations for a fall to a level of 54.0. The PMI had registered a revised level of 54.3 in the prior month.
In the Asian session, at GMT0300, the pair is trading at 1.3128, with the GBP trading 0.10% lower against the USD from yesterday's close.
The pair is expected to find support at 1.3085, and a fall through could take it to the next support level of 1.3042. The pair is expected to find its first resistance at 1.3181, and a rise through could take it to the next resistance level of 1.3234.
Looking forward, investors would keep an eye on the UK's Markit construction PMI for June, set to release in a few hours.
The currency pair is showing convergence with its 20 Hr moving average and trading below its 50 Hr moving average.
Has China Given Green light to Renminbi Selloff?
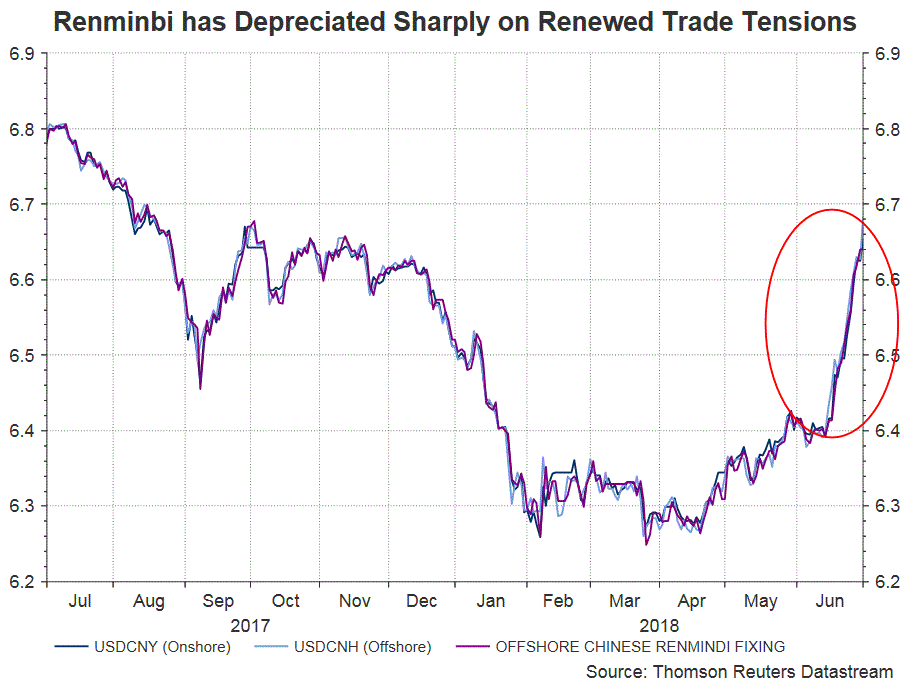
Weakness in renminbi has accelerated recently, driven by Donald Trump’s new list of tariff against China announced in mid-June, PBOC’s RRR cut and the jump in risk aversion over the Chinese market. USDCNY’s rally of more than +4% over the past two weeks has raised speculations about China’s retaliation against the US-induced trade tensions. It has also recalled the massive capital outflow in China after the authority’s currency reform in August 2015. While we agree that China might have intentionally allowed its currency to depreciate of late, excessive currency weakness would exacerbate China’s problem, especially during the current time of growth slowdown, elevated debt levels and stock market crash. The Chinese government is cautiously monitoring the situation so that renminbi depreciation would not trigger the capital flight like the one happened three years ago.
Renewed Concerns over US-China Trade War
Concerns over a trade war were calmed temporarily as US and Chinese official held talks in May, culminating into a joint statement suggesting that both sides agreed to “substantially reduce US trade deficit with China”, and to put tariffs on hold. However, Trump, shortly following the US-North Korea summit in Singapore, announced on June 15 the plan to impose 25% additional tariffs on Chinese goods worth of US$ 50B. The first round of tariff, effective July 6 and involving US$ 34B worth of Chinese goods, covers nuclear reactors, electrical machinery, railway equipment, vehicles, aircraft and parts, ships, medical devices, and rubber, while the remaining US$ 16B of goods covers semiconductors, chemicals, glass, iron or steel, aluminum, machinery and plastics, etc. China responded by reciprocating tariff on US goods worth of US$ 50B. First round of tariff, also effective July 6 and involving US$ 34B worth of Chinese goods, covers soybeans, seafood, pork, chicken, and autos, etc, while the second round covers coal, crude oil, gas, medical devices and chemicals, worth US$ 16B in total.
China Refrains from Allowing Excessive Renminbi Selloff
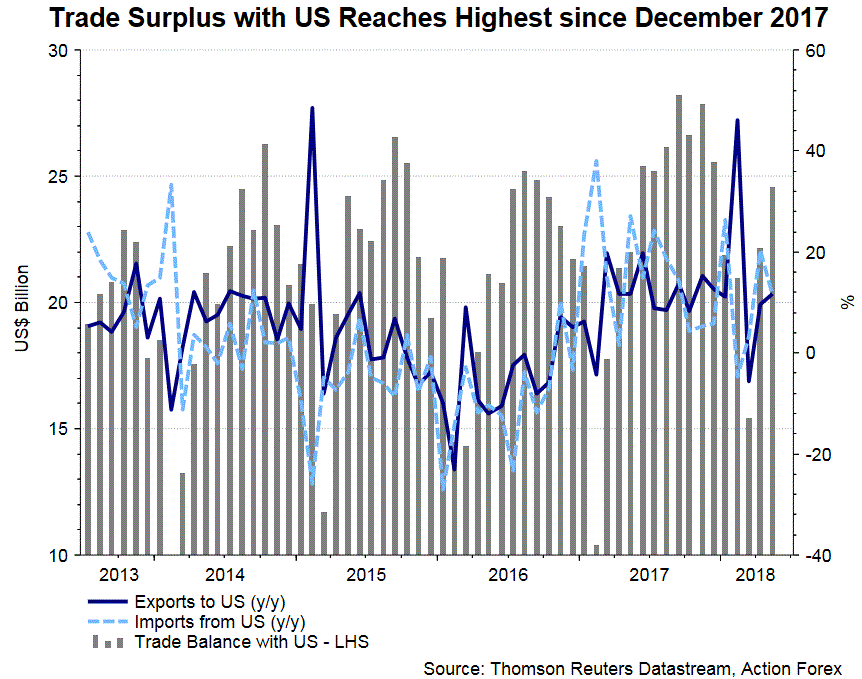
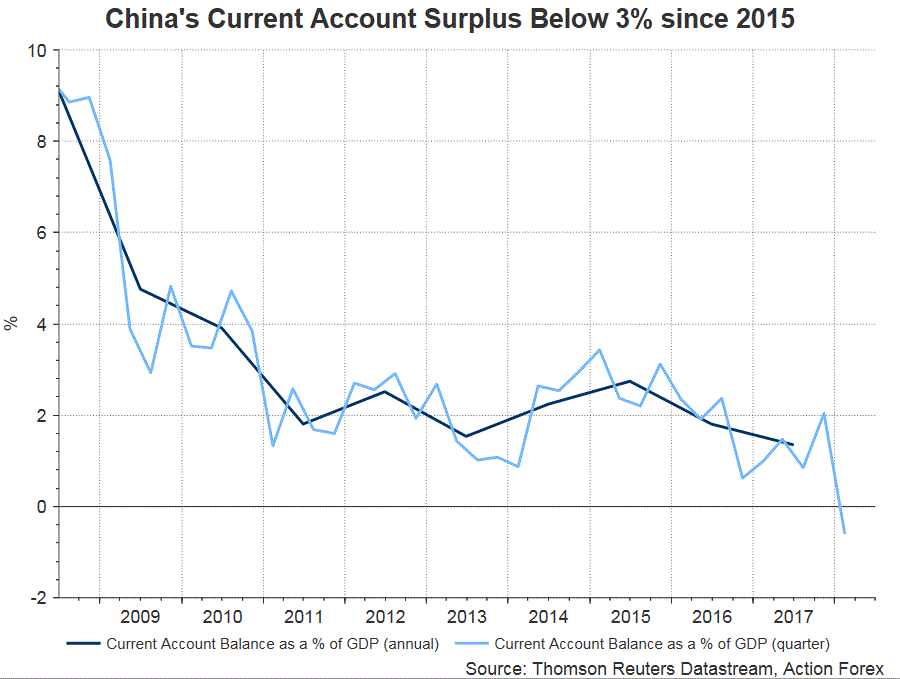
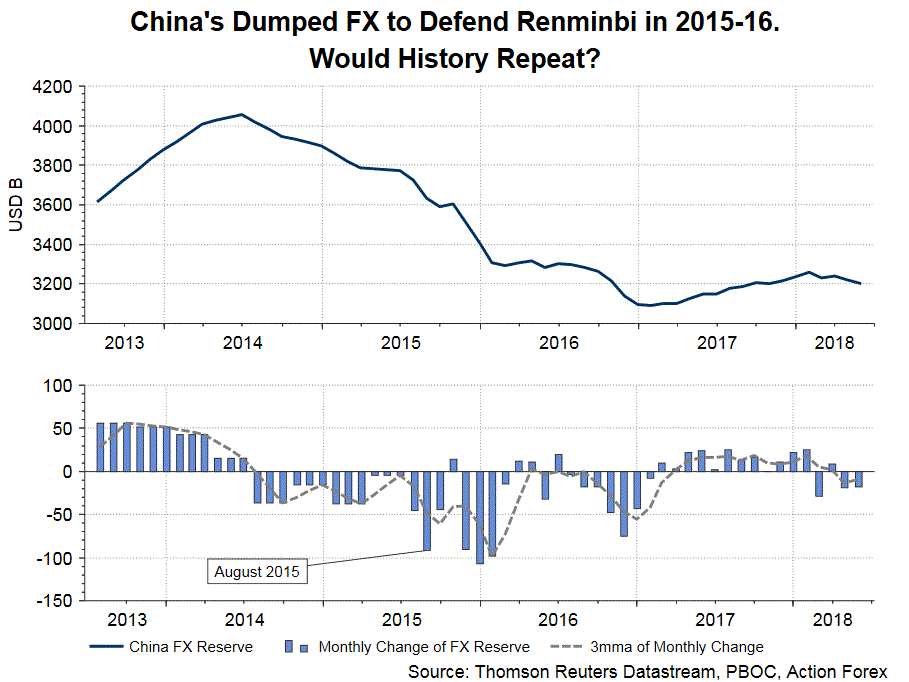
Renewed trade tensions have caused renminbi to weaken sharply. The speed of the selloff has even raise suspicions that the Chinese government has manipulated currency as a policy tool. Indeed, the aggressive USDCNY fixing appears to have lent credit to such speculations. A weaker currency could help a country’s exporters. Moreover, it could help export-oriented economy such as China. In the 90s, the US Treasury labeled China a currency manipulator amidst the latter’s aggressive depreciation of renminbi to boost exports. Back then, China had met the US criteria of currency manipulation of 1) having a significant trade surplus with the US (over US$ 20B); 2) having a material current account surplus of over 3% of GDP and 3) conducting persistent and one-sided purchases of foreign currency over a 12-month period. However, over the past few years, although China is still having significant trade surplus with the US, its current account surplus as a percentage of GDP has shrunk remarkably. Moreover, it has refrained from repeated purchase of foreign currencies so as to weaken renminbi. In order to defend renminbi and prevent capital outflow, PBOC had sold foreign currencies aggressively in 2015 and 2016. This suggests that, while China enjoys the benefit of weak currency on its exports, it is cautious over excessive selloff of renminbi as this might roil market confidence and trigger massive capital outflow.
But Comfortably Rides on Recent USD Strength
We believe the recent renminbi weakness is helped by the broadly based USD strength, thanks to a more hawkish Fed and the resilient US dataflow. US dollar index (DXY) on June 21 rallied to the then one-year high 95.53 which was briefly breached on June 28. We believe much of USD’s strength during the period was against the euro. Indeed, EURUSD recorded an intraday selloff of -1.9% on June 14 and retested a one-year low on June 20. That said, the greenback also strengthened against major currencies due to monetary policy divergence (i.e. Fed funds rate to rise further while other major central banks are keeping their policy rates at, or near, record lows. The broadly based strength in US dollar has provided an environment for Chinese officials to let its currency depreciate more “reasonably”.
Japanese Yen Trading A Tad Lower In The Asian Session
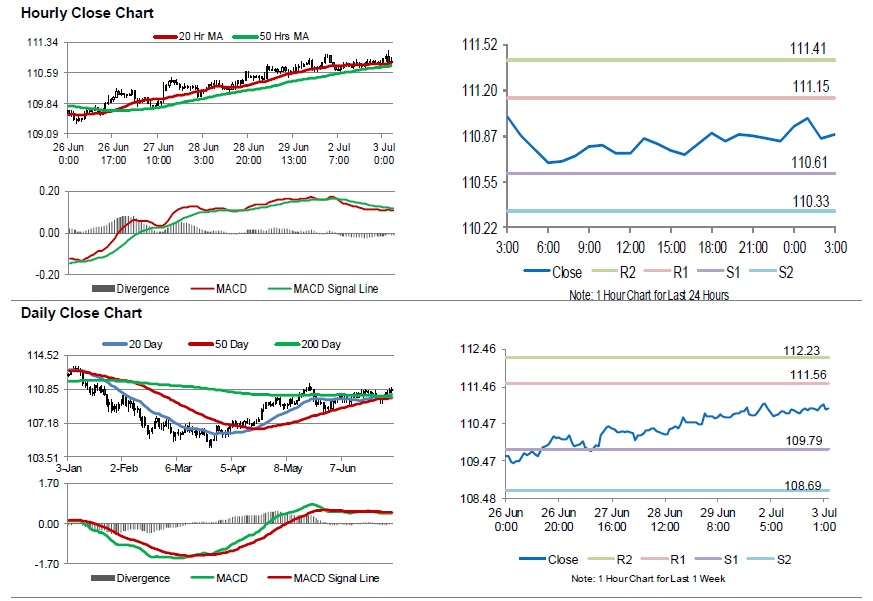
For the 24 hours to 23:00 GMT, the USD declined 0.13% against the JPY and closed at 110.84.
In the Asian session, at GMT0300, the pair is trading at 110.88, with the USD trading slightly higher against the JPY from yesterday’s close.
The pair is expected to find support at 110.61, and a fall through could take it to the next support level of 110.33. The pair is expected to find its first resistance at 111.15, and a rise through could take it to the next resistance level of 111.41.
Going ahead, investors would await Japan’s Nikkei services PMI for June, scheduled to release overnight.
The currency pair is showing convergence with its 20 Hr moving average and trading above its 50 Hr moving average.
Swiss Retail Sales Unexpectedly Falls In May
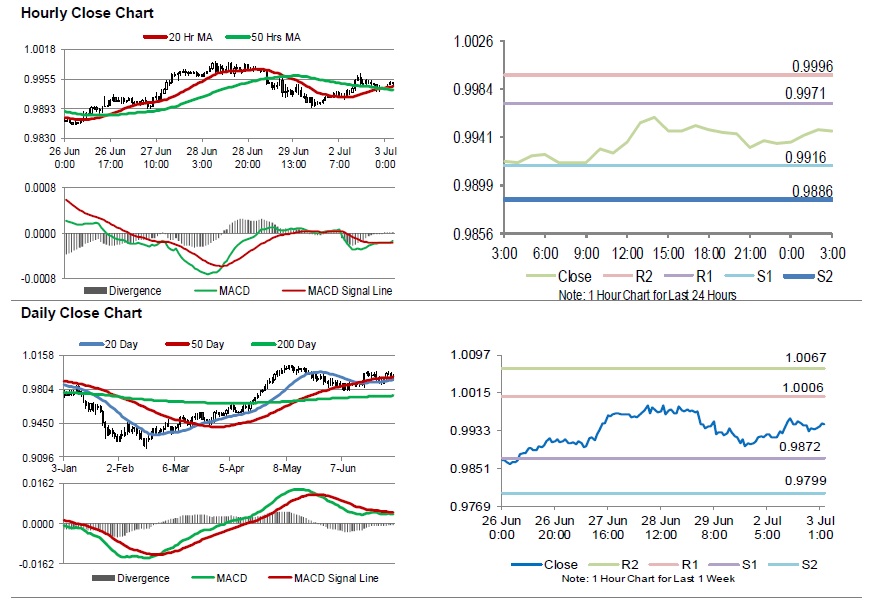
For the 24 hours to 23:00 GMT, the USD rose 0.17% against the CHF and closed at 0.9935.
The Swiss Franc declined against the dollar, after Switzerland’s real retail sales unexpectedly fell 0.1% on an annual basis in May, defying market anticipation to register a rise of 1.4%. In the previous month, the retail sales had recorded a revised rise of 2.9%. Further, the nation’s SVME manufacturing PMI slid to a level of 61.6 in June, less than market expectations for a drop to a level of 61.0. In the previous month, the PMI had recorded a reading of 62.4.
Additionally, Switzerland’s total sight deposits eased to a level of CHF576.4 billion in the week ended 01 June, from CHF576.7 billion in the previous week.
In the Asian session, at GMT0300, the pair is trading at 0.9946, with the USD trading 0.11% higher against the CHF from yesterday’s close.
The pair is expected to find support at 0.9916, and a fall through could take it to the next support level of 0.9886. The pair is expected to find its first resistance at 0.9971, and a rise through could take it to the next resistance level of 0.9996.
With no macroeconomic releases in Switzerland today, investors would look forward to global macroeconomic factors for further direction.
The currency pair is showing convergence with its 20 Hr moving average and trading above its 50 Hr moving average.
Loonie Extends Its Losses In The Morning Session
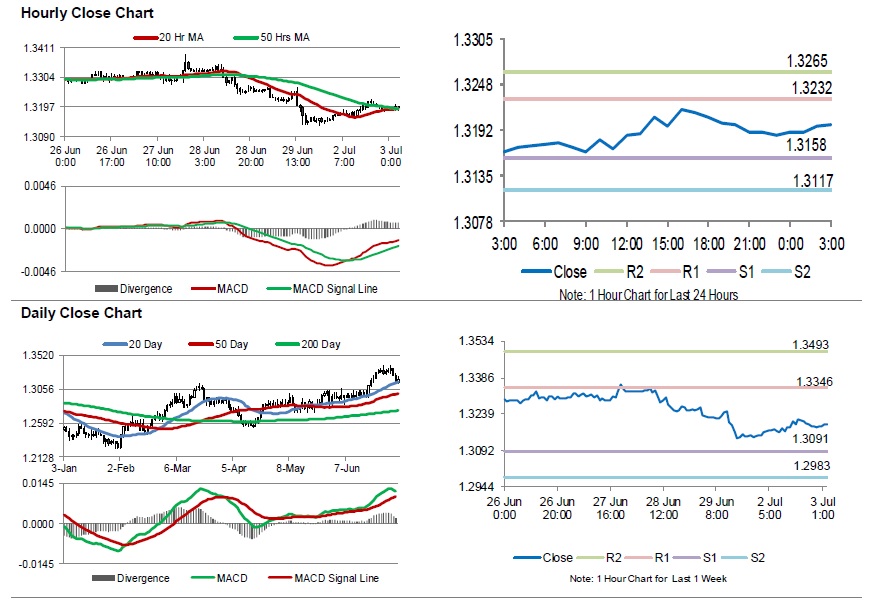
For the 24 hours to 23:00 GMT, the USD rose 0.26% against the CAD and closed at 1.3186.
In the Asian session, at GMT0300, the pair is trading at 1.3198, with the USD trading 0.09% higher against the CAD from yesterday’s close.
The pair is expected to find support at 1.3158, and a fall through could take it to the next support level of 1.3117. The pair is expected to find its first resistance at 1.3232, and a rise through could take it to the next resistance level of 1.3265.
Going ahead, traders would look forward to Canada’s manufacturing PMI for June, slated to release later in the day.
The currency pair is showing convergence with its 20 Hr and 50 Hr moving averages.
Gold: Yellow Metal Trading On Weaker Footing In The Asian Session
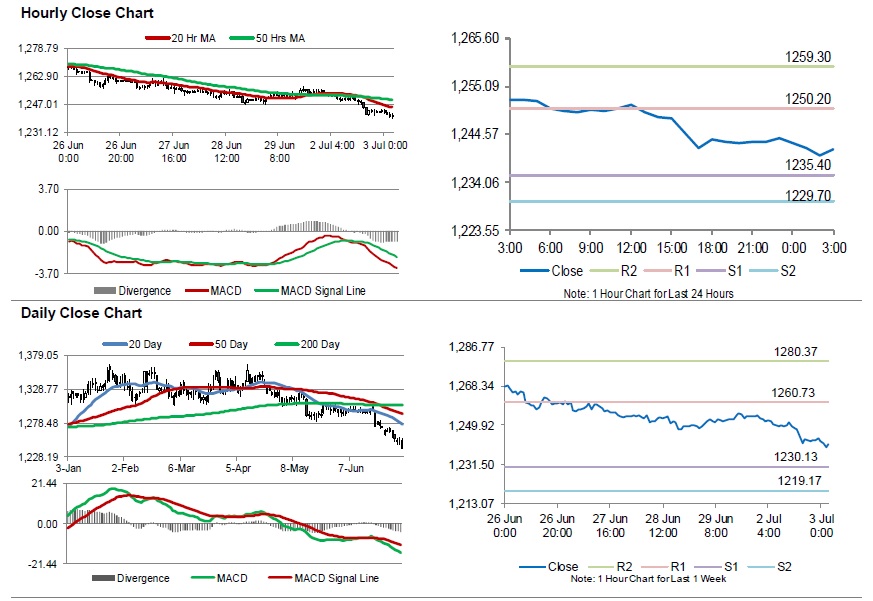
For the 24 hours to 23:00 GMT, Gold declined 0.78% against the USD and closed at USD 1242.80 per ounce, as strength in US dollar and US equities, dented demand for the safe haven asset.
In the Asian session, at GMT0300, the pair is trading at 1241.10, with gold trading 0.14% lower against the USD from yesterday’s close.
The pair is expected to find support at 1235.40, and a fall through could take it to the next support level of 1229.70. The pair is expected to find its first resistance at 1250.20, and a rise through could take it to the next resistance level of 1259.30.
The yellow metal is trading below its 20 Hr and 50 Hr moving averages.
Silver: White Metal Extends Its Losses In The Morning Session
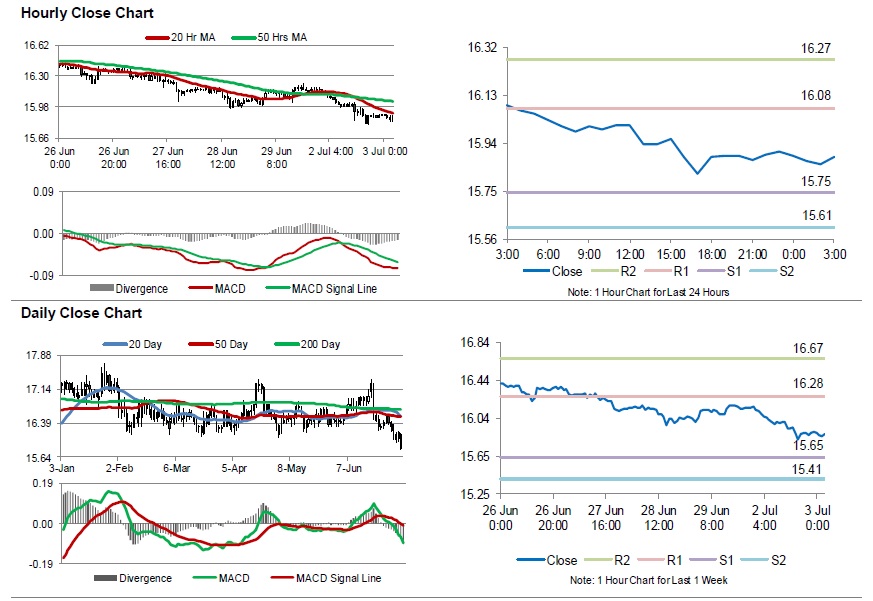
For the 24 hours to 23:00 GMT, Silver declined 1.36% against the USD and closed at USD15.91 per ounce, tracking losses in gold prices.
In the Asian session, at GMT0300, the pair is trading at 15.89, with silver trading 0.13% lower against the USD from yesterday’s close.
The pair is expected to find support at 15.75, and a fall through could take it to the next support level of 15.61. The pair is expected to find its first resistance at 16.08, and a rise through could take it to the next resistance level of 16.27.
The white metal is trading below its 20 Hr and 50 Hr moving averages.