Sample Category Title
Forex Analysis: US 30 And USDJPY
The US 30 index has broken out of its bull flag on Monday and extended higher into resistance at 25240.00 today. There are a lot of conflicting stories that the market is choosing to ignore such as trade tension and forward guidance against beats on earnings and better economic data. The breakout was retested on Tuesday with the spike lower. This bull flag was unusual in that it was taken as a parallel from the lower two touches and projected higher. Nevertheless the opportunity was taken and price pushed over 24861.80 which was also retested to further confirm the bullish stance. Targets overhead now come in at 25500.00 and 25820.00 with the 26000.00 level above and the high from January at 26700.00.
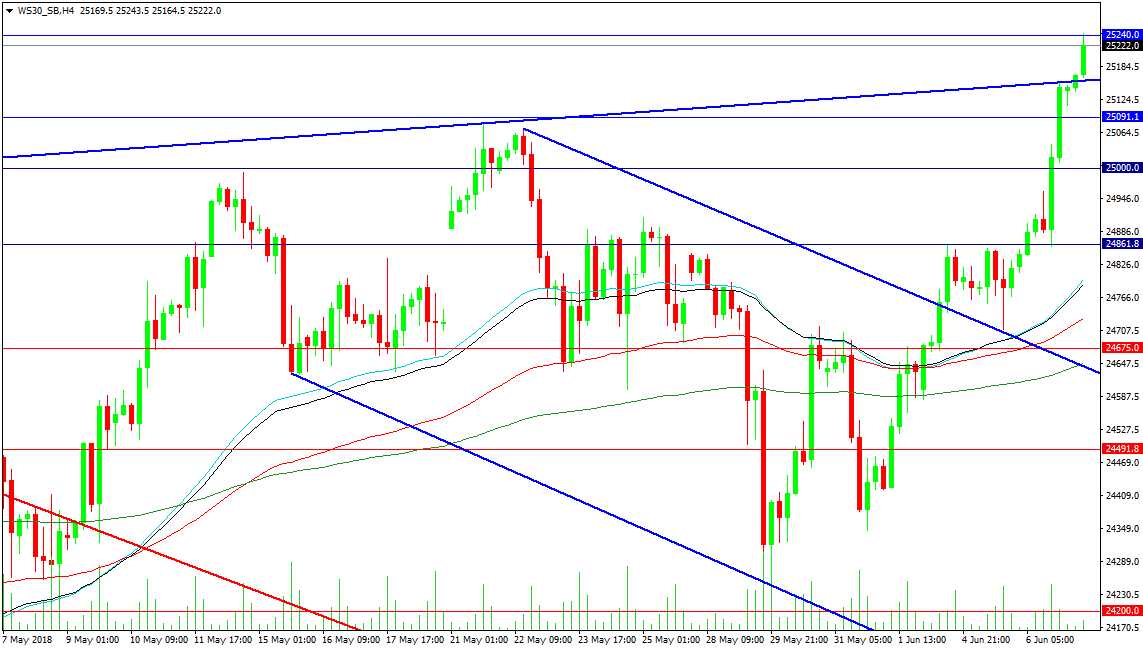
Support comes from the rising blue trend line at 25158.00 at present and it is likely that this area will be retested soon. It may also result in a retest of 25000.00 as support with a move under this area potentially signalling a failure to rally and resulting in a continued consolidation phase. The moving averages are in the zone from 24800.00 down to 24650.00 on the 4 hour time frame and buyers can be found in this area. A loss of 24625.00 and the falling trend line could result in a more aggressive pullback and a drop towards 24000.00.
USDJPY
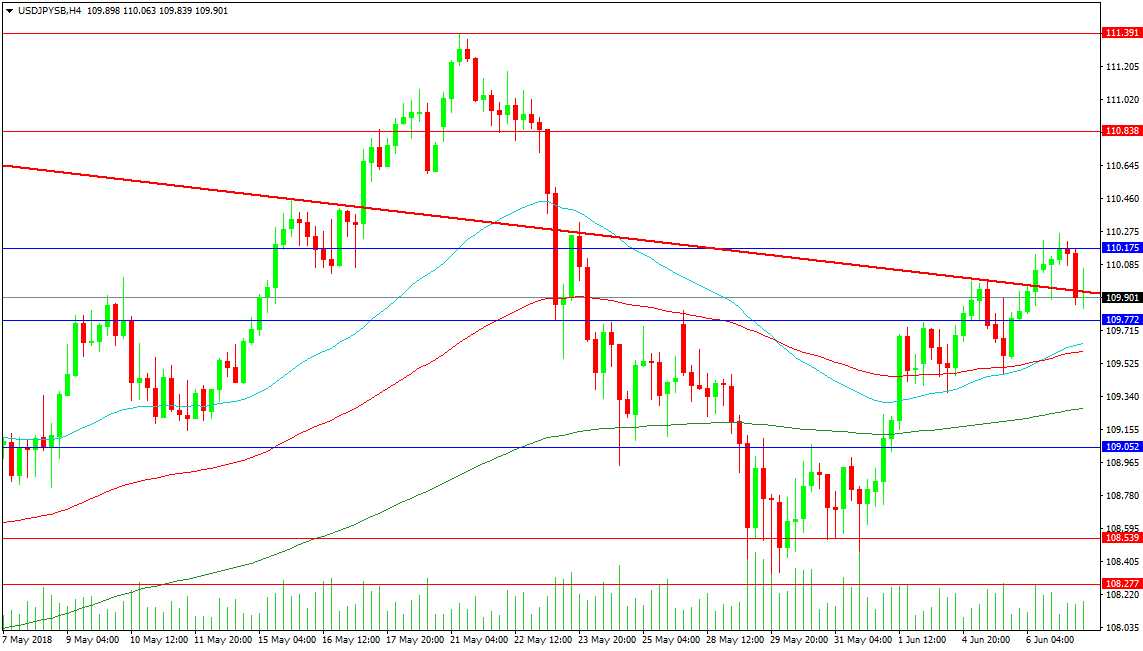
The USDJPY pair is struggling with the 110.000 level at present and after making excellent progress yesterday it has slipped back under the level and the red trend line. The high from 111.391 remains the first significant target to the upside with 112.000 in extension. A break above 110.350 can see the pair advance rapidly to 110.838 but the current battle for 110.000 will have to be resolved first.
NZDUSD Remains Below The Upper Bollinger Band But Indicators Suggest Further Gains
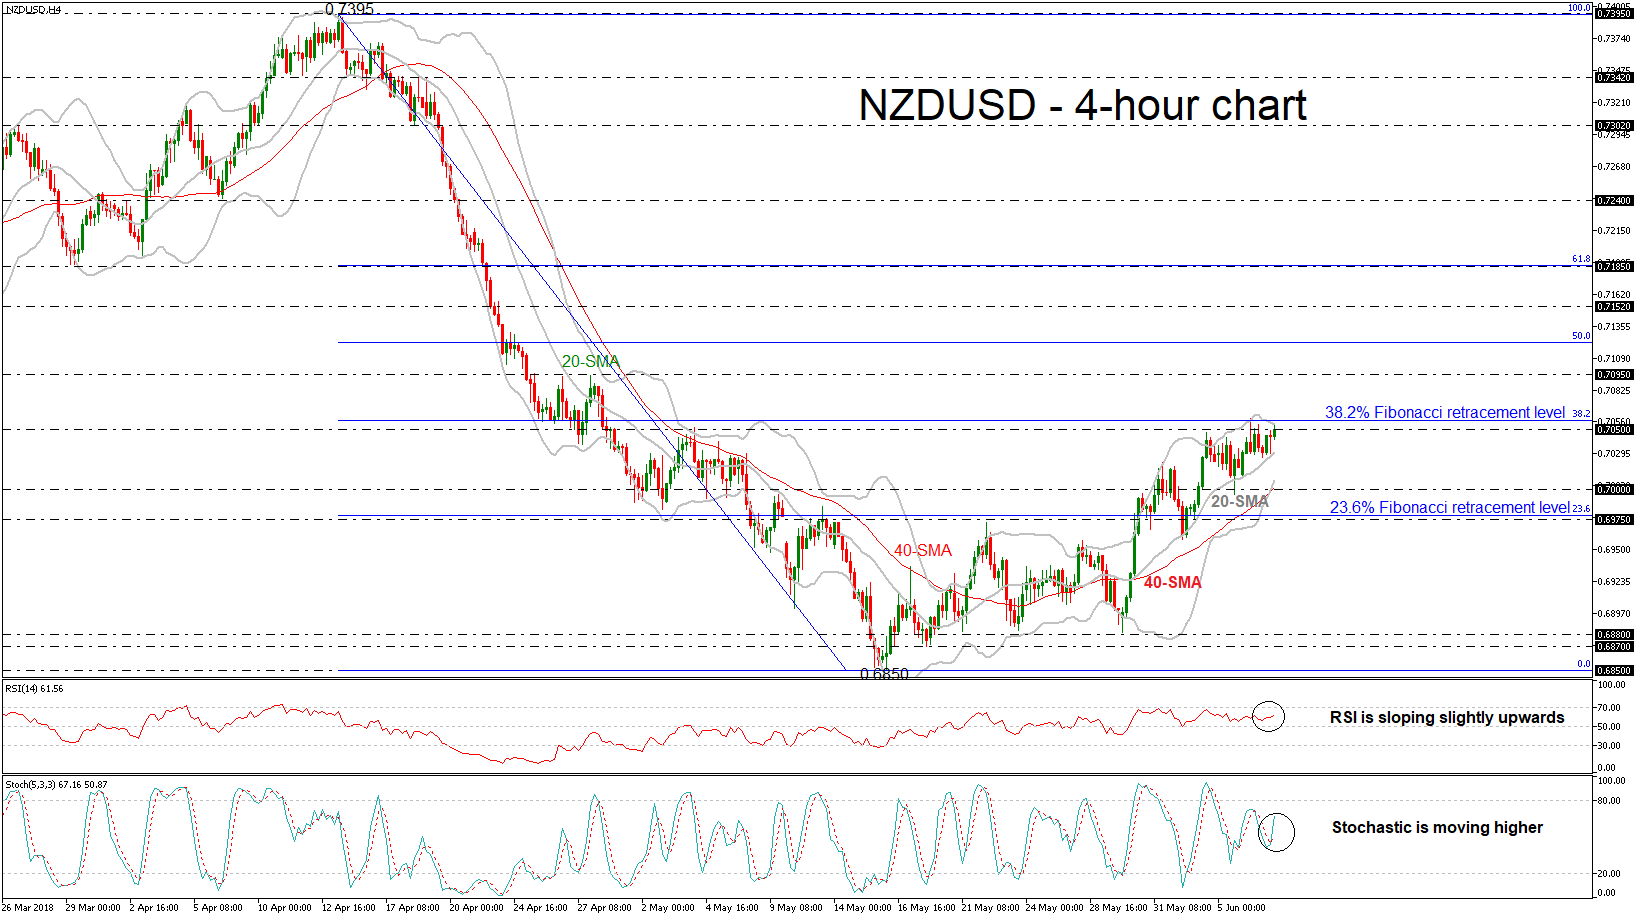
NZDUSD has struggled below the 0.7050 strong resistance level and touched the upper Bollinger Band, which stands near the 38.2% Fibonacci retracement level of the downleg from 0.7395 to 0.6850. However, the technical indicators are sending bullish signals, suggesting that the bullish correction will continue.
From the technical point of view, in the 4-hour chart, the RSI indicator is moving slightly higher, indicating that the market could strengthen in the short-term as it is approaching the 70 area. The stochastic oscillator supports a bullish picture as well since the index continues to increase positive momentum.
If the market manages to pick up speed above the 0.7050 barrier, then the 0.7095 hurdle could offer nearby resistance. A leg above this significant resistance could be found at the 50.0% Fibonacci of 0.7120.
However, should prices decline, immediate support could be found at the 0.7000 handle, near the latest low. A drop below the aforementioned obstacles could open the door for the 23.6% Fibonacci which stands near the 0.6975 level.
In the bigger picture, it is worth mentioning that NZDUSD has jumped above the 20- and 40-day SMAs signaling further gains.
XAUUSD Intraday Analysis
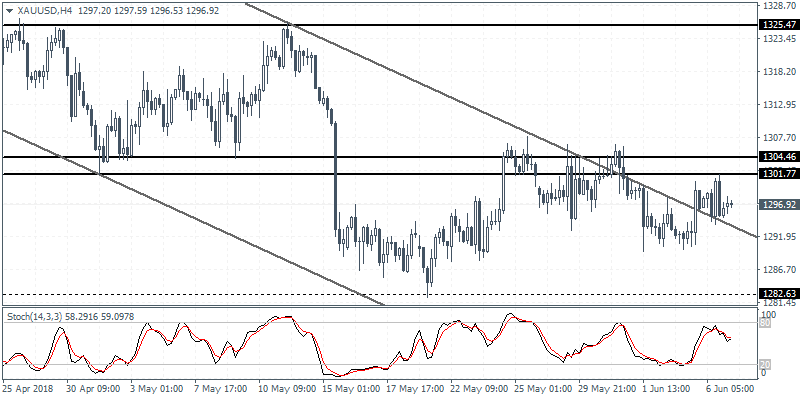
XAUUSD (1296.92): Gold prices continue to post the consolidation below the 1304 - 1301 level of resistance. Price action managed to break the outer trend line of the falling price channel. We expect the consolidation to continue but there could be a strong chance that the precious metal could breach the resistance level. A breakout above 1304 could signal gold prices rallying higher toward the 1325 level of resistance. To the downside, failure to break the resistance level could keep gold prices hovering lower toward the 1282 support.
USDJPY Intraday Analysis
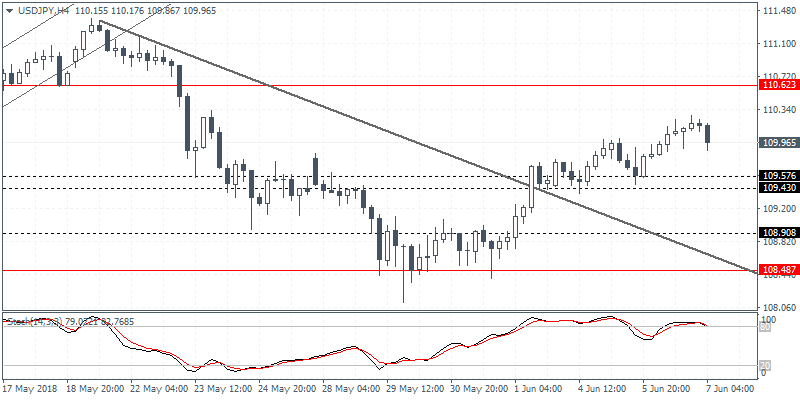
USDJPY (109.96): The USDJPY currency pair attempted to rise to highs near 110.26 before the U.S. dollar gave up some of the gains. We expect the minor declines to push the currency pair back to the 109.57 - 109.43 level of support which was previously tested. As long as the support holds, USDJPY could be seen targeting the next main resistance of 110.62. However, in the event that the currency pair fails to hold the support level, further declines could push USDJPY lower toward 108.90.
EURUSD Intraday Analysis
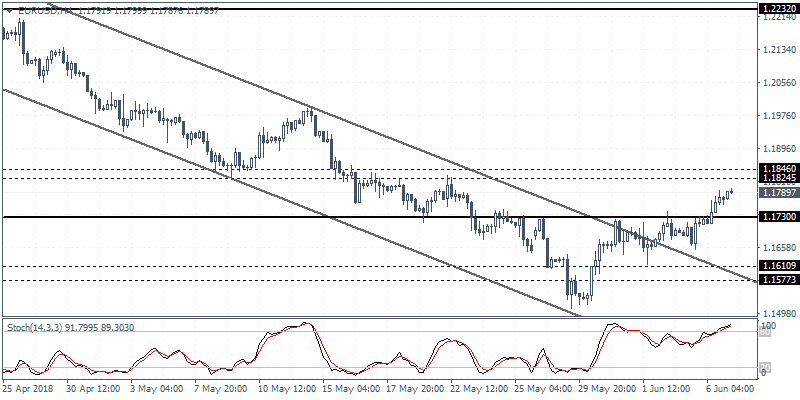
EURUSD (1.1789): The EURUSD currency pair was posting gains on Wednesday as price action breached the resistance level of 1.1730. The currency pair is on track to test the next main resistance level at 1.1846 - 1.1824 level. However, we expect to see a pullback in price action as the breached resistance level of 1.1730 is likely to be established as support. A rebound off the 1.1730 level could signal the start of a recovery in the EURUSD currency pair. However, a breakout above 1.1846 is needed in order to confirm the upside toward 1.2232 resistance level.
Eurozone Revised GDP To Remain Unchanged
The U.S. dollar was seen easing back from the gains on Wednesday with not much of data. Australian GDP was seen rising 1.0% which was better than the expected print of 0.9%. The fourth quarter GDP data was also seen revised slightly higher to 0.5%.
Swiss inflation report was seen rising 0.4% which was higher than the forecasts of 0.3% and showed acceleration from 0.2%. Data from Canada showed that building permits fell 4.6%. This was higher than the forecasts of a 1.0% decline. The previous month's data was revised down to 1.3%.
In the U.S. the revised nonfarm productivity was seen rising 0.4% on the quarter.
Looking ahead, the Eurozone GDP figures will be released. The revised GDP numbers are expected to show 0.4% on the quarter, unchanged from the previous estimate.
Later in the day, the BoC Gov. Poloz is expected to speak.
WTI Oil Outlook – Outlook Remains Negative But Consolidation Above Daily Cloud Base Could Extend
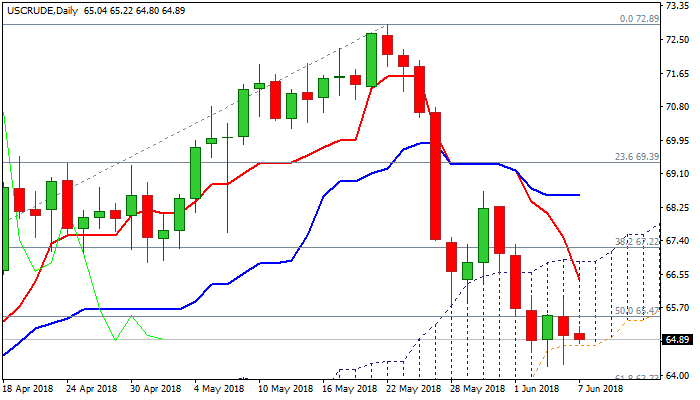
WTI oil price remains in red on Thursday and holds near two-month lows ($64.21/26) but downside attempts were so far contained by the base of rising daily Ichimoku cloud ($64.74).
Cloud base acts as strong support as spikes in past two days probed below cloud base but repeatedly failed to close below.
Concerns over rising US production keep the oil price under pressure, which was increased on surprise rise of US oil inventories.
EIA report, released on Wednesday, showed build of crude stocks by 2.07 million barrels as expectations were for 2 million barrels draw, following strong fall in crude inventories by 3.62 million barrels previous week.
Technical studies are bearish and add to negative near-term outlook as bearish momentum continues to strengthen and daily MA’s created multiple bear-crosses.
The action of past two days remains capped by broken 100SMA ($65.32), while falling 10SMA tracks the fall since 24 May.
Further consolidation above cloud base could be likely near-term scenario before bears resume. The notion is supported by reversal of slow stochastic from the oversold territory.
Extended upticks above 100SMA should be capped by falling 10SMA ($66.21) to keep bears intact.
Eventual break and close below rising daily cloud would signal bearish continuation and expose target at $63.73 (Fibo 61.8% of $58.06/$72.89 upleg).
Only sustained break above daily cloud top ($66.88) would sideline bears and signal stronger correction.
Res: 65.32, 65.95, 66.21, 66.88
Sup: 64.74, 64.21, 63.73, 63.19
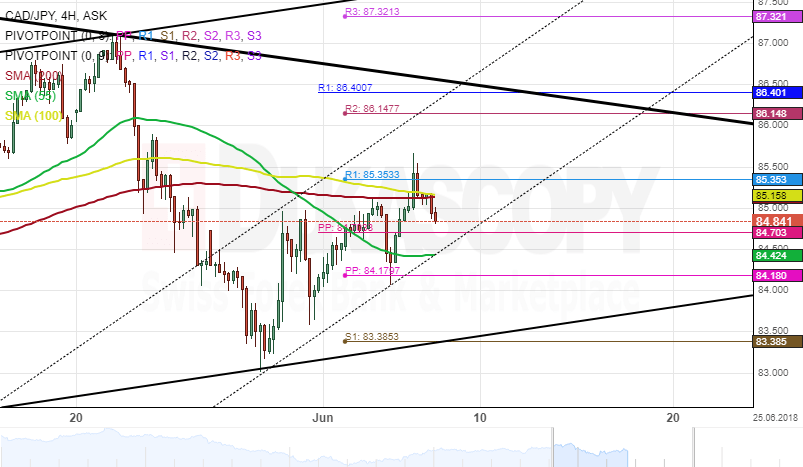
CAD/JPY 4H Chart: New Channel Spotted
The Canadian Dollar bounced off the bottom boundary of a junior ascending channel against the Japanese Yen at the end of May. As a result, the currency pair has formed a new channel up.
This ascending pattern has already managed to move past two significant resistance level. Namely, the 55-hour simple moving average and the weekly pivot point at 84.17. However, after the exchange rate pierced the 100– and 200– hour SMAs at 85.16 it made a U-turn south.
Everything being equal, it is likely that the CAD/JPY currency exchange rate continues to maintain the newly formed channel until it breached the upper boundary of a descending channel.
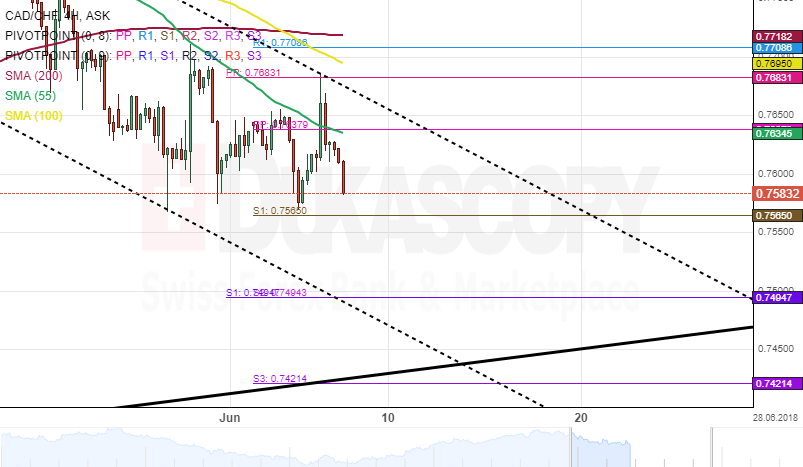
CAD/CHF 4H Chart: Likely To Edge Lower
Following a reversal from the upper boundary of a dominant ascending channel on May 18, The Canadian Dollar began a new journey south against the Japanese Yen.
This movement could be considered a retracement down from the senior ascending pattern. Furthermore, after the currency pair hit the monthly pivot point at 0.76, the pair continues its decline.
Technical indicators provide strong buy signals for the remainder of this week. However, base on the setting of the CAD/CHF currency exchange rate, the analyst thinks the bullish momentum might not come into play during the next 48 hours. Bears could target 0.75 or 0.74 which is the weekly and monthly PPs
USD/CAD: Canadian Trade Balance
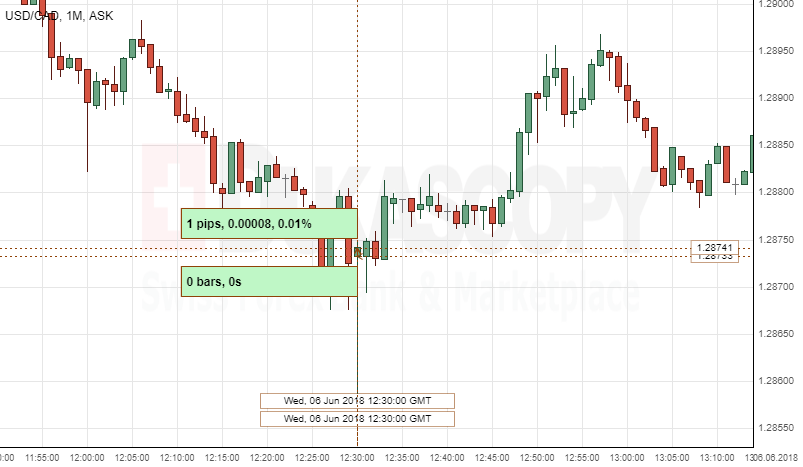
The Canadian Dollar weakened against the Greenback, following Canadian Trade Balance data release on Wednesday. The USD/CAD currency pair gained only one pip, or 0.01%, to continue fluctuating in the 1.2875 area.
The Statistics Canada released International Merchandise Trade data that came out better-than-expected of negative 1.9B, compared to the negative 4.1B in the previous period.
"Today's trade data suggest that net trade started Q2 as a positive contributor to GDP. The narrower-than-expected deficit has been positive for the loonie," said Royce Mendes, an economist at CIBC Capital Markets.