Sample Category Title
EUR/CHF Daily Outlook
Daily Pivots: (S1) 1.1550; (P) 1.1595; (R1) 1.1664; More....
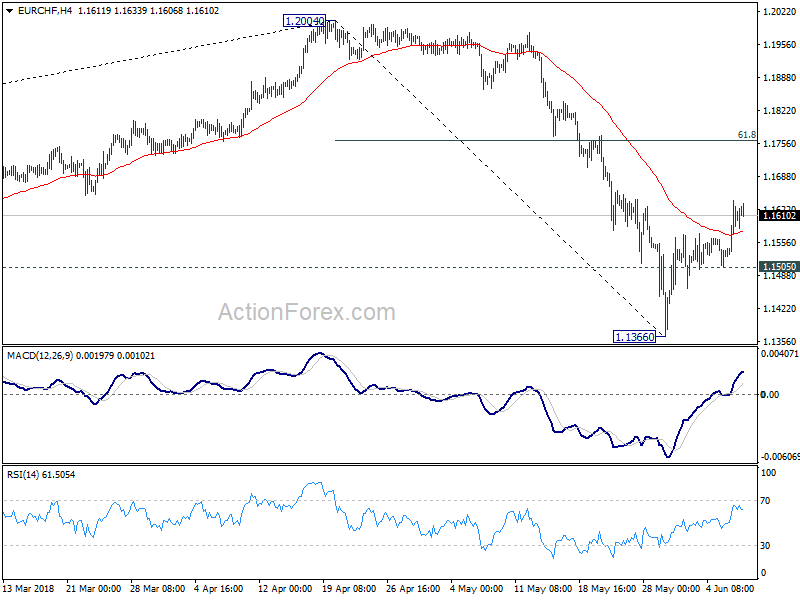
Intraday bias in EUR/CHF remains mildly on the upside for further rebound. The pull back from 1.2004 should have completed at 1.1366. Further rise would be seen for 61.8% retracement at 1.1760 and above. On the downside, break of 1.1505 support is needed to confirm completion of the rebound. Otherwise, further rally will remain mildly in favor even in case of retreat.
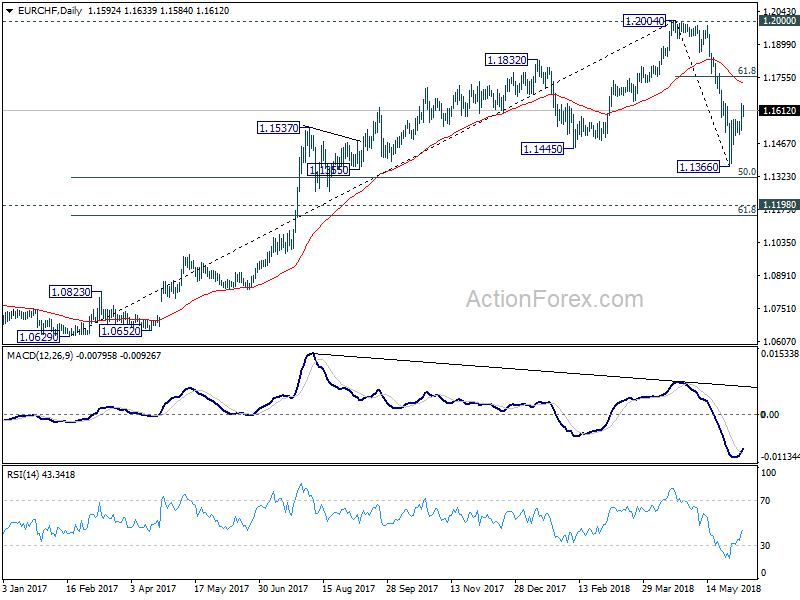
In the bigger picture, current development suggests solid rejection by prior SNB imposed floor at 1.2000. Considering bearish divergence condition in daily and weekly MACD, 1.2004 should be a medium term top. And price action from 1.2004 is correcting the up trend from 1.0629. Such correction is expected to extend for a while and therefore, we're not anticipating a break of 1.2004 in near term. Another decline cannot be ruled out yet. But in that case, strong support should be seen at 1.1198 (2016 high), 61.8% retracement of 1.0629 to 1.2004 at 1.1154 to contain downside.
GBP/USD Strong Bounce
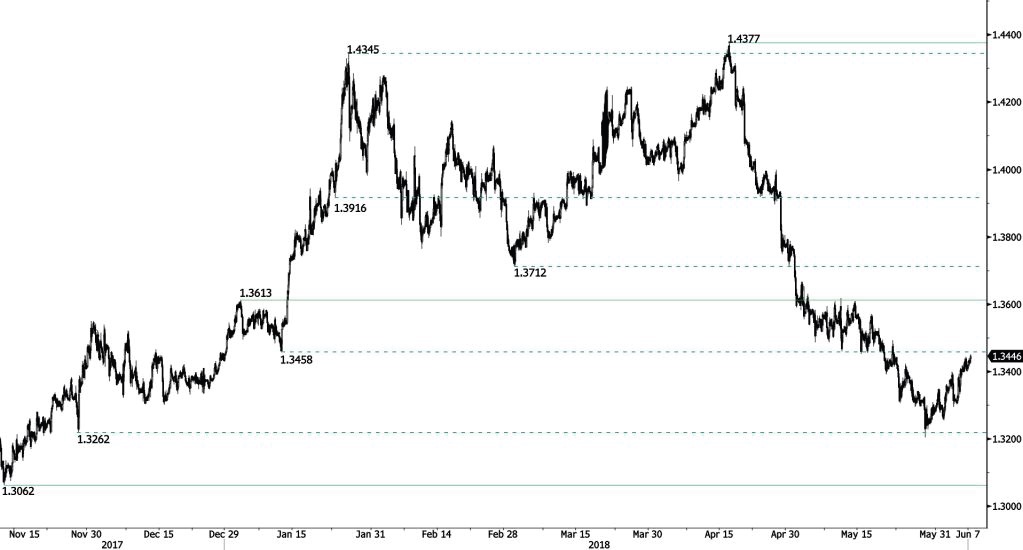
GBP/USD is increasing further, trading above 1.34 and heading towards 1.3430 resistance. The short-term bearish trend started in mid-April 2018 is maintained. Key support and resistance are given at 1.3062 (13/11/2017 low) and 1.3613 (03/01/2018 low). The technical structure suggests short-term upward moves.
The long-term technical pattern is reversing. The Brexit vote had paved the way for further decline but the pair is moving to 2016 highs. Long-term support and resistance are given at 1.1841 (07/10/2017 low) and 1.5018 (24/06/2016 high).
EUR/USD Pickup In Buying Interest
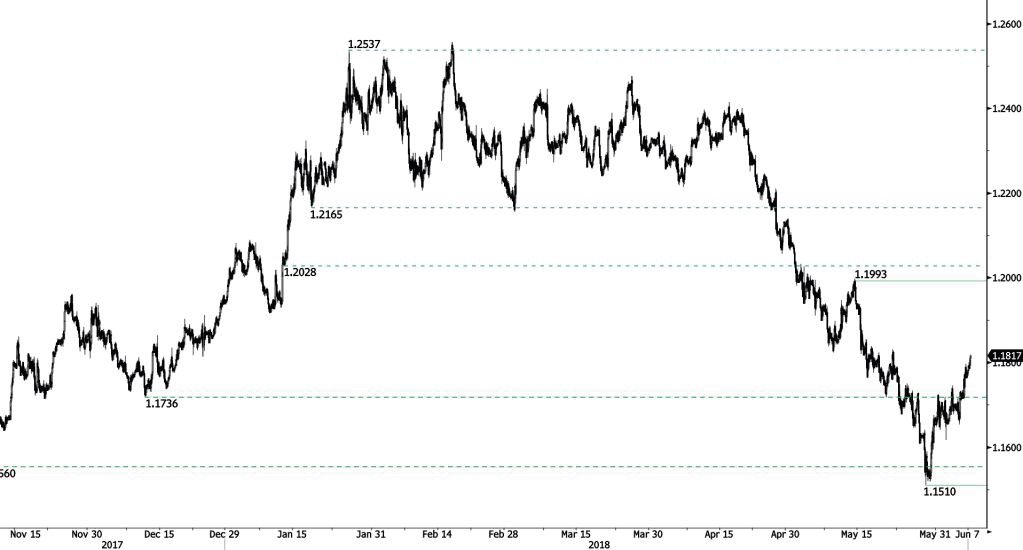
EUR/USD strong bounce resumes, the pair is trading higher, approaching the 1.1830 range. The short-term trend remains negative as long as prices remain below hourly resistance at 1.1993 (14/05/2018 high). Hourly support is given at 1.1510 (29/05/2018 low).
In the longer term, the momentum is turning largely negative. We favor a continued bearish bias. Key resistance is holding at 1.2886 (15/10/2014 high) while strong support lies at 1.0341 (03/01/2017 low).
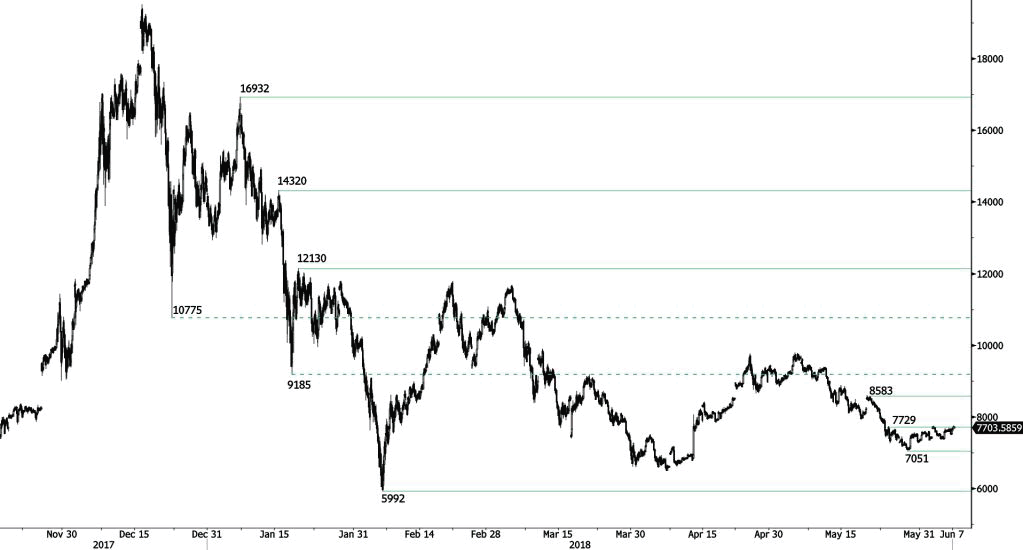
Bitcoin Sideways Range
Bitcoin continues to bounce in a sideways range. The pair is currently trading along 7600, heading along 7540. The pair is further contained between support and resistance given at 7051 (29/05/2018 low) and 8583 (21/05/2018 high). The technical structure suggests shortterm decrease.
In the long-term, the digital currency has had an exponential growth but also presented important downturns. There is decent likelihood that the currency could stabilize between 7'000 - 12'000 in 2018. Bitcoin is trading below its 200 DMA (8800 range).
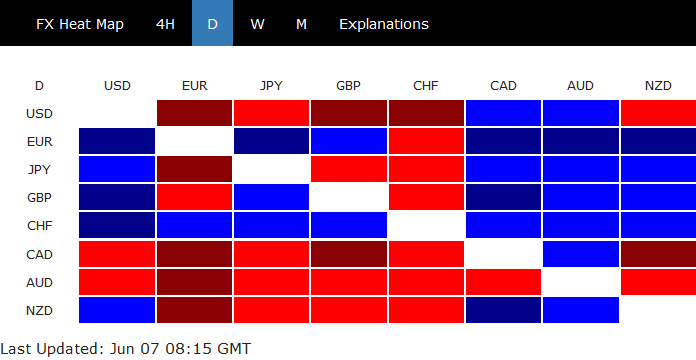
German 10 yield bund yield breaches 0.5%, takes Euro higher
European majors are trading broadly higher today as boosted by surging major benchmark yields.
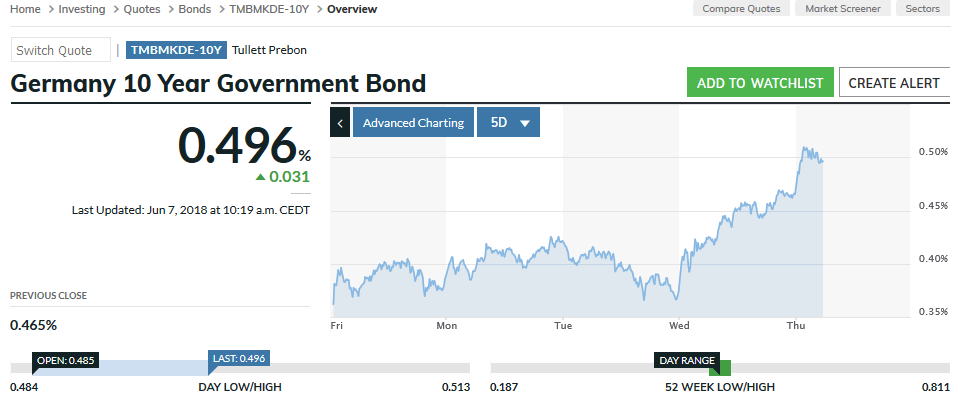
German 10 year bund yield reaches as high as 0.513 and continues to press 0.5 handle.
UK 10 year gilt yield also surges to as high as 1.421 and is trying to stay firm above 1.4.
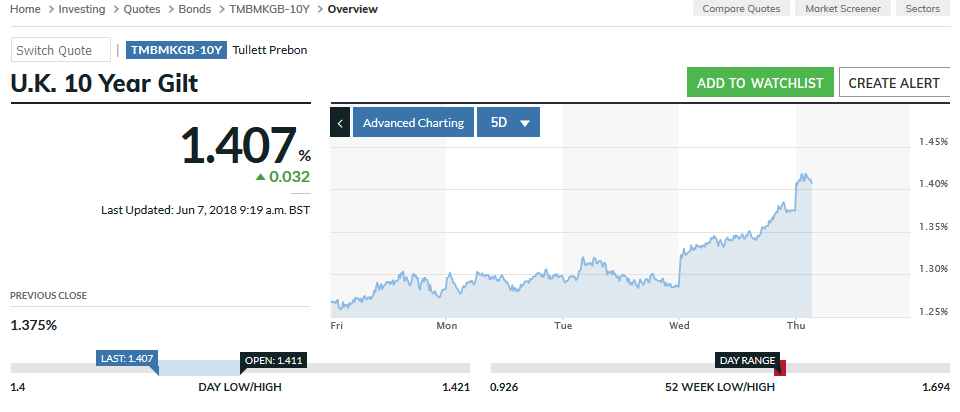
Charts from MarketWatch.
USD/JPY Progressive Zig-Zag After The Cup With Handle Breakout
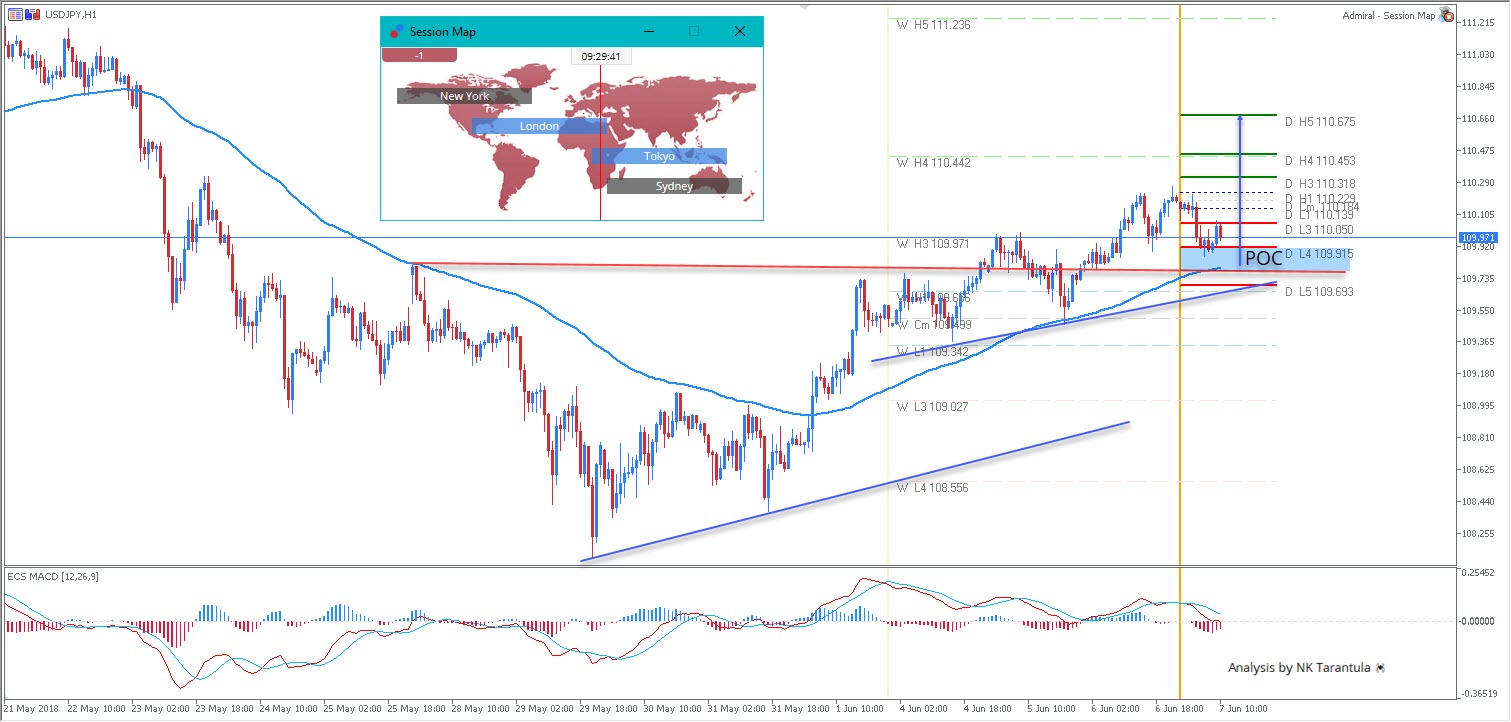
The USD/JPY has formed a bullish cup with handle pattern below the horizontal trend line (red), and at this point, we can see a valid breakout of the pattern. The breakout has formed a progressive bullish zig-zag pattern, and 109.80-90 is a possible bounce spot. If the bounce is validated, next targets should be 110.30 followed by 110.45 and 110.67.
W L3 - Weekly Camarilla Pivot (Weekly Interim Support)
W H3 - Weekly Camarilla Pivot (Weekly Interim Resistance)
W H4 - Weekly Camarilla Pivot (Strong Weekly Resistance)
D H4 - Daily Camarilla Pivot (Very Strong Daily Resistance)
D L3 – Daily Camarilla Pivot (Daily Support)
D L4 – Daily H4 Camarilla (Very Strong Daily Support)
POC - Point Of Confluence (The zone where we expect price to react aka entry zone)
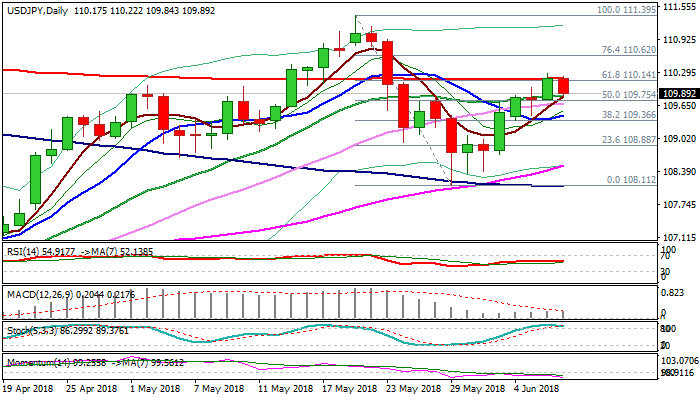
USDJPY Outlook: Extended Consolidation Likely To Precede Final Push Through 200SMA
Bulls are facing strong headwinds from 200SMA (at 110.17, reinforced by Fibo 61.8% of 111.39/108.11 bear-leg) which was cracked on Wednesday and caps today's action. Overall structure remains bullish and comfortable above broken daily Kijun-sen (109.75). Additional support comes from yesterday's 5/30SMA bull-cross and today's attempt to create 5/20cross. Final break above 200SMA would expose Fibo barrier at 110.62 (76.4% retracement) and psychological 111 barrier. On the other side, weakening momentum and overbought slow stochastic warn of further hesitation under 200SMA which could result in extended consolidation before bulls resume. Daily Kijun-sen is expected to hold the downside and keep bulls intact, while break lower would weaken near-term structure. Break below 10SMA (109.45) would generate bearish signal and sideline bulls.
Res: 110.17, 110.26, 110.62, 111.00
Sup: 109.83, 109.75, 109.45, 109.36
AUD/USD Daily Outlook
Daily Pivots: (S1) 0.7627; (P) 0.7652; (R1) 0.7691; More...
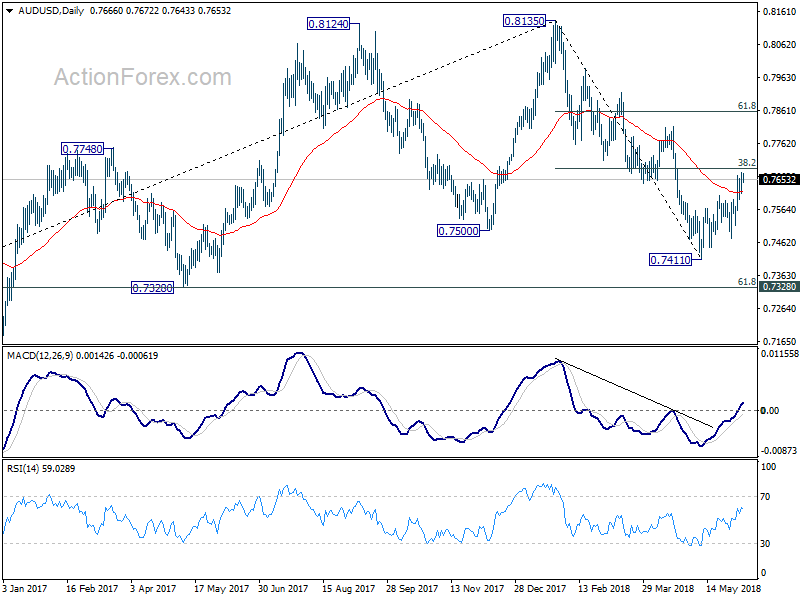
Intraday bias in AUD/USD remains neutral at this point. Outlook is unchanged that rebound from 0.7411 is seen as a correction. Hence, upside should be limited by 38.2% retracement of 0.8135 to 0.7144 at 0.7688. On the downside, below 0.7593 minor support will turn bias to the downside for 0.7475 first. Break there will likely resume larger fall through 0.7411 to 0.7328 cluster support (61.8% retracement of 0.6826 to 0.8135 at 0.7326). However, sustained break of 0.7688 will dampen our bearish view and target 61.8% retracement at 0.7585 instead.
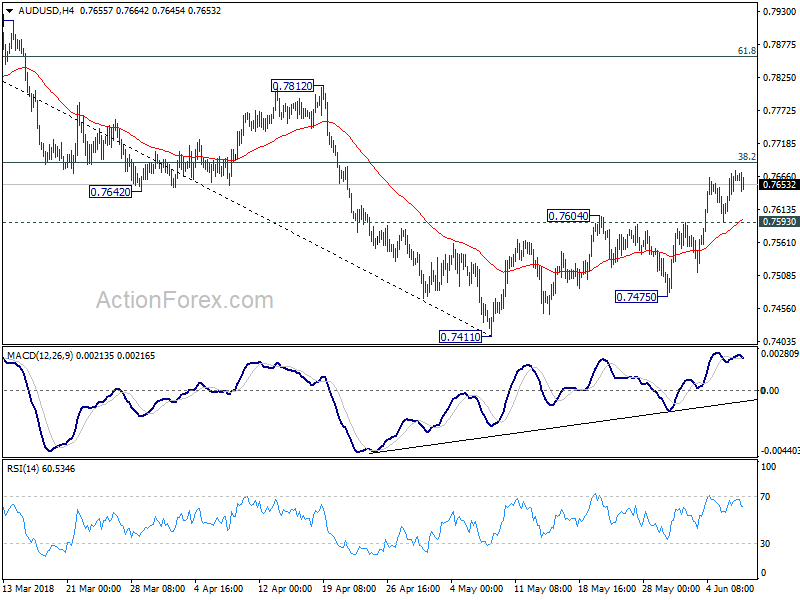
In the bigger picture, medium term rebound from 0.6826 is seen as a corrective move. Prior break of 0.7500 key support suggests that such correction is completed at 0.8135. Deeper decline would be seen back to retest 0.6826 low. In case of another rise, we'd expect strong resistance from 38.2% retracement of 1.1079 to 0.6826 at 0.8451 to limit upside to bring long term down trend resumption eventually.
Euro Rebound Rejuvenated As ECB Teases Taper, Revised Eurozone GDP Numbers Due
Here are the latest developments in global markets:
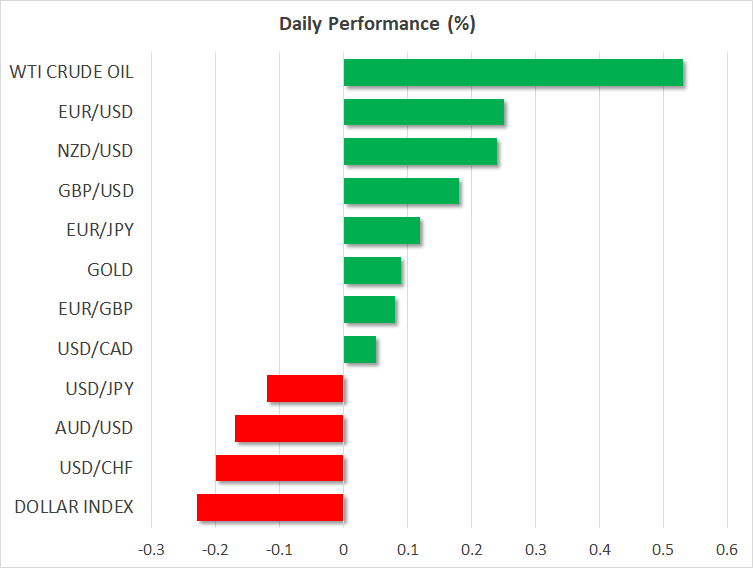
FOREX: The US dollar index is 0.2% lower on Thursday, extending the losses it posted in the previous session as the euro continued to recover. The euro’s rebound was refueled by some ECB policymakers, who signaled their confidence in the economic outlook, and heightened speculation that an end-date for the QE program could be announced as soon as next week.
STOCKS: Wall Street closed higher on Thursday, shrugging off the mounting uncertainties around global trade. The Dow Jones surged the most, climbing by 1.4%, while the S&P 500 and the Nasdaq Composite lagged, gaining 0.86% and 0.67% respectively. That being said, the Nasdaq managed to close at a fresh record high for the third session in a row, propelled by consumer cyclicals and healthcare. Futures tracking the Dow, S&P, and Nasdaq 100 are all in positive territory today, albeit marginally so. The positive sentiment rolled over into Asia as well, with indices in the region being mostly in the green. In Japan, the Nikkei 225 and the Topix rose by 0.87% and 0.64% correspondingly, while in Hong Kong, the Hang Seng advanced by 0.65%. In Europe, futures for all the major benchmarks are signaling a notably higher open today.
COMMODITIES: In energy markets, oil prices are higher today, recouping some of the losses they posted on Wednesday following a surprising build-up in the weekly EIA crude inventory data. Nonetheless, WTI and Brent crude are up by 0.5% and 0.65% respectively today. The narrative in the oil market remains whether and by how much OPEC and other producers may decide to increase their production, an announcement likely to come at the June 22 OPEC meeting. In precious metals, gold is almost 0.1% higher on Thursday, currently hovering near $1,298/oz. The yellow metal continues to trade in a very narrow range between $1,290 and $1,307 established in recent weeks and has surprisingly remained largely unfazed by the latest pullback in the US dollar. Gold, which is priced in dollars, tends to gain when the US currency weakens.
Major movers: Euro gets another leg up as ECB hints at tapering
The euro continued to reclaim ground on Wednesday, as a chorus of ECB speakers reignited market expectations for a potential announcement as soon as next week regarding when the Bank may end its QE program. While most comments came from the “usual hawkish suspects”, such as Weidmann and Knot, other typically centrist policymakers like chief economist Praet also joined in. Praet and Weidmann expressed confidence that inflation will continue to converge towards the Bank’s target, while Knot said policymakers should wind down QE as soon as possible.
Euro/dollar raced higher, managing to break back above the 1.1800 level during the early European trading session Thursday. While the common currency could remain under buying interest ahead of next week’s gathering on speculation the Bank will signal its intentions to exit QE, it remains quite uncertain whether such an announcement will actually be delivered in June. European PMIs continue to signal a slowdown in economic activity, implying that the “transitory” weakness seen in Q1 may have rolled over into Q2. And while core inflation showed signs of life again in May, one has to wonder whether that will be enough for policymakers to commit to an end-date for QE, or whether they will prefer to err on the side of caution, deferring such a decision until July.
In the US, the dollar index continued to edge lower yesterday and is also down by 0.2% today. The move is owed to the recovery in the euro, which holds more than 50% of the weight in the dollar index. Against the yen, the greenback is down 0.1% on Thursday, giving back some of the gains it posted in the previous session and hovering just a few pips above the psychological 110.00 level.
Elsewhere, the British pound largely overlooked UK media reports yesterday suggesting that PM May is facing a showdown with Brexit Secretary Davis over the government’s backstop plan to avoid a hard border in Ireland. The reports suggest there is a possibility Davis could even resign over the matter, something that would likely heighten political uncertainty further should it transpire.
Day ahead: Eurozone GDP and US jobless claims on the agenda; Turkish rate decision due
Thursday is looking a fairly quiet day in terms of economic releases, with revised Q1 growth numbers out of the eurozone and US jobless claims data being among the day’s releases.
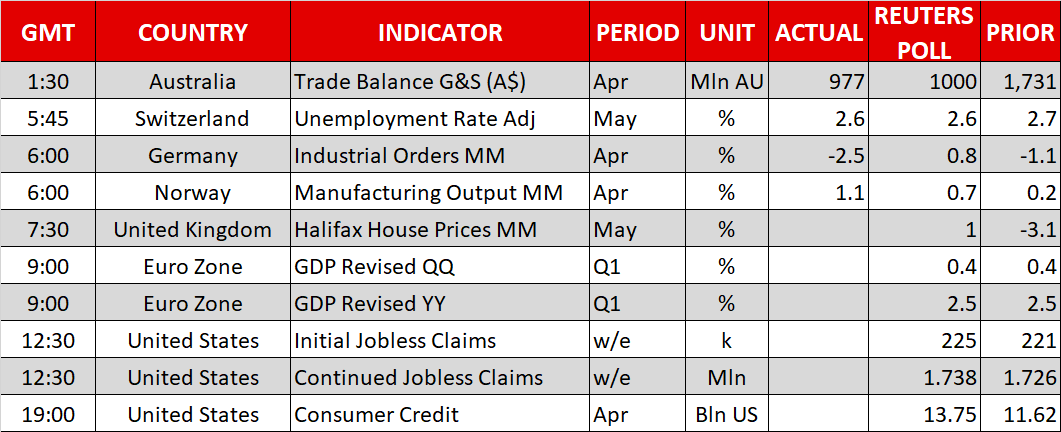
At 0730 GMT, the Halifax house price index will be made public out of the UK. House prices are projected to have risen by 1.0% m/m in May, after unexpectedly contracting by 3.1% in April.
Updated Q1 GDP figures out of the eurozone are scheduled for release at 0900 GMT, with the pace of expansion anticipated to be confirmed at 0.4% and 2.5% on a quarterly and annualized basis respectively. For the record, the figures would constitute a slowdown relative to Q4 when eurozone economies grew by 0.7 q/q and 2.8 y/y.
Out of the US, weekly jobless claims data are due at 1230 GMT, while the reading on April’s consumer credit is slated for release at 1900 GMT.
In the meantime, any developments on global trade will be closely monitored. It should also be kept in mind that a G7 summit, which may lead to a clash between the US and its traditional allies, will commence tomorrow in Canada.
In emerging markets, the Turkish lira, which has been severely hit over the last number of weeks, has been gathering increased attention. The Turkish central bank is expected to complete a policy meeting at 1100 GMT, with market projections that the Bank will proceed with raising interest rates being on the rise, especially after consumer price data released earlier in the week showed inflation expanding faster than forecasted. Note that the Bank hiked rates by 300 basis points on May 23.
Policymakers making appearances include ECB senior banking supervisor Korbinian Ibe (0930 GMT), Bank of Canada Governor Stephen Poloz and Senior Deputy Governor Carolyn Wilkins who will be holding a press conference (1515 GMT), and Bank of England Deputy Governor of Market and Banking Dave Ramsden (1400 GMT).
Also today and ahead of next week’s US-North Korea summit in Singapore, the US president will be holding talks with Japanese PM Shinzo Abe at the White House.
Technical Analysis: Gold looking neutral in the short-term
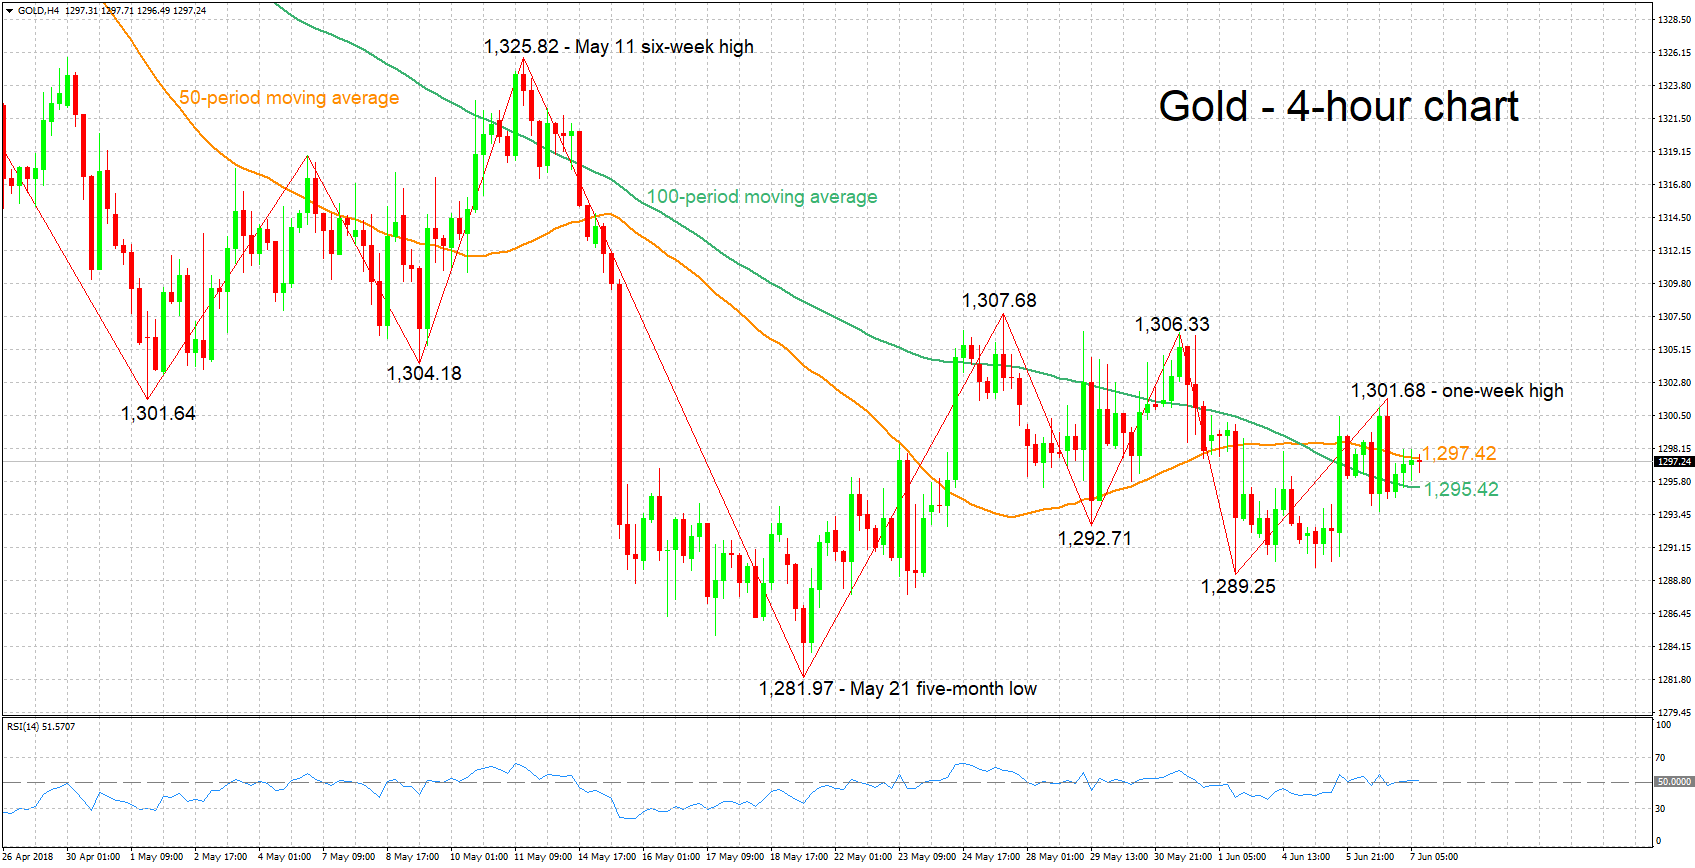
Gold is largely moving sideways during the last few days. The RSI is also moving sideways around the 50 neutral-perceived level; this is supportive of a neutral near-term picture.
Rising trade uncertainty may divert funds to the perceived safe-haven precious metal. Immediate resistance to advances may be taking place around the current level of the 50-period moving average at 1,297.42, with a break above shifting the focus to yesterday’s one-week high of 1,301.68 – the area around this level encapsulates the 1,300 round figure as well as a couple of bottoms from the past at 1,301.64 and 1,304.18.
Abating trade worries, on the other hand, are likely to spur risk sentiment, with investors transferring funds out of gold and into riskier assets. Support to declines could come at the 100-period MA at 1,295.42 and further below from the region around 1,290 which captures a couple of troughs from late May and early June at 1,292.71 and 1,289.25.
The greenback’s direction can also affect the yellow metal; gold is denominated in dollars and a stronger USD is rendering it less attractive to non-dollar holders and vice versa.
USD/CAD Daily Outlook
Daily Pivots: (S1) 1.2870; (P) 1.2925; (R1) 1.2998; More.....
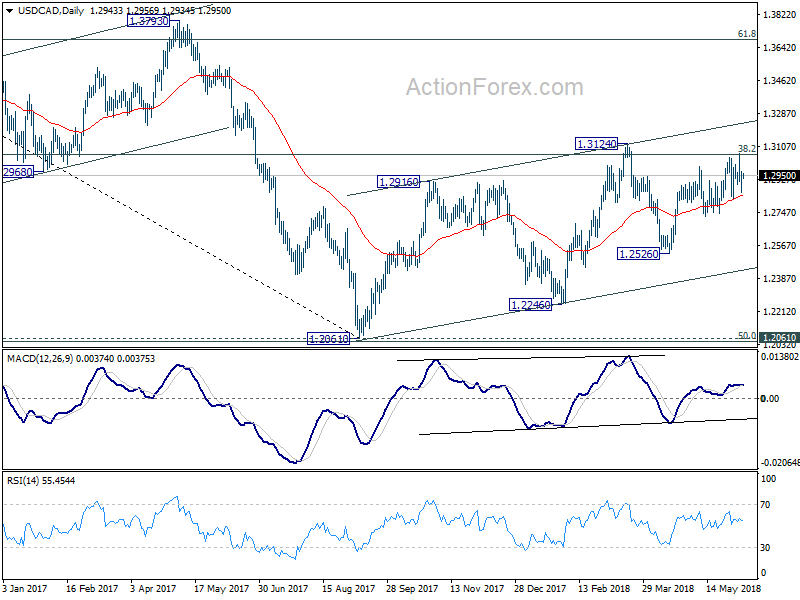
Intraday bias in USD/CAD remains neutral at this point. Near term outlook will stay cautiously bullish as long as 1.2817 support holds. Above 1.3066 will extend the rise from 1.2526 to 1.3124 key resistance. Decisive break there will carry larger bullish implication. However, break of 1.2817 will indicate near term reversal and turn bias to the downside for 1.2728 support and below.
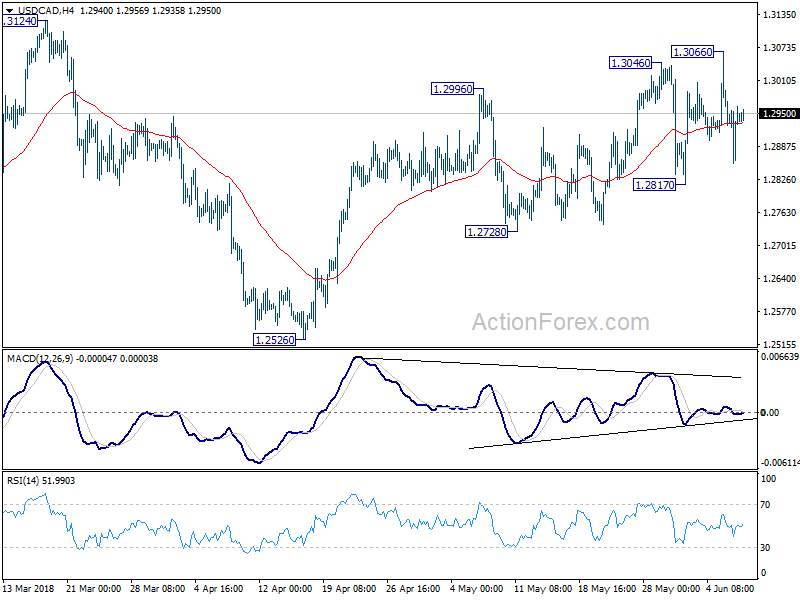
In the bigger picture, we're favoring the case that that rebound from 1.2061 has not completed yet. But there is no follow through upside momentum so far. Focus remains on 38.2% retracement of 1.4689 to 1.2061 at 1.3065. Sustained trading above there will confirm medium term bullish reversal. That is, down trend from 1.4689 has completed at 1.2061 already. In that case, next target will be 61.8% retracement at 1.3685. However, break of 1.2526 support will dampen this bullish view again. And, focus will be back on 1.2061 key support level, which is close to 50% retracement of 0.9406 (2011 low) to 1.4689 (2015 high) at 1.2048.