Sample Category Title
GOLD Consolidating
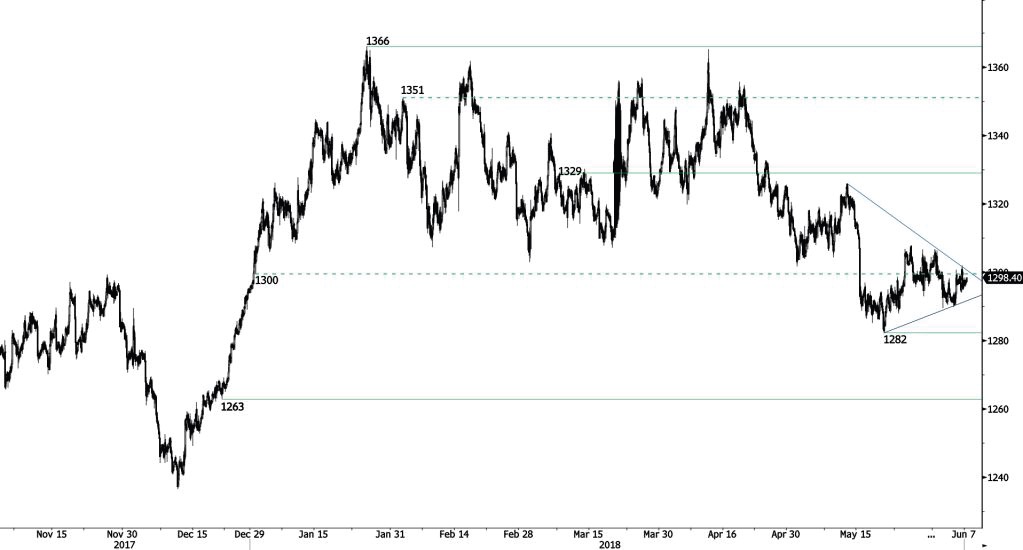
Gold strong bounce from 1290 low continues, trading along 1298 and approaching 1301. Hourly support and resistance are given at 1282 (21/05/2018 low) and 1329 (08/03/2018 high). The technical structure suggests further short-term increase.
In the long-term, the technical structure suggests that there is a growing upside momentum. A break of 1'392 (17/03/2014) is required to confirm it. A major support can be found at 1'045 (05/02/2010 low). The pair is trading below its 200 DMA.
EUR/JPY Daily Outlook
Daily Pivots: (S1) 128.86; (P) 129.35; (R1) 130.22; More....
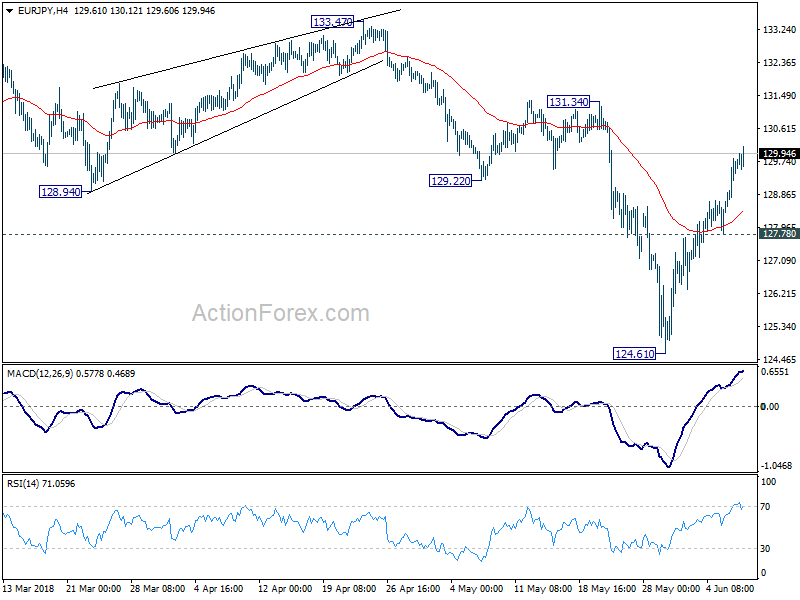
EUR/JPY's rebound from 124.61 extends to as high as 130.12 so far today and intraday bias remains on the upside. As noted, the three wave structure of the fall from 133.47 to 124.61 suggests it's a correction. And larger rally is not completed. Break of 131.34 resistance will pave the way to retest 133.47 high next. On the downside, break of 127.78 support is now needed to indicate completion of the rebound. Otherwise, outlook will stay cautiously bullish in case of retreat.
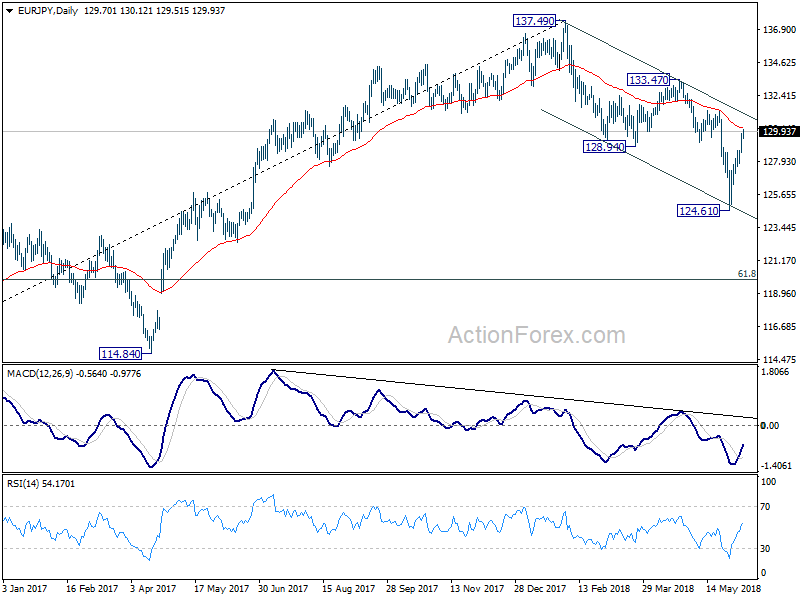
In the bigger picture, as long as 124.08 resistance turned support holds, medium term rise from 109.03 (2016 low) is still in progress and another high above 137.49 would be seen. Nonetheless, considering bearish divergence condition in daily MACD, decisive break of 124.08 will confirm medium term reversal and target 61.8% retracement of 109.03 to 137.49 at 119.90 and below.
EUR/AUD Daily Outlook
Daily Pivots: (S1) 1.5291; (P) 1.5350; (R1) 1.5418; More....
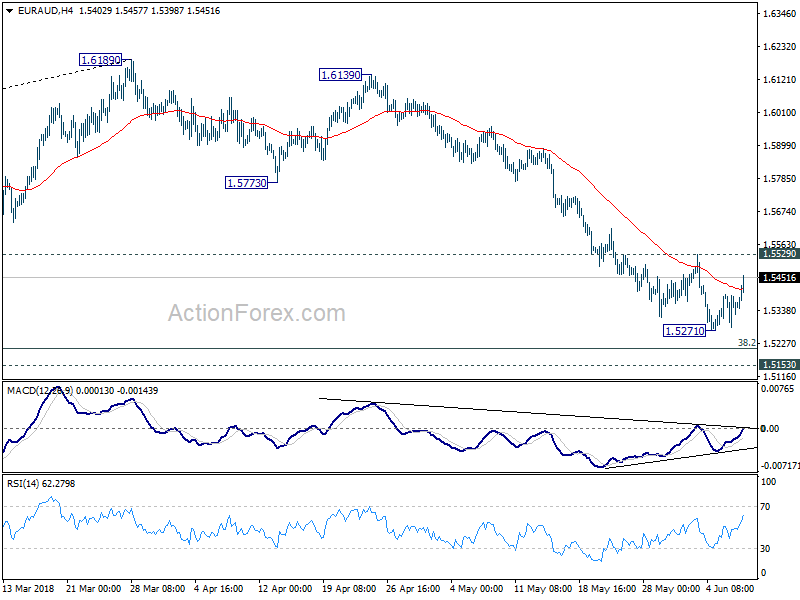
Intraday bias in EUR/AUD stays neutral for the moment with focus back on 1.5529 resistance. Break there will indicate short term bottoming, on bullish convergence condition in 4 hour MACD. In that case, stronger rebound could be seen to 55 day EMA (now at 1.5676) before staging another fall. On the downside, below 1.5271 will target 1.5153 key support. But we'll be cautious on strong support from there to bring rebound.
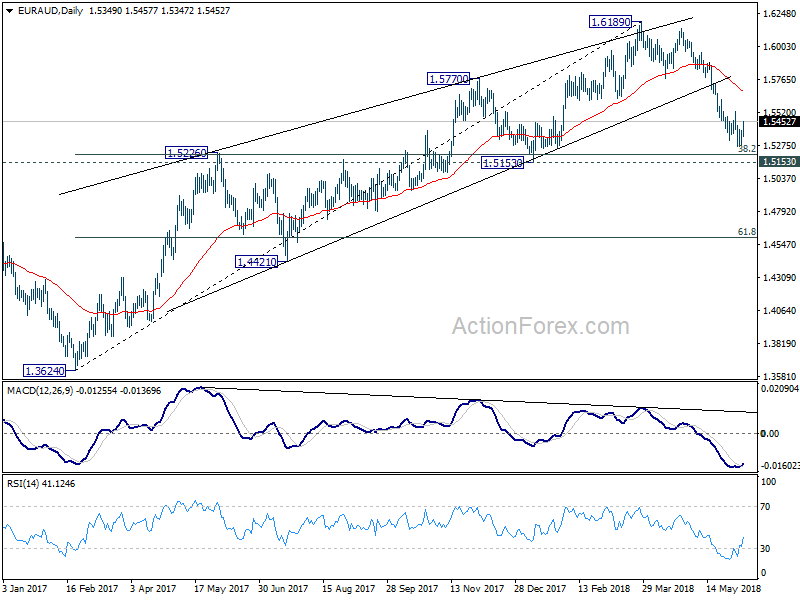
In the bigger picture, rally from 1.3624 (2017 low) should have completed at 1.6189 already, ahead of 1.6587 key resistance (2015 high). 1.6189 is seen as a medium term top. Deeper fall would be seen to 38.2% retracement of 1.3624 to 1.6189 at 1.5209 first. Decisive break there will pave the way to 61.8% retracement at 1.4604. In that case, we'll look for bottoming again below 1.4604. On the upside, firm break of 1.5773 support turned resistance is needed to indicate completion of the fall from 1.6189. Otherwise, further decline is expected in medium term, even in case of strong rebound.
EUR/CHF Challenge Of Resistance
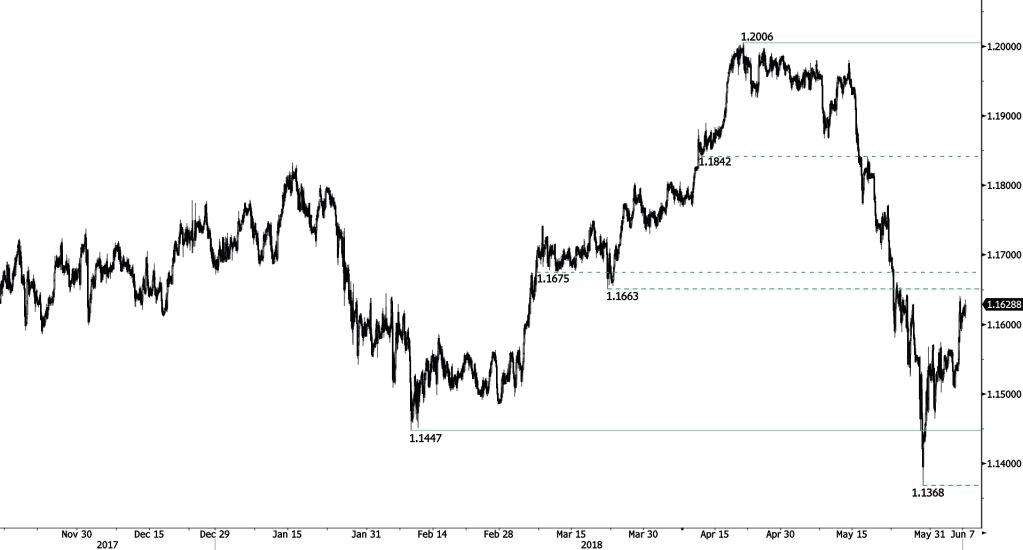
EUR/CHF bounced yesterday. However, the resistance at 1.1663 has yet to be tested. Hourly support and resistance are given at 1.1447 (08/02/2018 low) and 1.2006 (20/04/2018 high). The technical structure suggests short-term upward moves.
In the longer term, the technical structure has reversed. Strong resistance at 1.20 (level before the unpeg) is now at reach. The ECB's slowing QE program is likely to cause buying pressures on the euro, which should weigh in favour of the EUR/CHF. Support and resistance can be found at 1.0624 (24/06/2016 low) and 1.2097 (18/12/2014 high).
EUR/GBP Bullish Breakout?
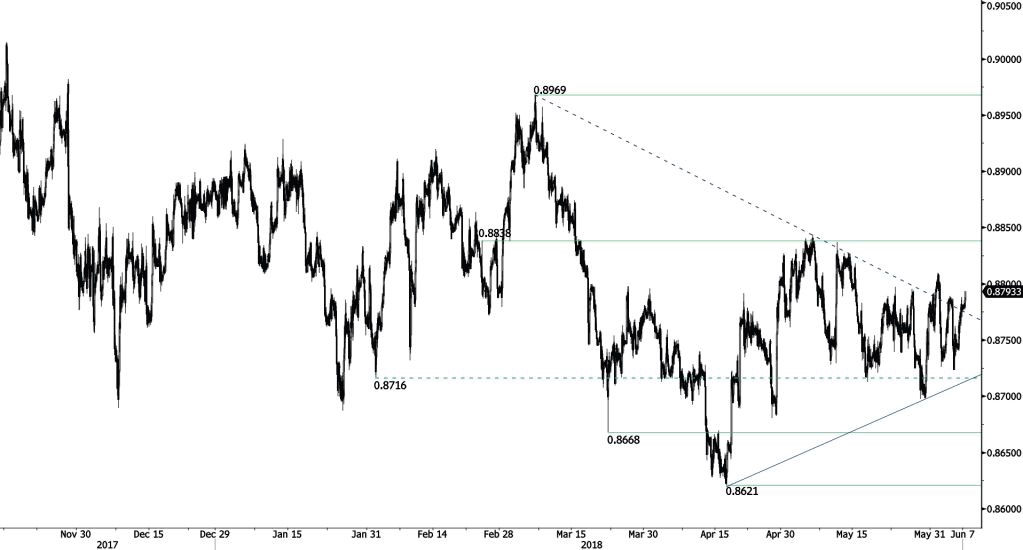
EUR/GBP strong bounce continues, trading above 0.876 and heading along 0.878. Hourly support and resistance are given at 0.8668 (22/03/2018 low) and 0.8838 (23/02/2018 high). The technical structure suggests short-term increase.
In the long-term, the pair has largely recovered from 2015 lows. The technical structure suggests further upside pressure. Strong resistance can be found at 0.9500 (psychological level) while support remains at 0.8304 (05/12/2016 low). The pair is trading below its 200 DMA.
AUD/USD Bullish Consolidation
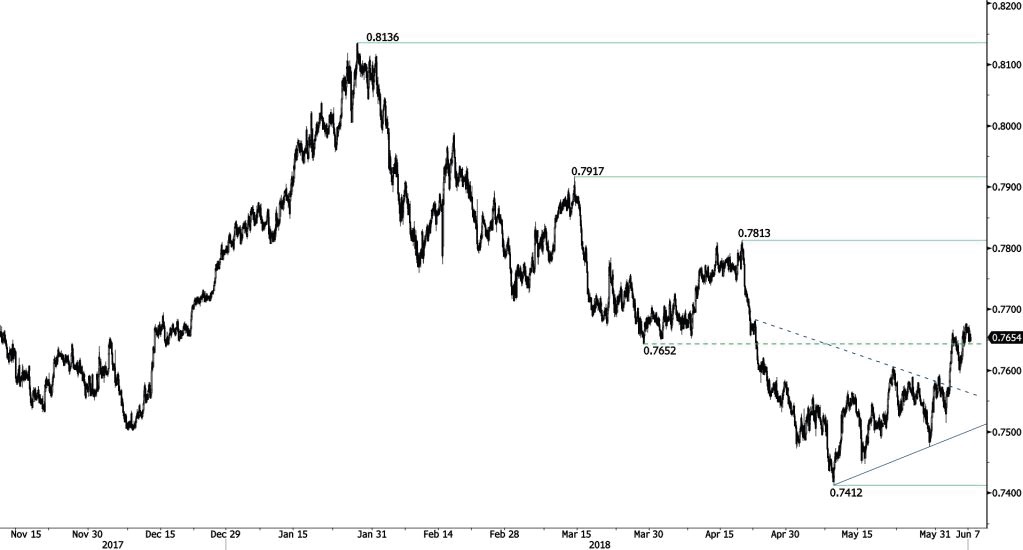
AUD/USD strong bounce has damaged 0.7652 resistance. Break of the strong resistance at 0.7917 (14/03/2018 high) is needed to invalidate the current short-term bearish bias. Hourly support remains at 0.7412 (09/05/2018 low). The technical structure suggests short-term upward moves.
In the long-term, the upward trend slows down after failing to reach key resistance at 0.8164 (14/05/2015 low). Key support stands at 0.6011 (28/10/2008 low). A break of the key resistance at 0.8164 (14/05/2015 high) is needed to invalidate our long-term bearish view.
USD/CAD False Breakout
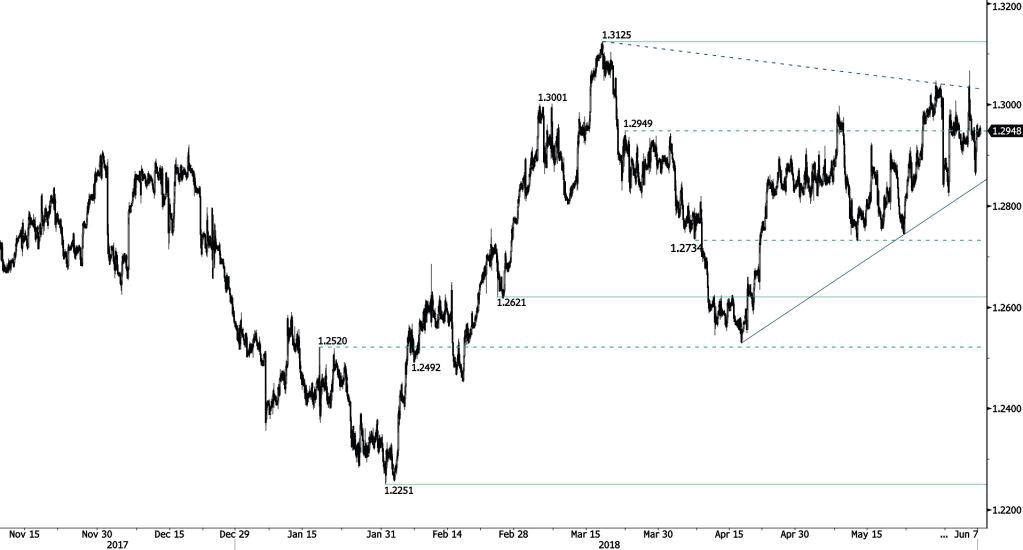
USD/CAD continues to weaken after its successful test of the key resistance area. Hourly support and resistance are located at 1.2621 (23/02/2018 low) and 1.3125 (19/03/2018 high). The technical structure suggests short-term decrease.
In the longer term, the pair is trading between resistance point at 1.3805 (05/05/2017 high) and support at 1.2128 (18/06/2015 low). Strong resistance is given at 1.4690 (22/01/2016 high). The pair is likely to head lower. The pair is trading above its 200 DMA
USD/CHF Weakening
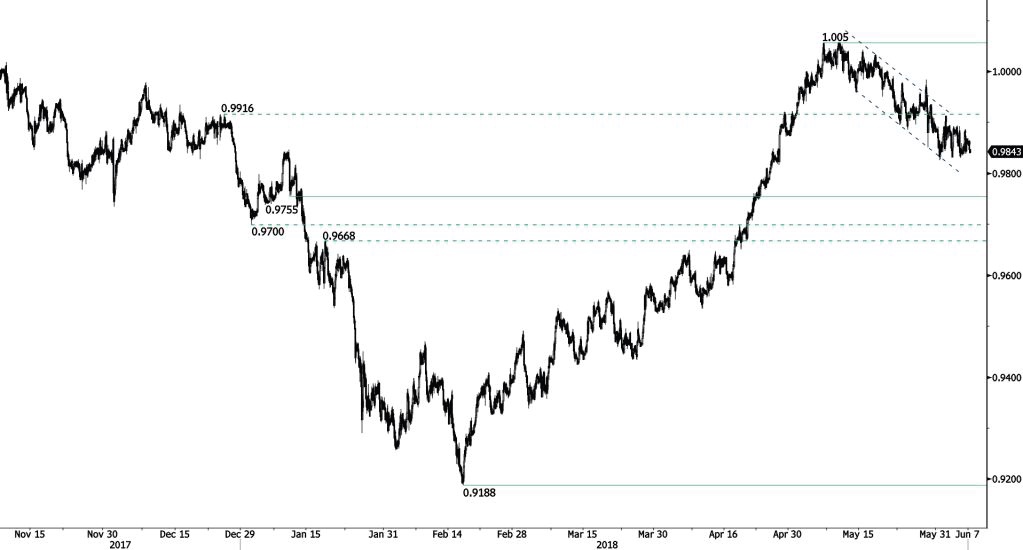
USD/CHF is weakening at the 0.9845 range, trading sideways. The bearish pattern started in May 2018 is maintained. Key support and resistance are given at 0.9755 (10/01/2018 low) and 1.01 (11/05/2017 high). The technical structure suggests short-term sideways trading moves.
In the long-term, the pair is still trading in range since 2011 despite some turmoil when the SNB unpegged the CHF. Key support lies at 0.9072 (07/05/2015 low) while resistance at 1.0344 (15/12/2016 high) is distanced. The technical structure favours a long term bullish bias since the unpeg in January 2015.
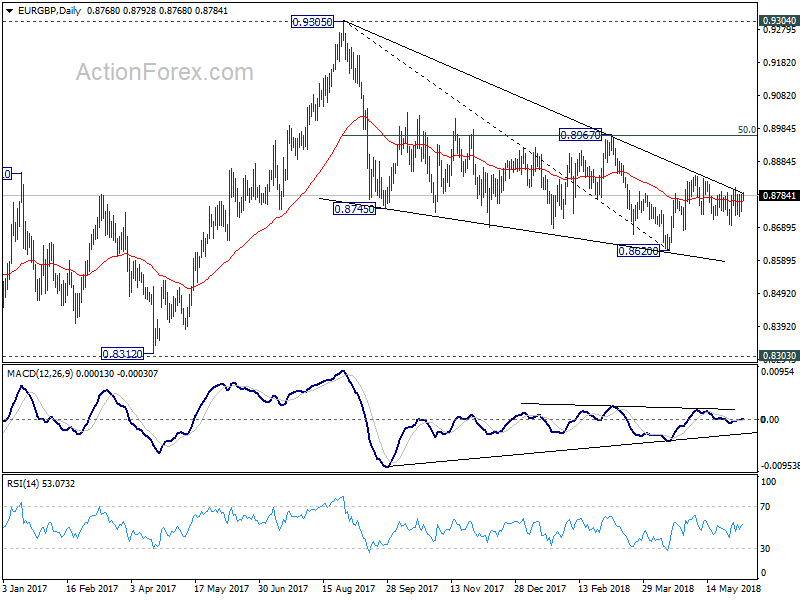
EUR/GBP Daily Outlook
Daily Pivots: (S1) 0.8748; (P) 0.8769; (R1) 0.8798; More...
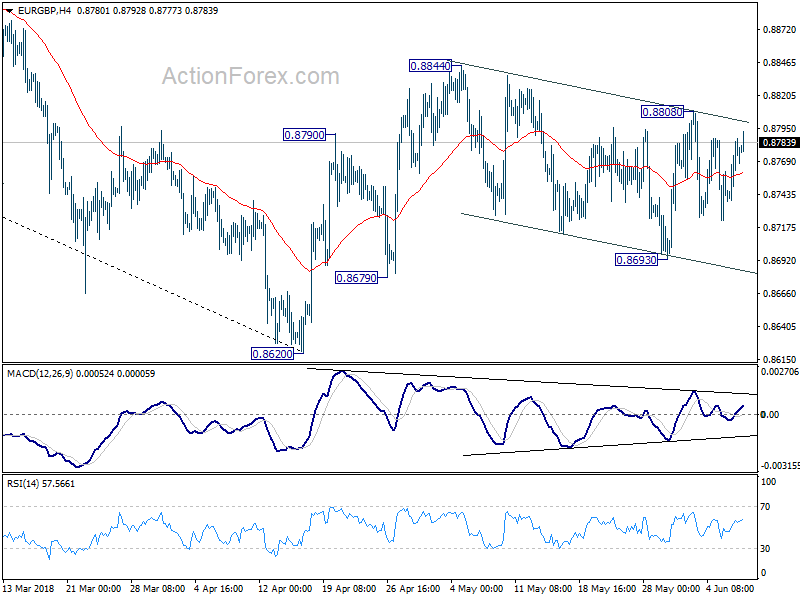
EUR/GBP is still bounded in right range inside near term channel. Intraday bias remains neutral first. On the upside, above 0.8808 will target 0.8844 first. Firm break there will finally confirm our bullish view and resume the rebound from 0.8620 to 0.8967 cluster resistance (50% retracement of 0.9305 to 0.8620 at 0.8963). On the downside, however, break of 0.8679 minor support should indicate completion of the rebound form 0.8620. And intraday bias will be turned back to the downside for this support.
In the bigger picture, for now, the decline from 0.9305 is seen as a leg inside the long term consolidation pattern from 0.9304 (2016 high). Such consolidation pattern could extend further. Hence, in case of strong rally, we'd be cautious on strong resistance by 0.9304/5 to limit upside. Meanwhile, in another decline attempt, we'd expect strong support from 0.8116 cluster support (50% retracement of 0.6935 to 0.9304 at 0.8120) to contain downside.
USD/JPY Consolidating
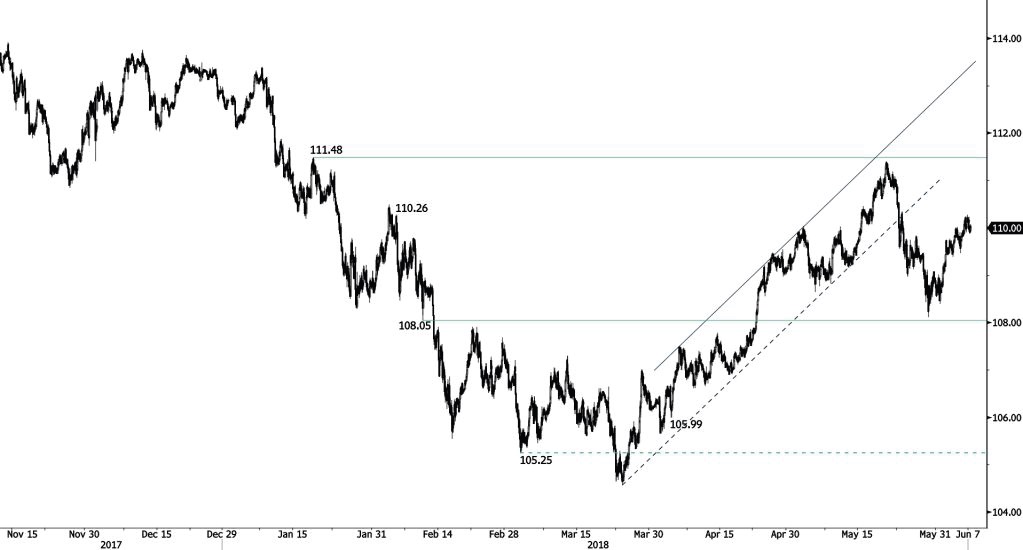
USD/JPY strong bounce from 108.39 (31/05/2018 low) continues, the pair is trading above 110, approaching 110.20. Strong support and resistance are located at 108.05 (09/02/2018 low) and 111.48 (18/01/2018 high). The technical structure suggests short-term increase.
We favor a long-term bearish bias. A gradual rise towards major resistance at 125.86 (05/06/2015 high) seems unlikely. The pair is expected to decline further along long-term support at 101.20 (09/11/2016 low). The pair trades at its 200 DMA.