Sample Category Title
USDJPY Breaks 110 Resistance But In Rising Wedge Pattern
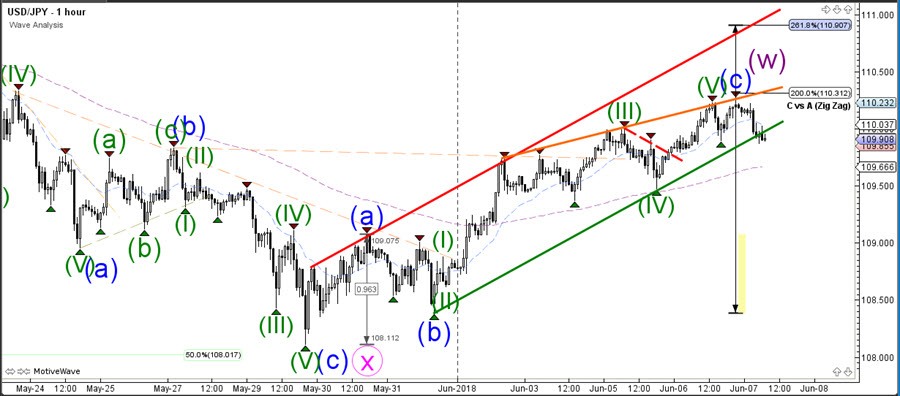
The USD/JPYuptrend could be losing steam as its building a rising wedge chart pattern. The support and resistance trend lines remain a key factor.
A bearish breakout will probably complete the wave W and start a wave X correction whereas a bullish bounce could price move higher within the bullish channel.
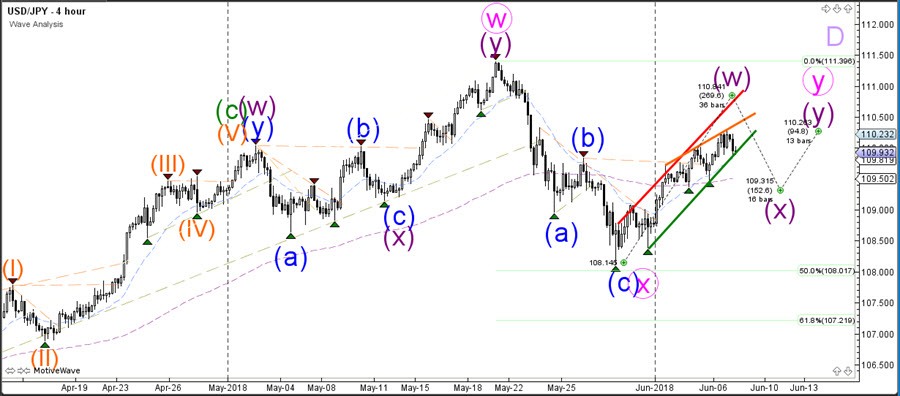
The USD/JPY broke above the 110 resistance trend line which is now being used as potential support. The 110 level could be a key bounce or break spot.
China MOFCOM Indicates Some Progress On Trade Talks With US
General Trend:
- Asian equity markets opened higher following yet another record high for the Nasdaq
- Financials in Asia trade generally higher
- Chinese steel producers supported by rise in prices; China launces environmental inspections
- China National Energy Administration (NEA) says to maintain support for solar industry
- China confirms issuance of rules related to China Depositary Receipts (CDRs), announces related fund launches
- McDonald's Japan reports 30th straight month of SSS increases
- Australian Iron ore M&A: Fortescue raises stake in Atlas Iron, seeks to block offer from Mineral Resources
- Asian bond yields generally track Wednesday's gains in German and US Treasury yields
- Foreigners sell Malaysian bonds amid the May elections
- Japanese selling of foreign bonds jumps in recent weekly period, some suggests selling of European bonds
- EUR/USD adds to gains seen on Wednesday's session, recent ECB comments in focus
- AUD/JPY declines over 0.4%, USD/JPY moves below ¥110: Australia April trade surplus misses estimates, exports decline
- China weekly pork prices rise amid recent trade spat with the US
- China Commerce Ministry confirmed talks with the US related to energy and agriculture
- China monthly Foreign Exchange reserves data may be released later today, trade balance may come on following session
- Japan final Q1 GDP data due on Friday, upward revision expected
- Australia expected to sell A$2.5B in May 2030 bonds on Friday
Headlines/Economic Data
Japan
- Nikkei 225 opened +0.5%; closed +0.9%
- TOPIX Securities index +1.5%, Iron & Steel +0.9%
- Japanese automakers trade generally higher, track earlier gains in the US
- Megabanks gain amid rise in US and European bond yields
- (JP) Japan revised Q1 GDP figures (due on Friday) expected to show upward revision due to Capex – financial press
- (JP) Japan Investors Net Buying of Foreign Bonds: -¥1.67T v -¥700.2B prior week; Foreign Net Buying of Japan Stocks: -¥527.6B v -¥380.0B prior week
- (JP) Japan May Official Reserve Assets: $1.25T v $1.26T prior
- (JP) Japan Chief Gov Spokesperson: Japan will work persistently on US tariff issue
Korea
- Kospi opened +0.6%
- (KR) Satellite imagery shows North Korea has destroyed a missile test stand - 38North blog
- (KR) Reportedly USA is hoping to come up with a joint document with #NorthKorea, drawing on a statement issued in 2005 at 6-party (2 Koreas, China, US, Japan & Russia) talks aimed at curbing the North's #nuclear ambitions - Korean press
China/Hong Kong
- Hang Seng opened +0.7%, Shanghai Composite +0.2%
- Hang Seng Financials index +0.9%, Telecom +0.6%; Utilities -0.6%
- Shanghai Composite Property Sub-index rises over 1%
- (CN) China CSRC issues rules on CDRs: To strictly control size and pace of issuance
- (CN) China Commerce Min: Some 'specific' progress made on just completed trade talks, details in trade talks will US 'are to be confirmed'; to implement consensus reached in Washington
- (CN) Global Times: China still preparing for worst' in US trade dispute
- (CN) China govt reportedly offered to buy $70B in US farm and energy products in return for Trump administration dropping tariff plans - press
- (CN) China Securities Regulatory Commission (CSRC) confirms it has issued rules on China Depository Receipts (CDRs): To strictly control size and pace of issuance
- (CN) China PBoC sets yuan reference rate at 6.3919 v 6.4040 prior
- (CN) China PBoC Open Market Operation (OMO): Injects combined CNY40B in 7-day and 28-day reverse repos v skips prior: Net: drain CNY70B v CNY0B injected prior
- GCL Poly, [+18%], 3800.HK Halted: To sell 51% stake in unit for $2B to Shanghai Electric
- (HK) HK$ 1-month HIBOR +19bps to 1.30242% (highest level since 2008); 3-month 1.91893% (highest level since 2008)
Australia/New Zealand
- ASX 200 opened +0.2%, closed +0.6%
- ASX 200 Telecom index +1.5%, Resources +1.3%, Energy +1.2%, Financials +0.6%: REIT -0.2%
- (AU) Australia national power grid is getting a surge of power from solar, the equivalent of a new power plant being built every season - local press
- (AU) Australia sells A$500M v A$500M indicated in Aug 2018 notes, avg yield 1.8809%, bid to cover 2.85x
- (AU) AUSTRALIA APR TRADE BALANCE (A$): 0.98B V 1.0BE
- (NZ) New Zealand sells NZ$100M v NZ$100M in 2.50% Sept 2040 inflation indexed bonds, avg yield 2.1222%, bid to cover 1.71x
Other Asia
- (MY) May Foreign holdings of Malaysia debt said to decline to MYR192.5B, -6.3% m/m (multi-month low) - US financial press
North America
- US equity markets ended higher: Dow +1.4%, S&P500 +0.9%, Nasdaq +0.7%, Russell 2000 +0.7%
- S&P500 Materials +1.9%, Financials +1.8%
- COST Reports May SSS (ex-gas) 8.0%; US SSS (ex-gas) 8.7% v 5.6%e
- Twitter [TWTR] prices convertible note offering
- (US) Follow Up: Warren Buffett and JPMorgan CEO Dimon said to urge companies to stop issuing quarterly financial guidance – US financial press
- (US) President Trump said to be planning to adopt a confrontational tone at G7 in responds to the other 6 joining together to pressure him on tariffs - US press
- (US) DOE CRUDE: +2.1M V -2ME
Europe
- (UK) PM May said to be keeping Brexit supports in the dark about her backstop plans - UK press
- (G7) Official: No joint statement that wouldn't mention Paris accord; statement should state trade be open, free and fair
- (DE) Germany Fin Min Scholz said ESM should not be allowed to invest in corporate bonds – German Press
Levels as of 02:00ET
- Hang Seng +0.7%; Shanghai Composite -0.1%; Kospi +0.7%
- Equity Futures: S&P500 +0.1%; Nasdaq100 +0.1%, Dax -0.0%; FTSE100 -0.0%
- EUR 1.1802-1.1775; JPY 110.22-109.86; AUD 0.7672-0.7644;NZD 0.7050-0.7031
- Aug Gold +0.0% at $1,301/oz; Jul Crude Oil +0.6% at $65.14/brl; Jul Copper +0.2% at $3.28/lb
USDJPY Hits 200-Day SMA Obstacle And Returns Some Gains
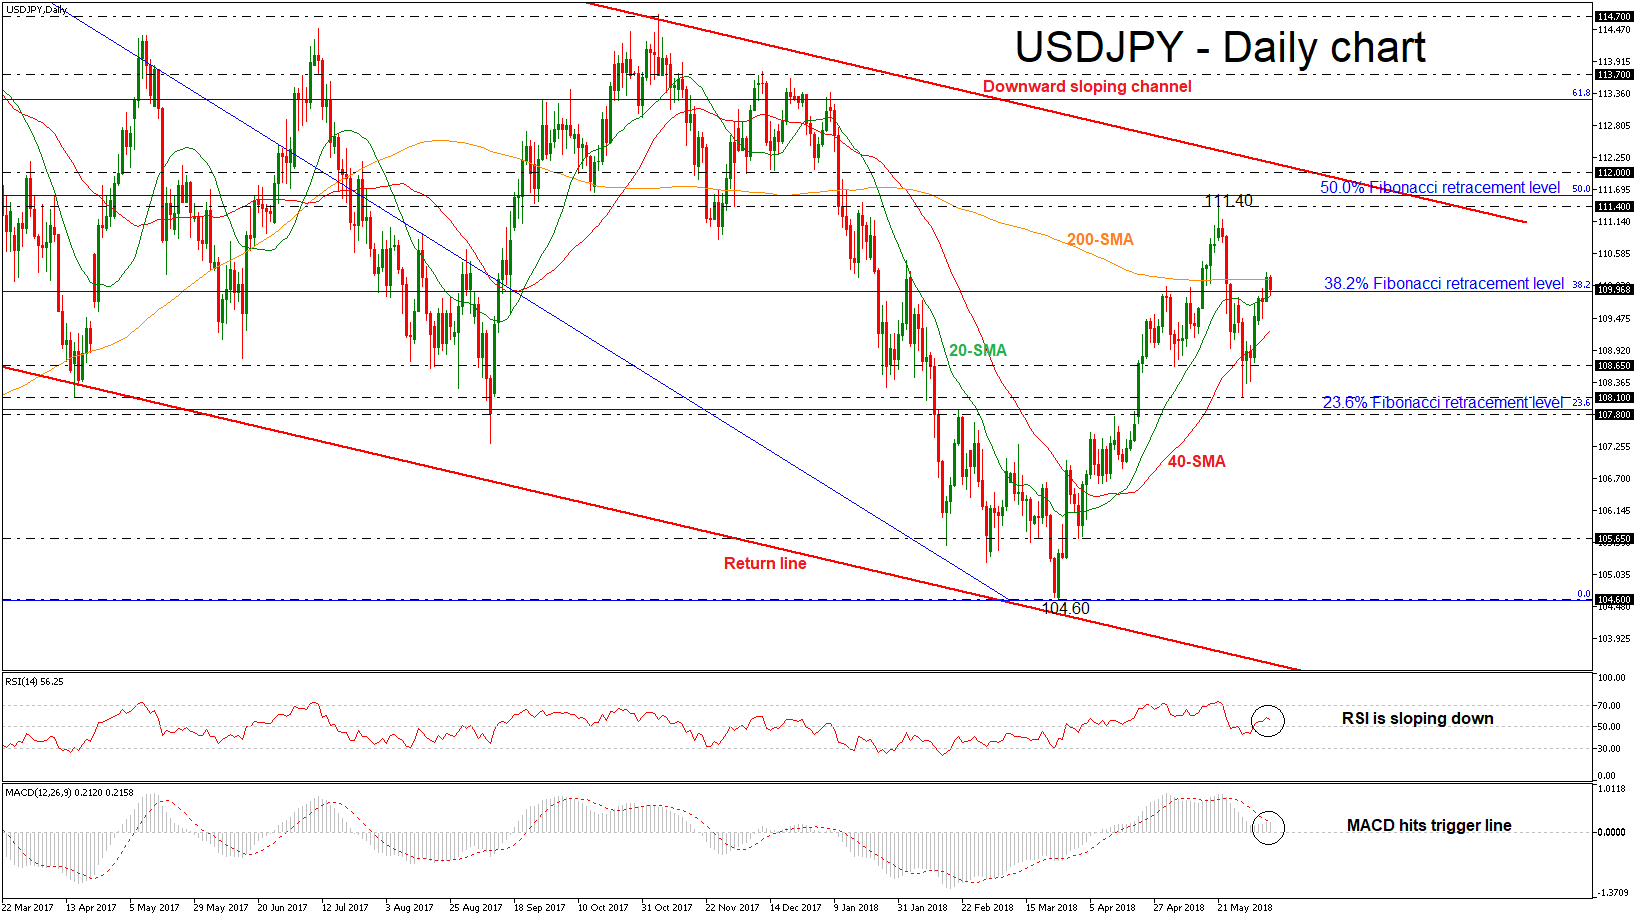
USDJPY has found strong resistance obstacle on the 200-day simple moving average (SMA) early this morning and drove the pair lower. Since its deep fall towards the 108.10 support level, the price has been going back and forth creating a base around the 38.2% Fibonacci retracement level of the downleg from 118.60 to 104.60, around 109.90.
Looking at momentum indicators, in the daily timeframe, the RSI indicator is pointing slightly to the downside, standing in the bullish territory, while the MACD oscillator approached its trigger line above the zero line with weak momentum.
In the wake of negative pressures and a slip below the 38.2% Fibonacci, the pair could see immediate support near the 40-day SMA of 109.25 at the time of writing. A successful close below this level could see a retest of the 108.65, while in case of steeper declines, the price could breach this trough, diving to the 23.6% Fibonacci around the 107.80 support.
On the flip side, an aggressive run above the significant obstacle of 200-day SMA should increase positive momentum until the 111.40 resistance level and slightly higher towards the 50.0% Fibonacci of 111.60. A stronger barrier, though, could be found at the 112.00 psychological level near the longer-term descending trend line.
When looking in the longer timeframe, USDJPY has been trading within a channel tilted slightly to the downside since December 2016.
GDP Data, Central Bank Speakers In The Headlines On Thursday
A combination of economic data and monetary policy considerations will headline the financial markets on Thursday, giving investors the latest insight into the global economy.
Action begins in Europe at 05:45 GMT with Switzerland’s monthly unemployment report. The May jobless rate is forecast to decline to 2.6% from 2.7%.
At 06:00 GMT, the German government will report on April factory orders. The headline reading is expected to show month-on-month growth of 0.8% following a 0.9% decline in March.
Later in the morning, the French government will report on its April trade balance. The deficit in Paris is forecast to widen slightly to €5.3 billion.
At 09:00 GMT, the European Commission’s statistical agency will release revised first-quarter GDP figures. The euro area economy slowed unexpectedly between January and March, preliminary estimates showed last month. The revised data set is expected to confirm the first-quarter slowdown with quarterly growth of just 0.4%. In annualized terms, that translates to 2.5%.
Shifting gears to North America, the US Department of Labor will issue its weekly report on jobless claims for the period ended 2 June. The number of Americans filing for first-time unemployment benefits likely rose by 4,000 to a seasonally adjusted 225,000.
The Bank of Canada (BOC) will issue its biannual Financial System Review at 14:30 GMT, which provides a snapshot of key economic developments facing the economy. About 45-minutes later, BOC Governor Stephen Poloz is scheduled to deliver a speech.
BOC officials are widely expected to raise interest rates in July as inflation continues to gain traction thanks to rising oil prices.
Around the same time as Poloz, Bank of England (BOE) Governor David Ramsden is also expected to speak publicly.
EUR/USD
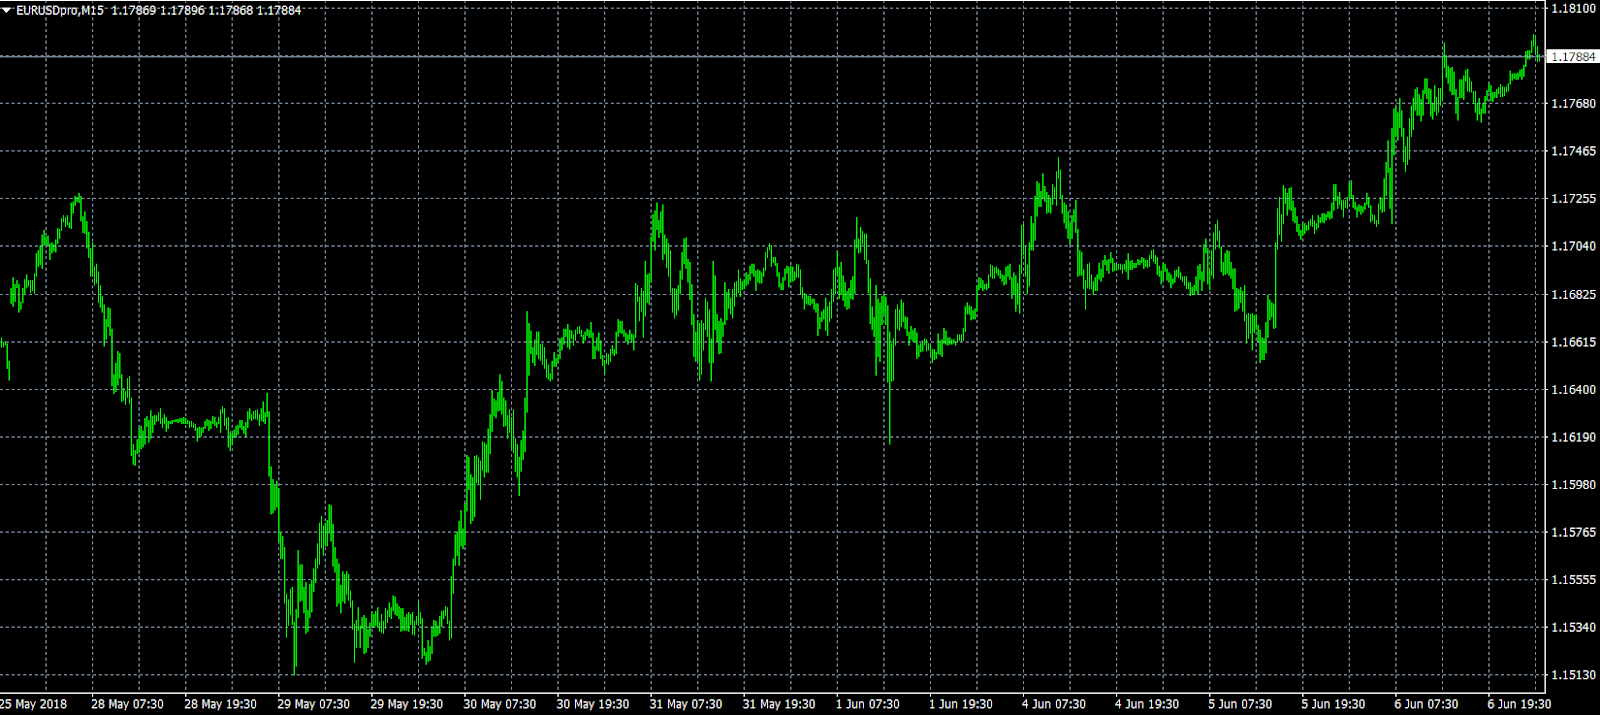
Europe’s common currency has extended its rally to two-week highs amid signs that the ECB will taper bond purchases all the way down to zero before the end of 2018. EUR/USD was last seen trading just below 1.1800, having gained some 250 pips from last week’s swing low. The pair is currently eyeing the 1.1830 resistance level, which corresponds to the high from 22 May.
GBP/USD
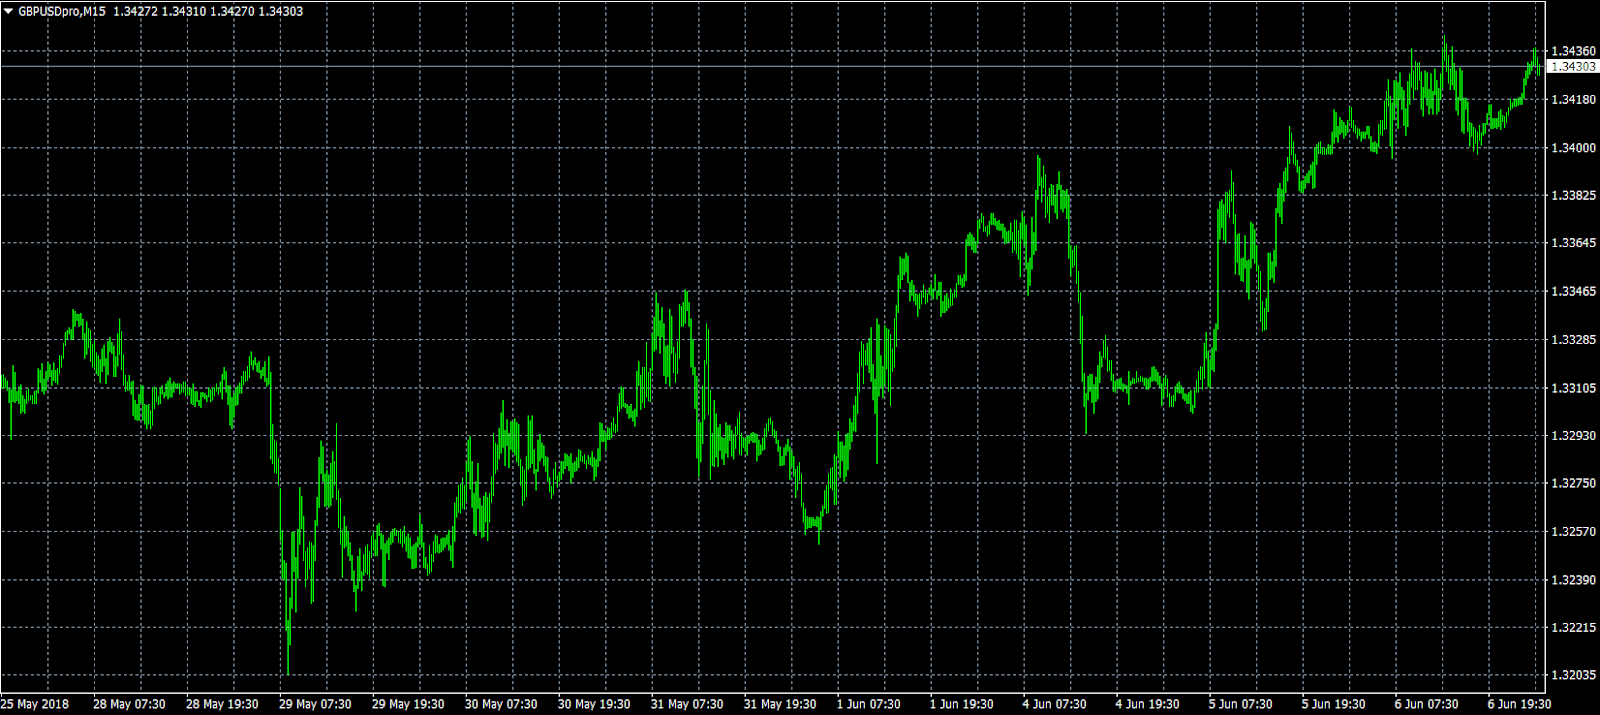
Cable extended its winning streak on Wednesday, as prices reached their highest levels in over two weeks. GBP/USD was last seen trading around 1.3430, having gained 0.1% from the previous close. The pair is approaching a resistance level around the 1.3440 region; a clean break could generate a relief rally back toward 1.3500.
USD/CAD
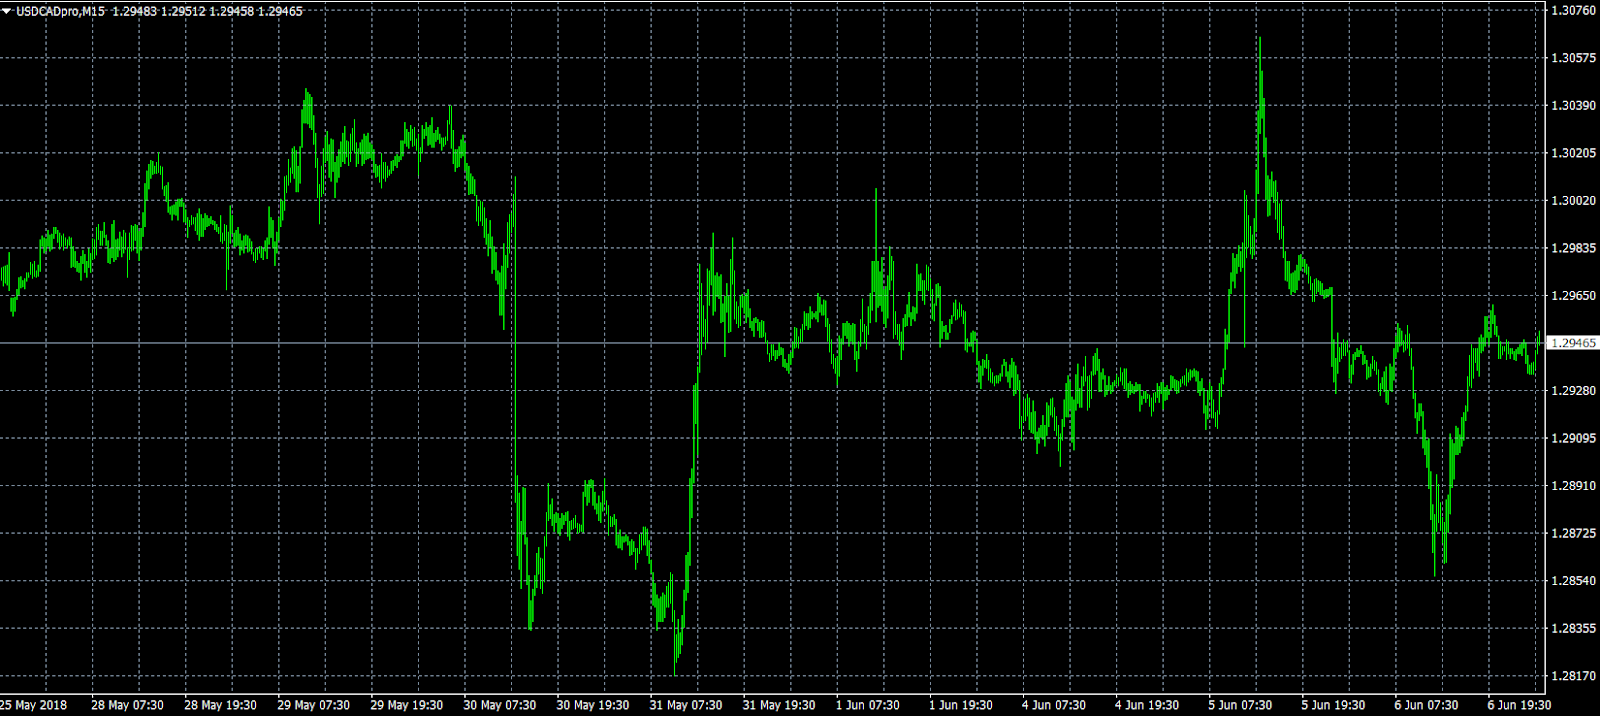
The USD/CAD exchange rate is coming off a volatile Wednesday session as prices plunged to a low of 1.2868. The pair has since recovered nearly 80 pips to trade back in the mid-1.2900 region. The North American exchange rate continues to be influenced by NAFTA rumors, which aren’t going away anytime soon.
Bitcoin Falls Even As Fidelity Moves Into Cryptocurrencies
Late last year, the price of bitcoin rose after CME Group and CBOE Global Markets launched bitcoin futures. Traders pegged their hope on institutional investors with the belief that Wall Street would increase the demand for bitcoin, which would lead to a higher price.
Since then, the price of bitcoin has fallen by more than half. In December, the price rose to more than $19,000. Today, bitcoin is selling for $7650. This could be because Wall Street did not bring the demand the traders expected. It could also be because most Wall Street traders placed short bets on the cryptocurrency.
Yesterday, a report by Business Insider showed that Fidelity Investments is plotting a move into the crypto space. Fidelity is one of the largest wealth managers in the world with more than $2.4 trillion in assets under management. The company has more than 26 million customers. While this should have been good news for bitcoin, the price declined yesterday.
Other major news came from the SEC Chair, Jay Clayton, who said that the commission would not designate bitcoin as a security. He argued that the cryptocurrency could not qualify as a security because it is meant to replace fiat currencies. However, he said that Initial Coin Offerings (ICOs) were likely securities because investors buy them with the hope that their token prices will rise.
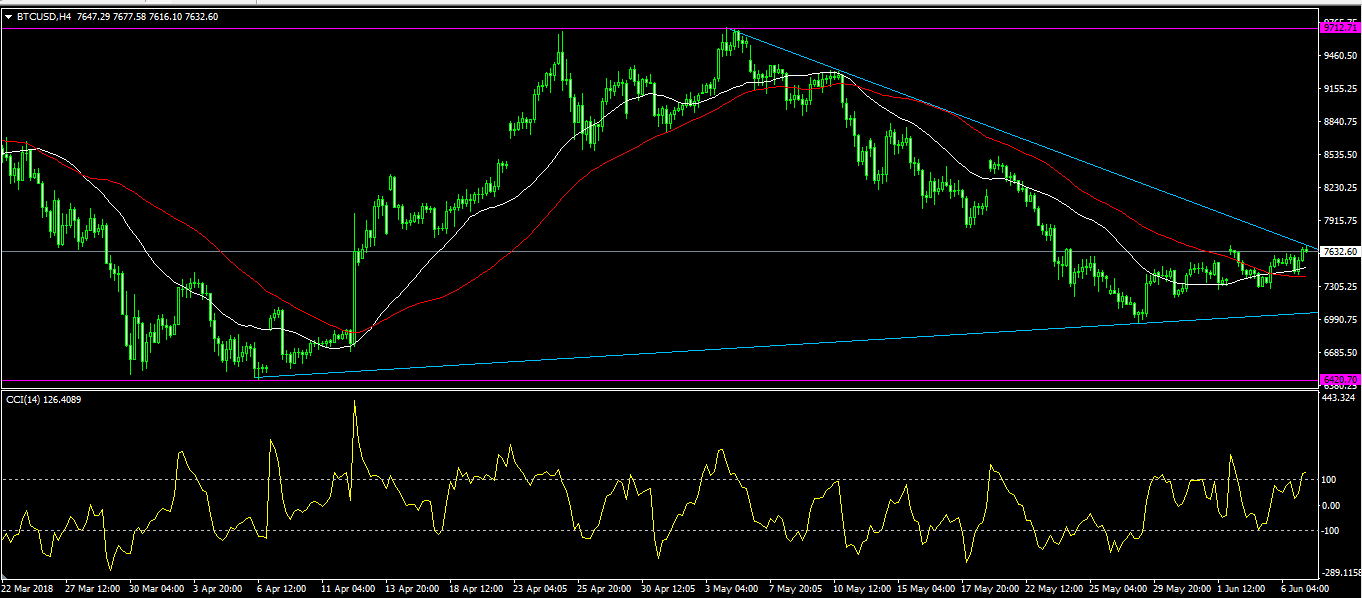
Bitcoin has fallen from a high of $9712 at the beginning of May and is currently trading at $7630. As shown below, the BTC/USD pair has formed a symmetrical triangle pattern and is trading slightly above the 30 and 60-day moving average. Its commodity channel index indicator is currently at an overbought level in the 4-hour chart. This means, that the pair could resume the downward momentum.
GBPUSD Strongly Bullish Above 1.3450 Level
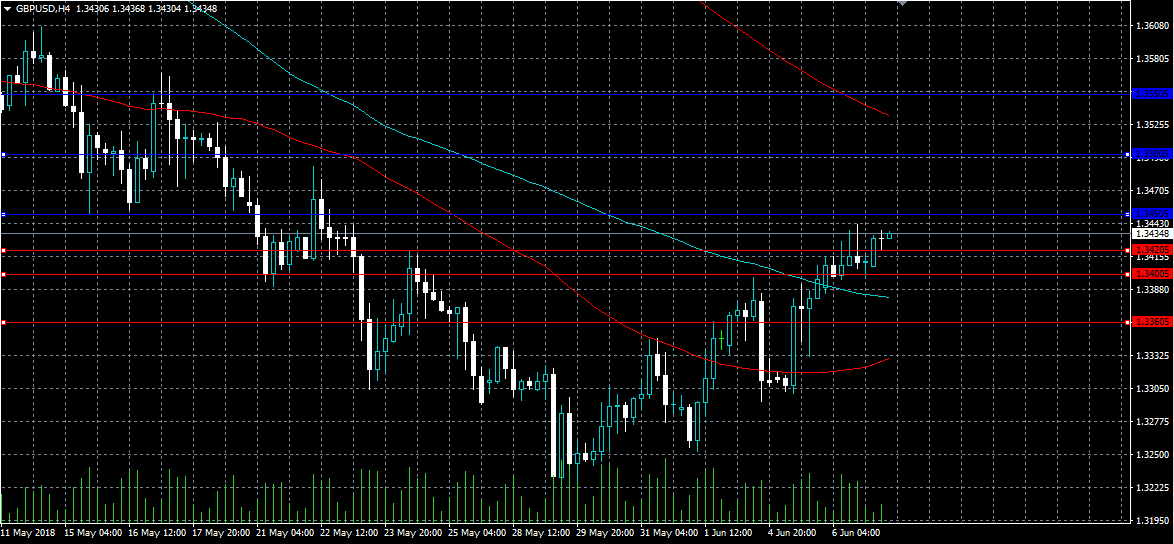
The British pound continues to move to fresh monthly trading-highs against the greenback, hitting 1.3442, as the US dollar index comes under strong selling pressure. The GBPUSD pair currently trades around the 1.3430 level, with further bullish advancement likely above the key 1.3450 resistance level. Sterling traders now look towards key US jobs data and a scheduled speech from Bank of England member David Ramsden.
The GBPUSD pair is strongly bullish while trading above the 1.3450 level, key technical resistance is now located at the 1.3500 and 1.3550 levels.
If the GBPUSD pair moves below the 1.3420 level, we may see sellers testing the 1.3400 and 1.3360 support levels.
EURUSD Further Bullish Above 1.1800 Level
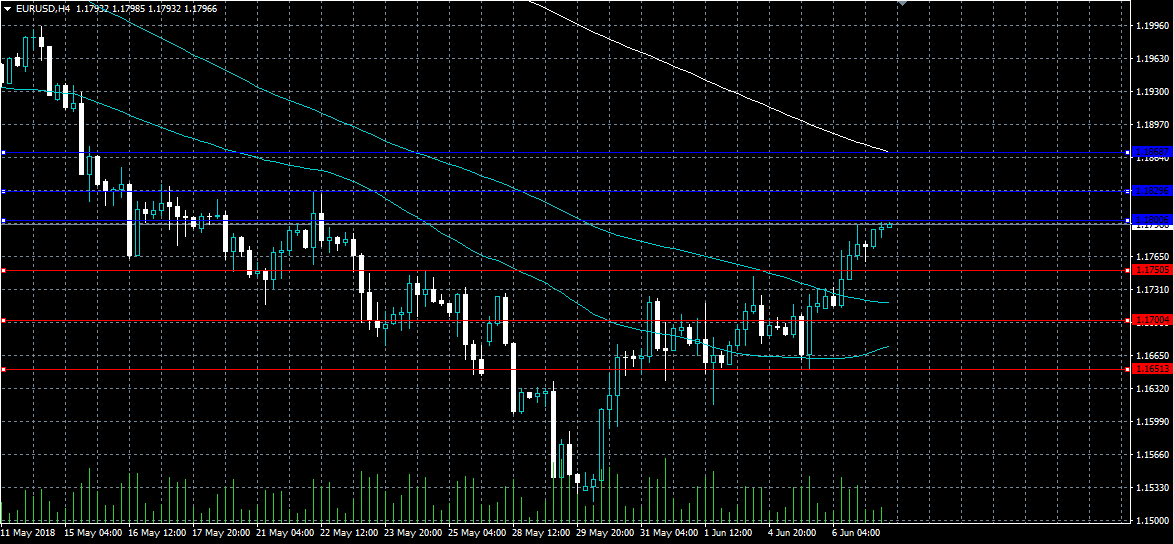
The euro continues to press against the 1.1800 level against the US dollar, as traders buy the single currency over reports that the ECB will soon be discussing an exit to its QE programme. The EURUSD pair is likely to see further gains above the 1.1800 level, as bullish sentiment surrounding the euro currency gathers pace. EURUSD traders await the release of key eurozone Gross Domestic Product data this morning, with expectations tilted to the upside.
The EURUSD pair is strongly bullish while trading above the 1.1800 level. Key resistance is now located at the 1.1829 and 1.1868 levels.
If the EURUSD pair moves below the 1.1750 level, sellers may push price towards the 1.1700 and 1.1651 support levels.
Elliott Wave View: Copper Next Extension Higher May Have Started
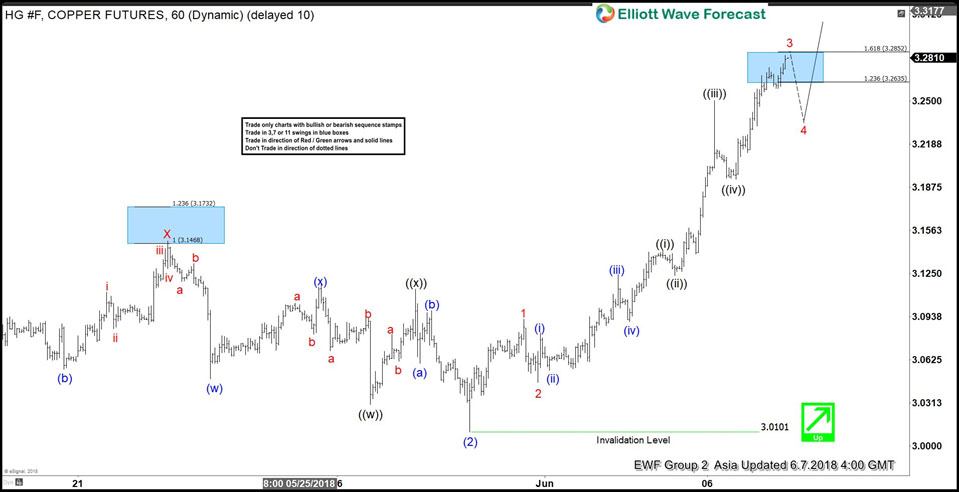
Copper ticker symbol: HG_F short-term Elliott wave view suggests that the pullback to 3.0101 on 5/30/2018 ended Intermediate wave (2). The internals of Intermediate wave (2) unfolded as Elliott wave double three structure where Minor wave W ended at 3.0195. Minor wave X ended at 3.1485 high and the decline to 3.0101 low ended Minor wave Y of (2).
Above from there, the metal has started the next extension higher in intermediate wave (3). The rally looks to unfolding as Elliott wave impulse with extension in Minor wave 3 higher. The internal sub-division of Minor wave 1 and 3 show 5 waves distribution, confirming the impulse structure. Up from 3.0101 low, the rally to 3.093 high ended Minor wave 1 in 5 waves structure. Afterwards, the pullback to 3.046 low ended Minor wave 2 and Minor wave 3 rally remains in progress and expected to complete soon. Once Minor wave 3 ends, Minor 4 pullback should take place in 3, 7 or 11 swings to correct cycle from 5/31 low before the metal extends higher again in Minor wave 5 to complete the 5 waves impulse structure from 3.0101 low within intermediate wave (3) higher. We don’t like selling the metal into a proposed pullback.
Copper 1 Hour Elliott Wave Chart
Italian Bonds Sold Off
Market movers today
This morning we published our biannual Big Picture publication ‘From boom to cruising speed', containing our updated macro forecast for the global economy. After a strong 2017, the global economy has lost some momentum in 2018. However, the global economy will still grow at a decent pace in 2018-19. Inflation pressures are set to rise only gradually, prompting cautious monetary policy tightening. The risks to our forecast are tilted to the downside from a possible Italian debt crisis and an escalation of global rade tensions.
With regard to today's economic data releases, we have another day of tier 2 data on the agenda. Initial jobless claims are likely to remain low, indicating a strong labour market. Final EA GDP figures are not expected to record any changes from the earlier releases.
The Turkish central bank announcement at 13:00 CEST will be in focus. We expect Turkey's central bank, the TCMB, to shift up its overnight rate corridor: a 50bp hike in its borrowing rate and a 75bp increase in its lending rate in order to normalise the monetary policy framework following the emergency hike in May 2018. See Flash Comment - Turkey: external pressures, emergency hike and the outlook for the TRY, 24 May.
Selected market news
Financial markets are in risk-on mode with both US and Asian equity markets advancing. The US S&P 500 index rose yesterday for the fourth consecutive day and the positive tone from the US spread to Asia, where most indices are advancing this morning. Hence, the markets for now seem to shrug off the growing tensions on the trade front , where the upcoming G7 meeting tomorrow and Saturday is likely to expose disagreement on the issue between the US on the one side and other G7 members, notably Canada and European countries, on the other, which have recently been hit by US steel and aluminium tariffs and have promised retaliatory measures.
While the US and Asian equity markets are advancing, the European markets remained under pressure given signals from the ECB of an imminent announcement on the end of Q E and renewed con cerns about Italy's new government's populist agenda. Yesterday, several ECB members provided hawkish comments, with ECB Chief Economist Peter Praet the most prominent , as he stressed the growing evidence about labour market tightening and wage growth provided. Market consensus is now swinging towards the ECB next week assessing the APP programme, but we stick to our view that an announcement on the end of QE and a change to forward guidance is premature at this meeting, while such changes are likely to come at the July or September meetings.
Italian bonds sold off yesterday after the new Prime Minister Giuseppe Conte's speech to the Italian senate on Tuesday. In it , he continued to pledge to lower income taxes and expand welfare payments, at the same time calling for a ‘radical' change to the eurozone economic ruleset . This unnerved investors, but we still lack a lot of details on the exact economic policy programme in order to gauge whether the government will indeed expand the deficit or rather phase in the new measures cautiously over time.
Euro Trading On A Stronger Footing, Ahead Of Crucial Euro-Zone 1Q GDP Numbers
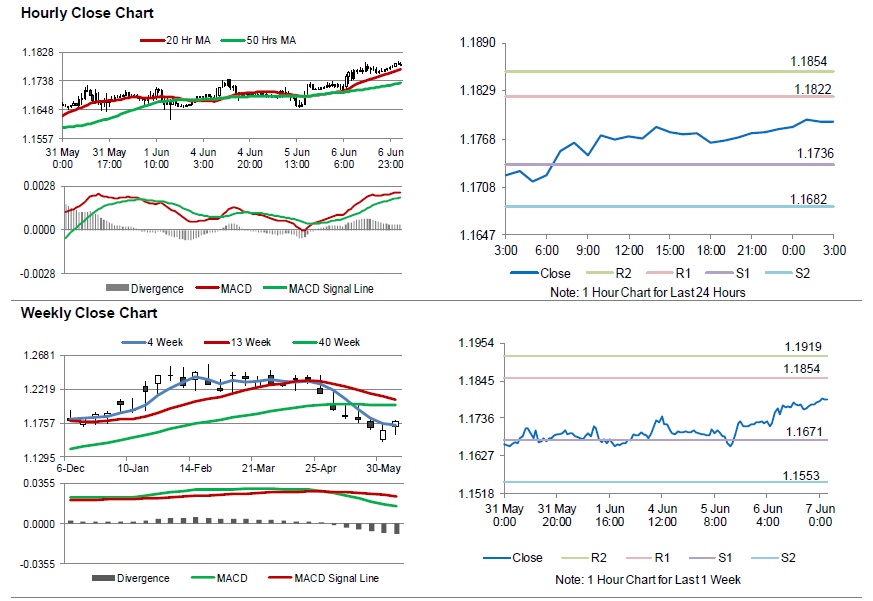
For the 24 hours to 23:00 GMT, the EUR rose 0.44% against the USD and closed at 1.1770, following bullish comments from European Central Bank’s Chief Economist, Peter Praet.
The ECB Chief Economist stated that the underlying strength in the economy will persist and inflation expectations were increasingly in line with the bank’s target. Further, he signalled the end of ECB’s money-printing programme in September.
Macroeconomic data released in the US indicated, that trade deficit unexpectedly narrowed to a seven-month low level of $46.2 billion in April, driven by an increase in the value of exports. The nation had registered a revised deficit of $47.2 billion in the prior month, while markets were expecting the nation to post a deficit of $49.0 billion. Meanwhile, the nation’s MBA mortgage applications rose 4.1% in the week ended 01 June, compared to a drop of 2.9% in the previous week.
In the Asian session, at GMT0300, the pair is trading at 1.1790, with the EUR trading 0.17% higher against the USD from yesterday’s close.
The pair is expected to find support at 1.1736, and a fall through could take it to the next support level of 1.1682. The pair is expected to find its first resistance at 1.1822, and a rise through could take it to the next resistance level of 1.1854.
Moving ahead, investors would closely monitor Euro-zone’s final 1Q GDP figures scheduled to release in a few hours. Additionally, Germany’s factory orders data for April, will be eyed by traders. Later in the day, the US initial jobless claims and consumer credit data for April, would pique significant amount of market attention.
The currency pair is trading above its 20 Hr and 50 Hr moving averages.