Sample Category Title
Sterling Extends Its Gains In The Asian Session
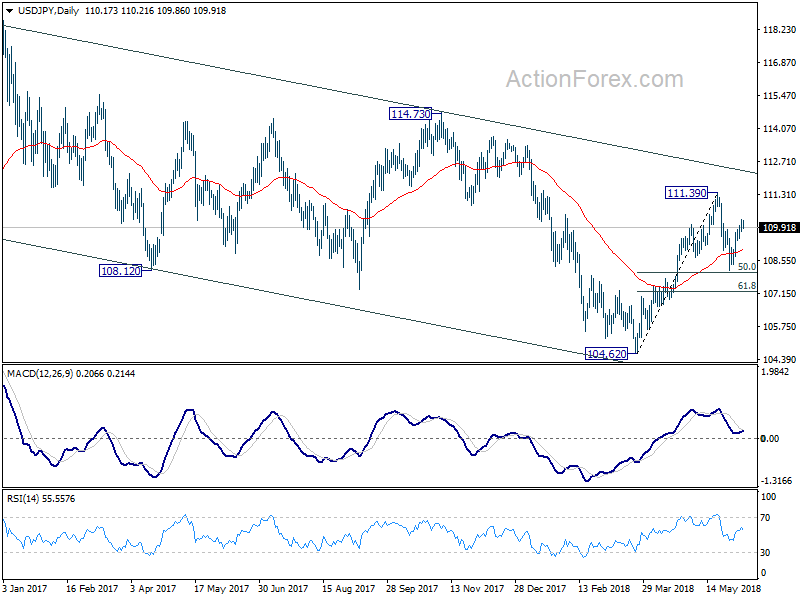
For the 24 hours to 23:00 GMT, the GBP rose 0.07% against the USD and closed at 1.3410.
In the Asian session, at GMT0300, the pair is trading at 1.3426, with the GBP trading 0.12% higher against the USD from yesterday’s close.
The pair is expected to find support at 1.3401, and a fall through could take it to the next support level of 1.3376. The pair is expected to find its first resistance at 1.3447, and a rise through could take it to the next resistance level of 1.3468.
In absence of key economic releases in the UK today, investor sentiment would be determined by global macroeconomic events.
The currency pair is trading above its 20 Hr and 50 Hr moving averages.
Japanese Yen Trading Higher, Ahead Of Japan’s 1Q GDP Data
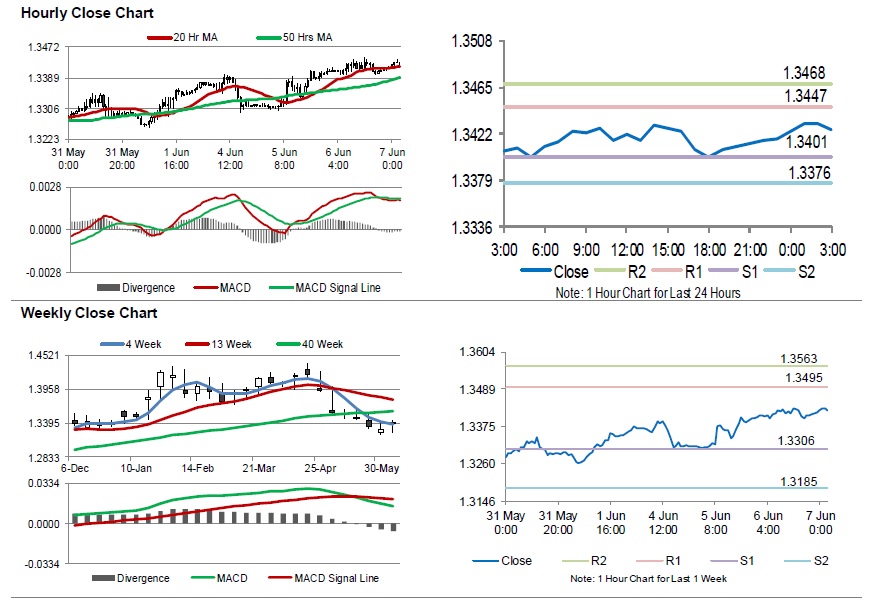
For the 24 hours to 23:00 GMT, the USD rose 0.36% against the JPY and closed at 110.21.
In the Asian session, at GMT0300, the pair is trading at 109.88, with the USD trading 0.30% lower against the JPY from yesterday's close.
The pair is expected to find support at 109.71, and a fall through could take it to the next support level of 109.54. The pair is expected to find its first resistance at 110.16, and a rise through could take it to the next resistance level of 110.44.
Trading trend in Japan is expected to be determined by the release of flash 1Q GDP and trade balance data for May, both scheduled to release overnight.
The currency pair is trading below its 20 Hr moving average and showing convergence with its 50 Hr moving average.
Switzerland’s Inflation Advanced Above Expectations In May
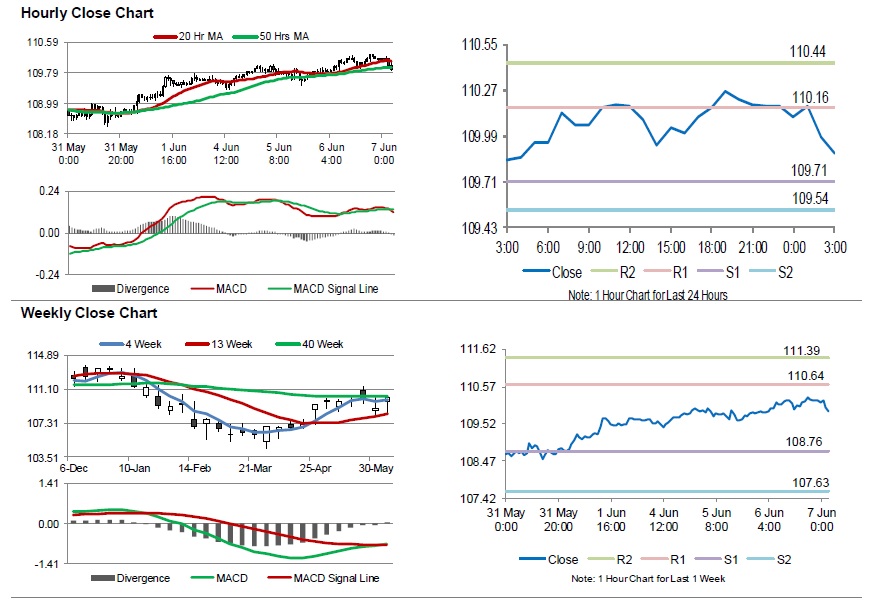
For the 24 hours to 23:00 GMT, the USD rose 0.20% against the CHF and closed at 0.9865.
Macroeconomic data indicated that Switzerland's consumer price index (CPI) rose by 0.4% on a monthly basis in May, more than market anticipation for a rise of 0.3%. The CPI had recorded a gain of 0.2% in the prior month.
In the Asian session, at GMT0300, the pair is trading at 0.9857, with the USD trading 0.08% lower against the CHF from yesterday's close.
The pair is expected to find support at 0.9834, and a fall through could take it to the next support level of 0.9811. The pair is expected to find its first resistance at 0.9883, and a rise through could take it to the next resistance level of 0.9909.
Moving forward, traders would closely monitor Switzerland's unemployment rate for May, set to release in a while.
The currency pair is trading below its 20 Hr and 50 Hr moving averages.
Canadian Trade Deficit Narrowed To A 6-Month Low Level In April
For the 24 hours to 23:00 GMT, the USD declined 0.08% against the CAD and closed at 1.2959.
On the macro front, Canada's trade deficit contracted to a 6-month low level of C$1.90 billion
in April, amid a surge in exports and decline in imports. The nation had posted a revised deficit of C$3.93 billion in the prior month.
Meanwhile, Canada's building permits retreated by 4.6% on a monthly basis in April, hitting a 5-month low and thereby signalling weakness in the residential and non-residential sectors. In the previous month, building permits had recorded a revised increase of 1.3%, while market participants anticipated for a drop of 1.0%. Further, the nation's seasonally adjusted Ivey PMI registered a drop to 62.5 in May. In the prior month, the PMI had recorded a reading of 71.5.
In the Asian session, at GMT0300, the pair is trading at 1.2946, with the USD trading 0.1% lower against the CAD from yesterday's close.
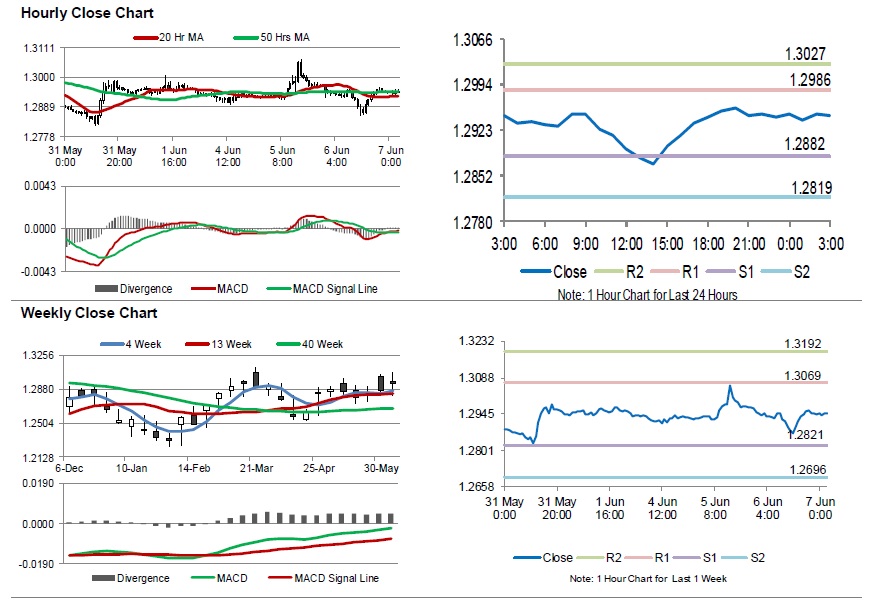
The pair is expected to find support at 1.2882, and a fall through could take it to the next support level of 1.2819. The pair is expected to find its first resistance at 1.2986, and a rise through could take it to the next resistance level of 1.3027.
With no macroeconomic releases in Canada today, investor sentiment will be determined by global macroeconomic factors.
The currency pair is trading above its 20 Hr moving average and showing convergence with its 50 Hr moving average.
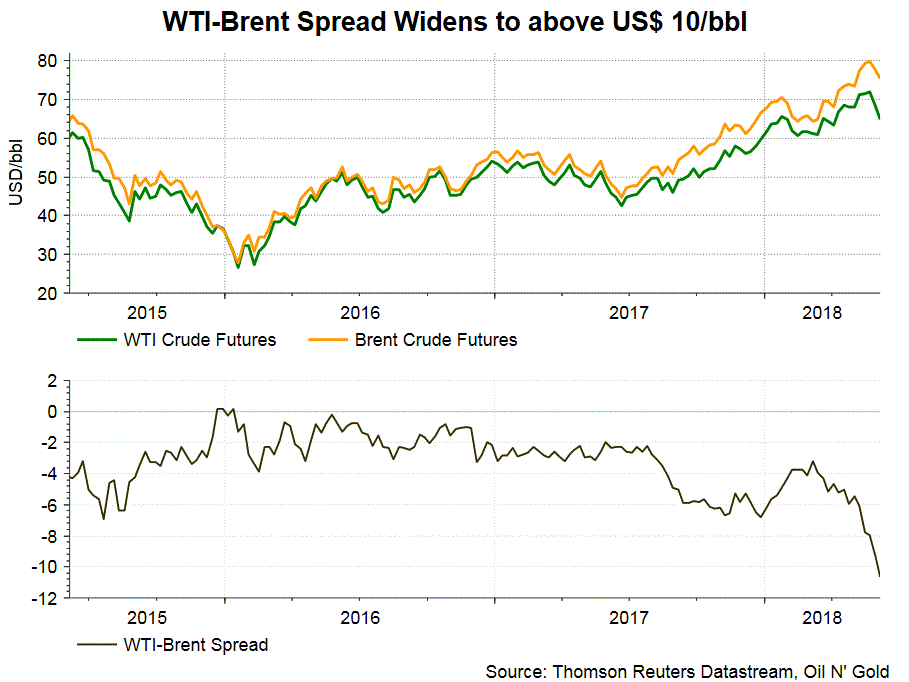
Concerns over Rising OPEC Supply Serve as Excuse for Profit- Taking
Crude oil prices remain under pressure after reaching 3.5-year highs in mid-May. While both benchmarks are declining, the selloff of WTI crude oil has been more severe than its Brent counterpart, resulting in a widening of WTI- Brent spread to a level not seen since March 2015 last Friday. We believe prices have peaked. Concerns over OPEC/non-OPEC supply increase and news about Trump's request on OPEC are just excuses for the bulls to take profit.
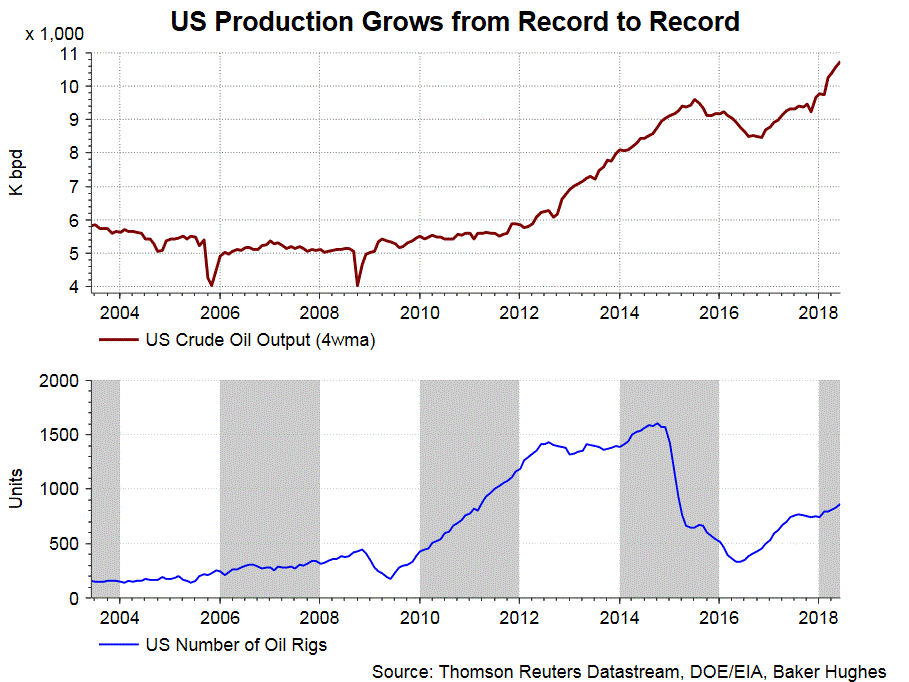
The recent crude oil uptrend, after bottoming out in January 2016, was anchored by OPEC/non -OPEC's output cut deal reached in November 2016. Despite ebbs and flows as US shale investments soar as prices increase, the uptrend remains intact and has recently been reinforced by US sanctions on Venezuela and potential sanctions on Iran. Reuters' estimate suggests that OPEC's production in May plunged, by -0.7M bpd, to 32M bpd, the lowest since April 2017. However, we believe the price levels (WTI above US$65/ bbl, Brent above US$70/ bbl) are overextended with US output also in its uptrend and above 10M bpd. US producers are so tempted to increase output with oil prices at those levels.
Concerns over Rising Supply
A Bloomberg report on June 5 revealed that the White House has secretly asked Saudi Arabia and some other OPEC producers to raise oil production by about 1M bpd. The request appears unexpected but is probably consistent with US President Trump's erratic style. Back in April, Trump complained about OPEC's policy and its impact on oil price. As he tweeted on April 20, “looks like OPEC is at it again. With record amounts of Oil all over the place, including the fully loaded ships at sea, Oil prices are artificially Very High! No good and will not be accepted!”. The rare request is indeed consistent with his populist stance as it come at a time when US retail gasoline prices surged to a 3-year high.
The news came in two weeks after the news that the OPEC/non- OPEC producers would discuss gradually removing the output ceiling later in June. Concerns over rising supply have swiftly overshadowed potential production loss from Venezuela and Iran. Russia's oil minister Alexander Novak noted that the delegates would discuss "gradual output recovery" at the meeting. Meanwhile, Indian Oil Minister Dharmendra Pradhan quoted Saudi Arabia's oil minister Khalid al-Falih as saying, during the International Energy Forum, that they are "revisiting" the "policy on oil output cuts”. We do not think the OPEC/ non-OPEC producers have a strong view on whether they should raise output or not. Their decision at the meeting on June 22 is largely contingent on oil price movement. As such, oil price actions matter a lot for the coming two weeks ahead of the OPEC/non-OPEC meeting.
EIA Weekly Inventory Report
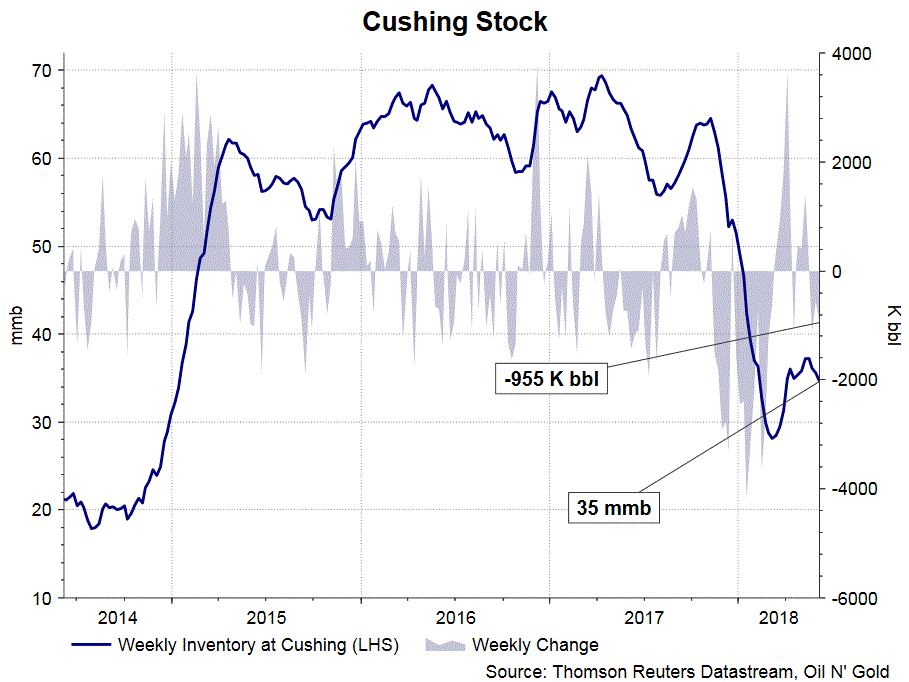
The report from the US Energy Information Administration (EIA) shows that total crude oil and petroleum products stocks increased +1.58 mmb to 1209.76 mmb in the week ended June 1. Crude oil inventory gained +2.07 mmb (consensus: -1.82 mmb) to 436.58 mmb, as inventories increased in 3 out of 5 PADDs. Cushing stock slipped -0.96 mmb to 34.59 mmb. Utilization rate added +1.5% to 95.4%. Meanwhile, crude production increased +0.03M bpd to 10.8M bpd for the week.
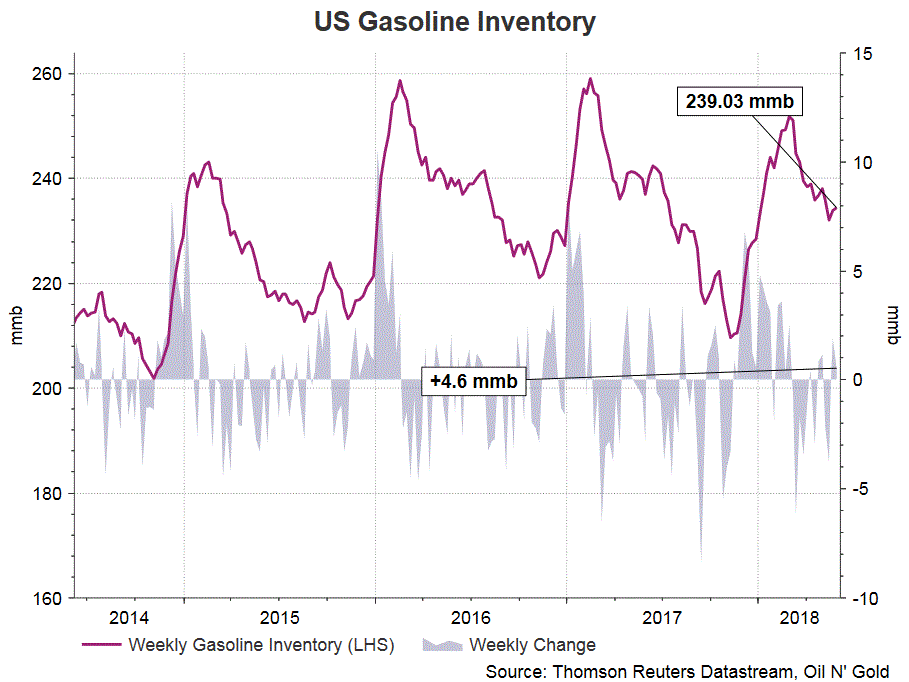
Refined oil product inventories rose further. Gasoline inventory soared +4.6 mmb to 239.03 mmb as demand plunged -7.36% to 8.98M bpd. The market had anticipated a +0.59 mmb increase in stockpile. Production fell -7.43% to 9.66M bpd while imports fell -18.98% to 0.78M bpd during the week.
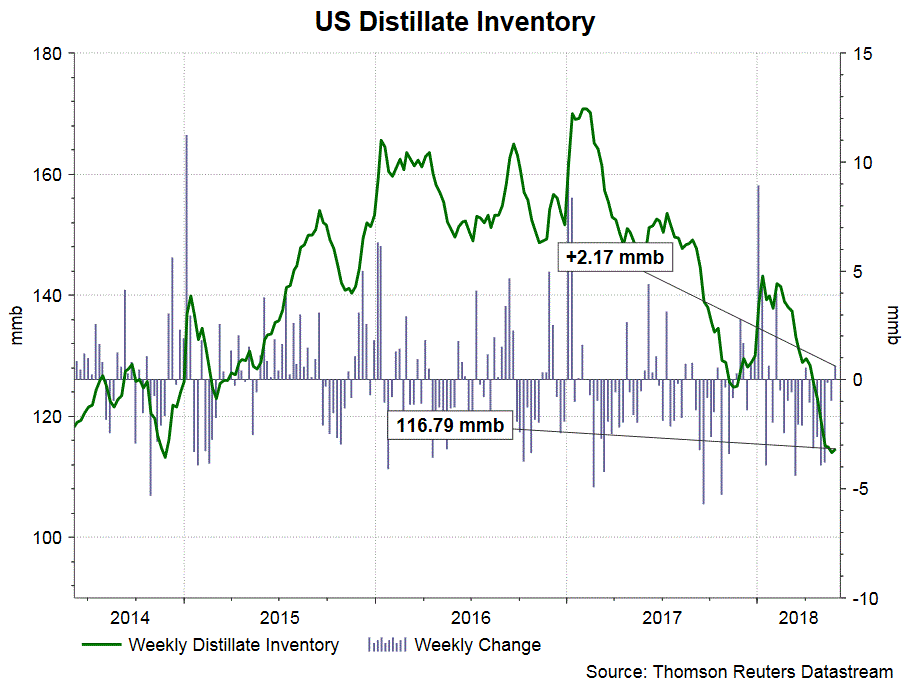
Distillate inventory increased for a second consecutive week, adding +2.17 mmb to 116.79 mmb. The market had anticipated a +0.78 mmb gain. This came in as a result of a -18.92% decline in demand to 3.5M bpd. Production gained +0.53% to 5.32M bpd while imports slumped -38.4% to 0.15M bpd during the week.
Released after market close on Tuesday, the industry- sponsored API estimated that crude oil inventory dropped -2.03 mmb during the week. For refined oil products, gasoline stockpile rose +3.76 mmb while distillate slipped -0.87 mmb.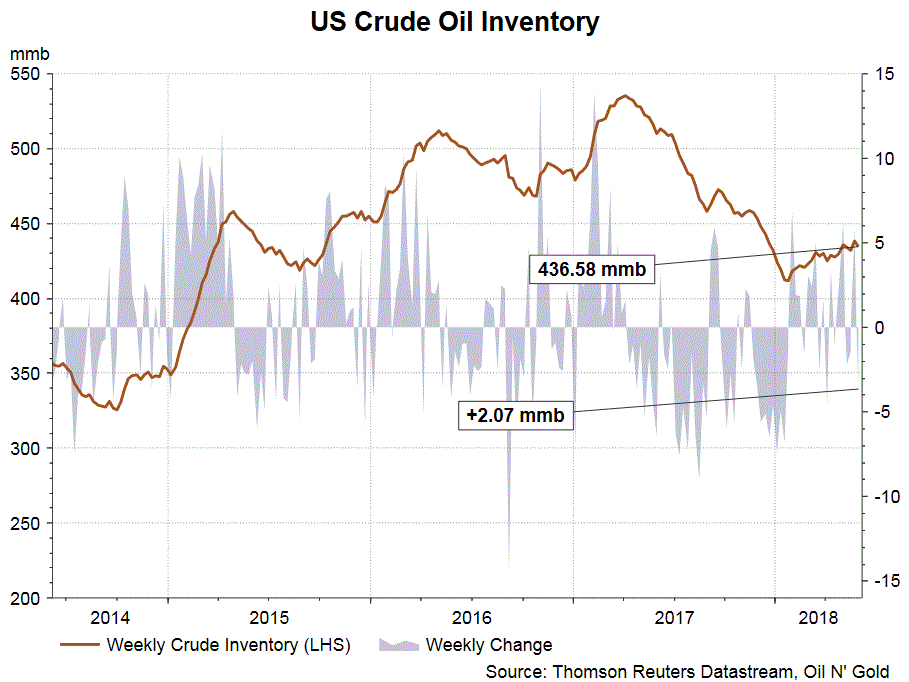
Australia’s Trade Surplus Narrowed More Than Estimated In May
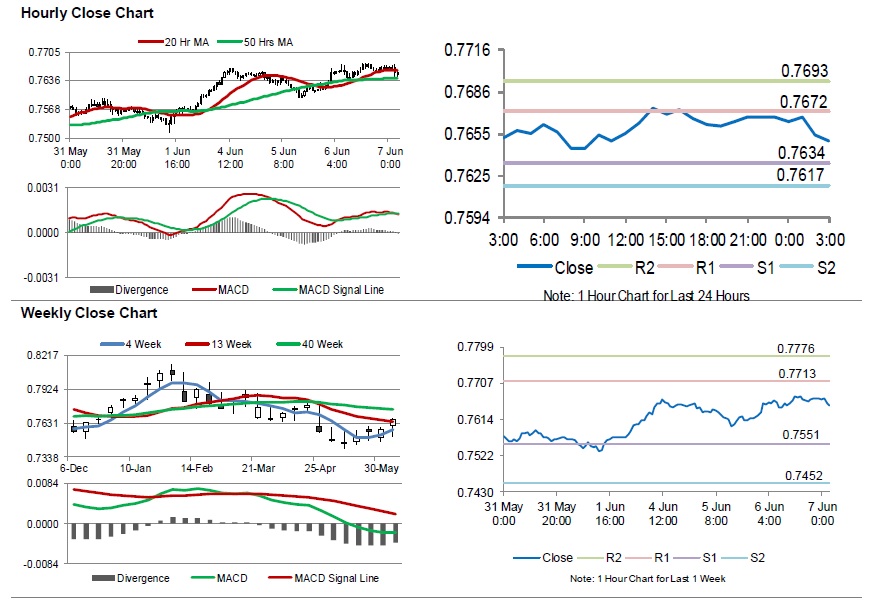
For the 24 hours to 23:00 GMT, the AUD rose 0.59% against the USD and closed at 0.7664.
LME Copper prices declined/rose 2.52% or $176.0/MT to $7147.0/MT. Aluminium prices rose 0.13% or $3.0/MT to $2317.5/MT.
In the Asian session, at GMT0300, the pair is trading at 0.7650, with the AUD trading 0.18% lower against the USD from yesterday's close.
Overnight data indicated that Australia's AIG performance of construction index declined to a level of 54.0 in May, compared to a reading of 55.40 in the previous month.
Moreover, the nation's seasonally adjusted trade surplus narrowed to AUD977.0 million in May, from a revised trade surplus of AUD1731.0 million in the prior month. Market participants had envisaged trade surplus to fall to AUD1000.0 million.
The pair is expected to find support at 0.7634, and a fall through could take it to the next support level of 0.7617. The pair is expected to find its first resistance at 0.7672, and a rise through could take it to the next resistance level of 0.7693.
The currency pair is trading between its 20 Hr and 50 Hr moving averages.
Gold: Yellow Metal Reverses Its Losses In The Asian Session
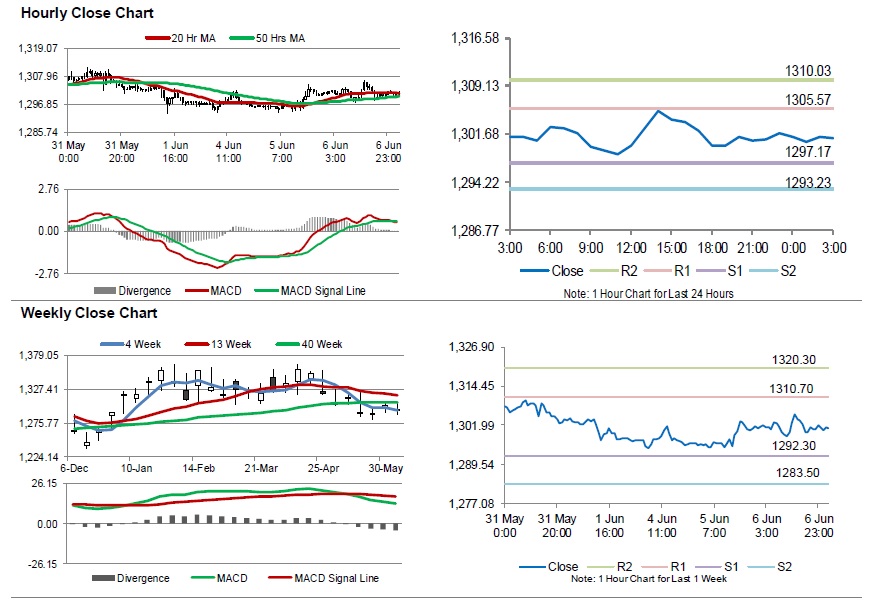
For the 24 hours to 23:00 GMT, Gold declined 0.13% against the USD and closed at USD1299.90 per ounce, amid strength global equities.
In the Asian session, at GMT0300, the pair is trading at 1301.10, with gold trading 0.09% higher against the USD from yesterday’s close.
The pair is expected to find support at 1297.17, and a fall through could take it to the next support level of 1293.23. The pair is expected to find its first resistance at 1305.57, and a rise through could take it to the next resistance level of 1310.03.
The yellow metal is showing convergence with its 20 Hr moving average and trading above its 50 Hr moving average.
Silver: White Metal Trading On A Weaker Footing This Morning
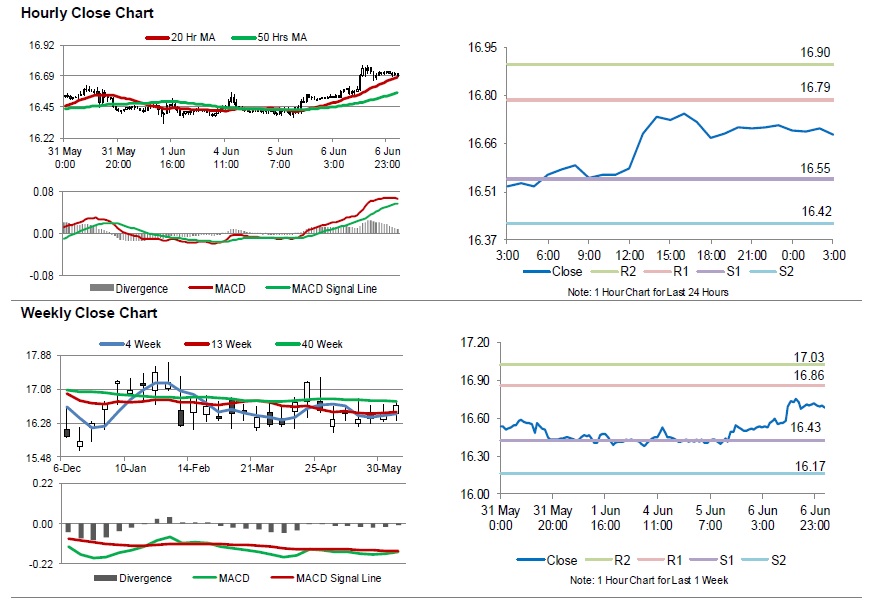
For the 24 hours to 23:00 GMT, Silver rose 1.15% against the USD and closed at USD16.71 per ounce.
In the Asian session, at GMT0300, the pair is trading at 16.69, with silver trading 0.15% lower against the USD from yesterday’s close.
The pair is expected to find support at 16.55 and a fall through could take it to the next support level of 16.42. The pair is expected to find its first resistance at 16.79, and a rise through could take it to the next resistance level of 16.90.
The white metal is showing convergence with its 20 Hr moving average and trading above its 50 Hr moving average.
Crude Oil: Oil Extends Its Losses In The Morning Session
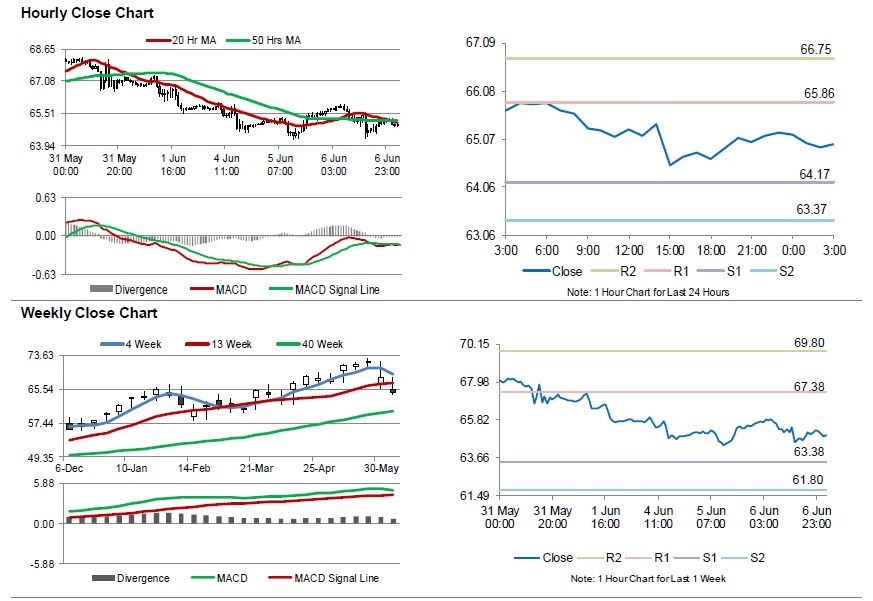
For the 24 hours to 23:00 GMT, Crude Oil declined 0.61% against the USD and closed at USD65.09 per barrel, after the Energy Information Administration (EIA) report indicated that US crude oil stockpiles unexpectedly rose 2.1 million barrels to 436.6 million barrels in the week ended 01 June.
Additionally, the EIA also reported that US crude oil production rose by 31,000 bpd to 10.8 million bpd last week.
In the Asian session, at GMT0300, the pair is trading at 64.96, with oil trading 0.2% lower against the USD from yesterday’s close.
The pair is expected to find support at 64.17, and a fall through could take it to the next support level of 63.37. The pair is expected to find its first resistance at 65.86, and a rise through could take it to the next resistance level of 66.75.
Crude oil is showing convergence with its 20 Hr moving average and trading below its 50 Hr moving average.
USD/JPY Daily Outlook
Daily Pivots: (S1) 109.88; (P) 110.08; (R1) 110.38; More...
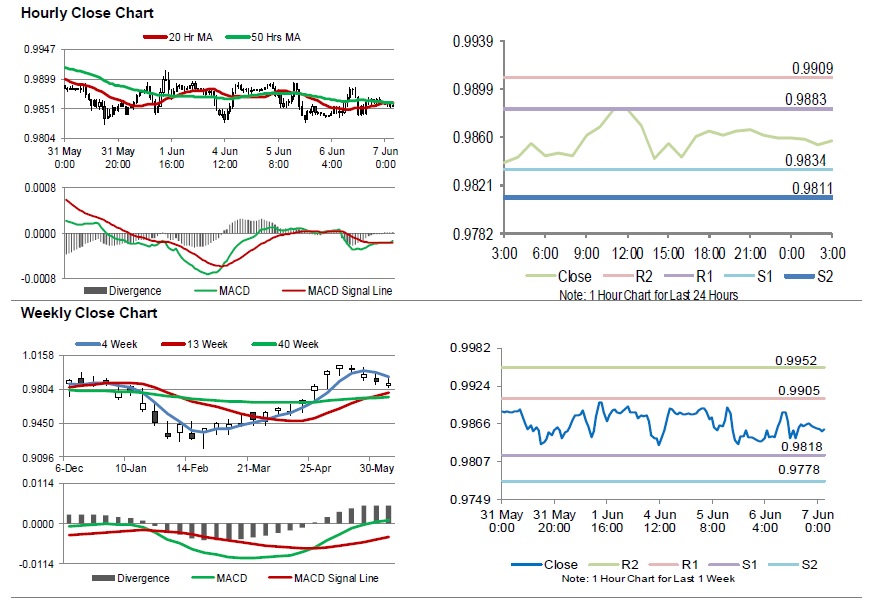
USD/JPY lost some upside momentum after hitting 110.26. But still, rebound from 108.10 is expected to continue with 109.46 minor support intact. Further rally would be seen back to retest 111.39 resistance. Break will resume the rebound from 104.62 and target a test on 114.73 key resistance level. However, on the downside, below 109.36 minor support will delay the bullish case and turn bias to the downside for 108.10 support again.
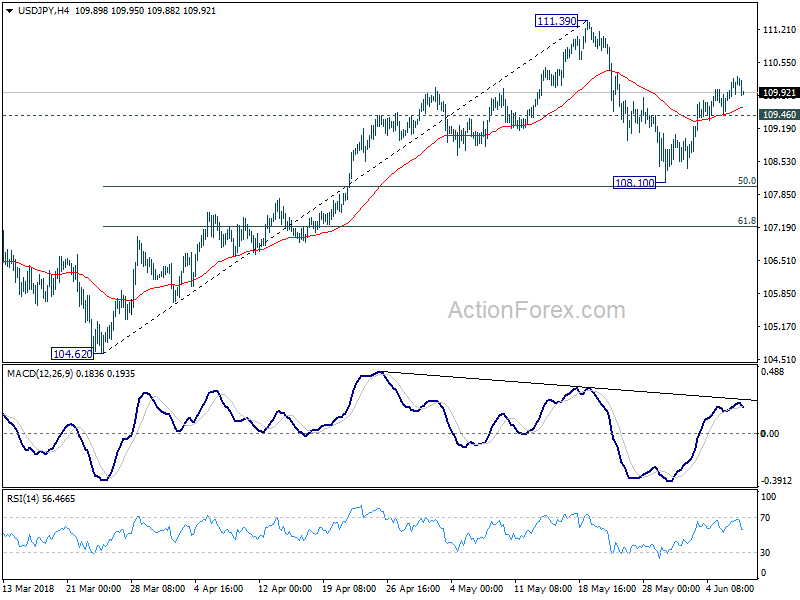
In the bigger picture, at this point , we're slightly favoring the case that corrective decline from 118.65 (2016 high) has completed with three waves down to 104.62. Above 111.39 will affirm this view and target 114.73 for confirmation. However, it should be noted that USD/JPY is bounded in medium term falling channel from 118.65 (2016 high). Sustained break of 61.8% retracement of 104.62 to 111.39 at 107.20 will likely resume the fall from 118.65 through 104.62 low.