Sample Category Title
EURUSD Analysis: Remains Bullish
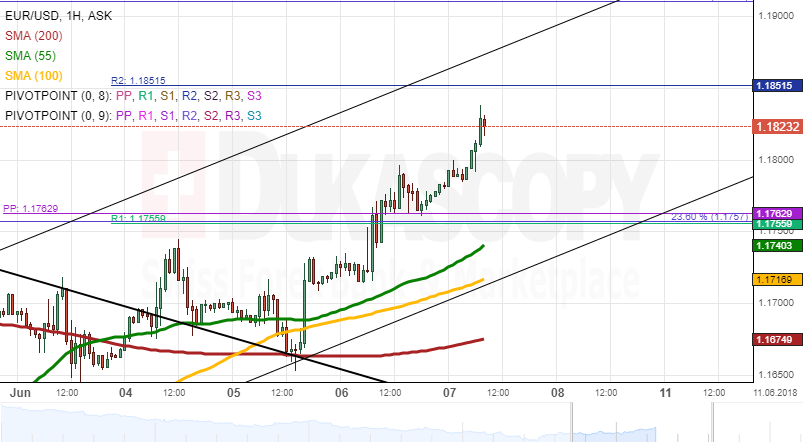
The Euro was boosted by fundamentals on Wednesday. It surged past the monthly PP, the weekly R1 and the 23.60% Fibonacci retracement following a comment by the ECB Chief Economist Peter Praet about inflation approaching the bank's set target rate. As a result, EUR/USD was able to reach the psychological 1.18 mark by this morning.
Some upside potential is still apparent in the market. Two possible target points are the weekly R2 and the 200-period (4H) SMA at 1.1850 and 1.1900, respectively. A test of the latter would provide another confirmation of a short-term ascending channel.
On the other hand, the Euro might ease its upward pressure for a few hours. However, the 55– and 100-hour SMAs should provide support, thus preserving the general bullish tendency this week.
GBPUSD Analysis: Likely To Target 1.35
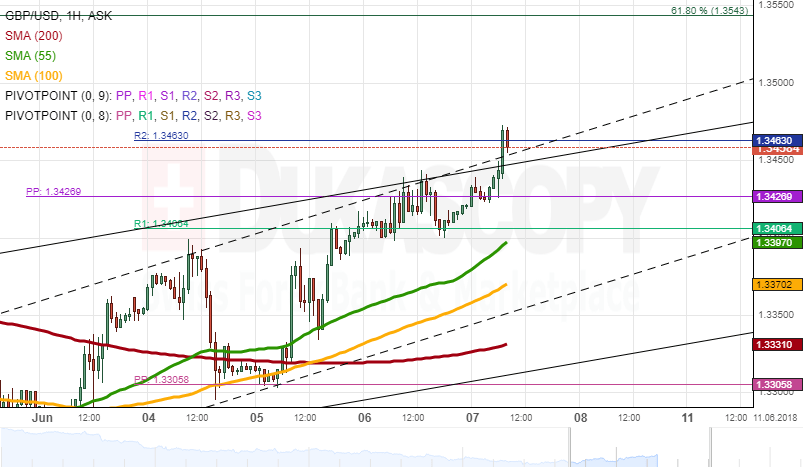
The GBP/USD exchange rate was trading sideways for the whole session on Wednesday. The upside was restricted by the monthly PP near 1.3440, while support was provided by the weekly R1 at 1.3408.
The pair is trading near the upper boundaries of two short-term channels. This might point to soon decline. However, it is expected that the Pound still edges slightly higher during the first part of the day up until the 1.35 mark. Bears should subsequently lead the rate back down to the 55– and 100-hour SMAs near 1.3350.
As apparent on the daily chart, the general tendency for the following trading sessions should be north until the 200-day SMA at 1.36, at least, is reached.
USDJPY Analysis: Stranded Between Strong Levels
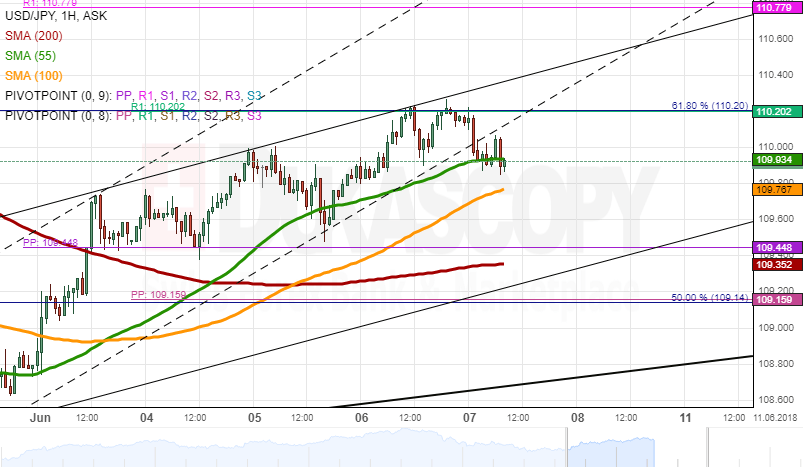
The Greenback gained strength against the Yen for the second consecutive session yesterday. The pair's surge was stopped by the 200-day SMA, the weekly R1 and the 61.80% Fibonacci retracement at 110.20.
After failing to breach the strong resistance of these two levels and the upper boundary of a one-week channel, the rate breached a more junior pattern early today, thus erasing all Wednesday gains along the way.
Despite this being a bearish signal, the US Dollar is likely to hinder near the 100-period (4H) SMA located at 109.85. This line and the 200-day SMA at 110.20 could pressure the rate from both sides, thus limiting large gains today.
In case the current support surrenders, the subsequent decline should not exceed 109.40, while the upper daily limit is the monthly R1 at 110.80.
Gold Analysis: Waits For Breakout
XAU/USD was trading in a narrow range on Wednesday and early on Thursday. The upper limit was set by the monthly PP, the 55-period (4H) SMA and the 50.00% Fibo retracement at 1,30.00, while the lower one—by the combination of the 55– and 100-hour and the 100-period (4H) moving averages near 1,295.00.
A breakout should occur soon. Technical indicators are in favour of the bearish scenario. This would send the pair past the bottom line of a one-month channel and down to the 1,290.00 mark.
Conversely, the yellow metal is expected to target the 1,310.00 area if its current resistance cluster is surpassed.
Forex Technical Analysis: EUR/USD, USD/JPY, GBP/USD
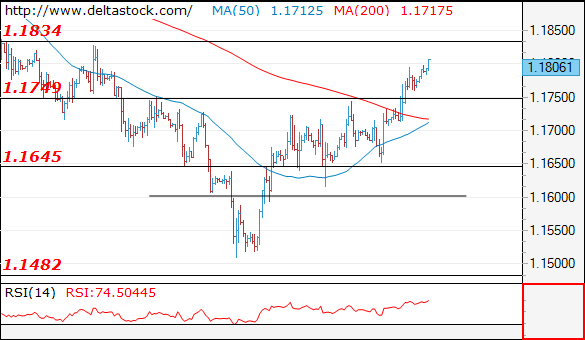
EUR/USD
Current level - 1.1806
The uptrend here is on its way for a tight test of 1.1830 resistance and I expect a reversal around that level to trigger a sell-off towards 1.1650. An eventual break through 1.1830 will clear all the way up to 1.2060.
| Resistance | Support | ||
| intraday | intraweek | intraday | intraweek |
| 1.1830 | 1.1830 | 1.1750 | 1.1480 |
| 1.1910 | 1.2060 | 1.1650 | 1.1300 |
 USD/JPY
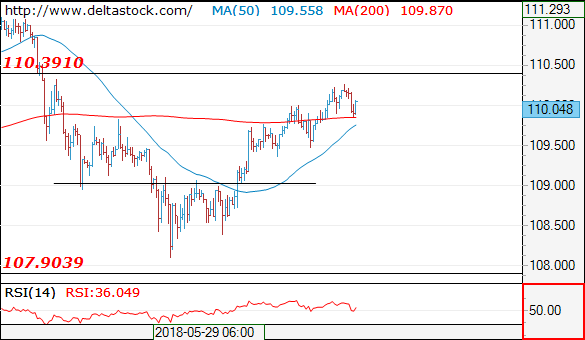
Current level - 110.04
My outlook is already counter-trend below 110.40, for a reversal and dive towards 109.00 area.
| Resistance | Support | ||
| intraday | intraweek | intraday | intraweek |
| 110.40 | 111.40 | 109.45 | 107.80 |
| 111.40 | 114.40 | 108.40 | 106.70 |
GBP/USD
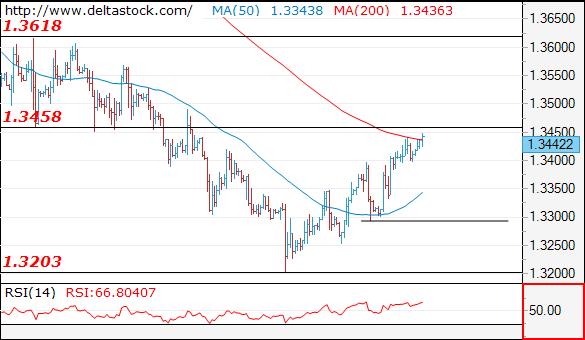
Current level - 1.3442
As the pair is approaching 1.3460 resistance area I favor a reversal, for a downswing towards 1.3290. An eventual break through 1.3460 area will challenge 1.3620 zone.
| Resistance | Support | ||
| intraday | intraweek | intraday | intraweek |
| 1.3460 | 1.3618 | 1.3380 | 1.3210 |
| 1.3620 | 1.3990 | 1.3290 | 1.3040 |
Markets Steady Ahead Of G7 Summit, Euro GDP In Focus
Investors may decide to embrace a cautious approach by evading riskier assets ahead of the 44thG7 summit that is due to take place on Friday.
Market volatility could be slightly muted today as anticipation mounts over the various scenarios that may play out when Donald Trump meets his G7 partners in Quebec. With the Director of the National Economic Council, Larry Kudlow, stating on Wednesday that Trump is sticking with a hardline stance on trade, expectations for a resolution this week remain low. However, when dealing with the ever-unpredictable Trump administration, investors should always be prepared to expect the unexpected. Any signs of the United States potentially rolling back steel and aluminium tariffs on Canada and the European Union could ease trade war fears.
Euro higher ahead of GDP report
Buying sentiment towards the Euro received a solid boost after comments from ECB chief economist Peter Praet elevatedexpectations thatthe European Central Bank will be winding down its stimulus program.
According to Praet, robust economic growth has boosted confidence over inflation reaching the 2% target.With such hawkish comments fuelling speculation over the ECB revealing more about its bond-buying programme as soon as next week, the Euro could venture higher. While the improving economic conditions in Europe could continue supporting the Euro, political risk may threaten upside gains.
Today’s main event risk in Europe will be the third estimate of the first quarter GDP, which is expected to confirm that economic activity cooled from 2.8% to 2.5% YoY. Although such a result may pressure the Euro, the currency remains supported by expectations of QE potentially ending this year.
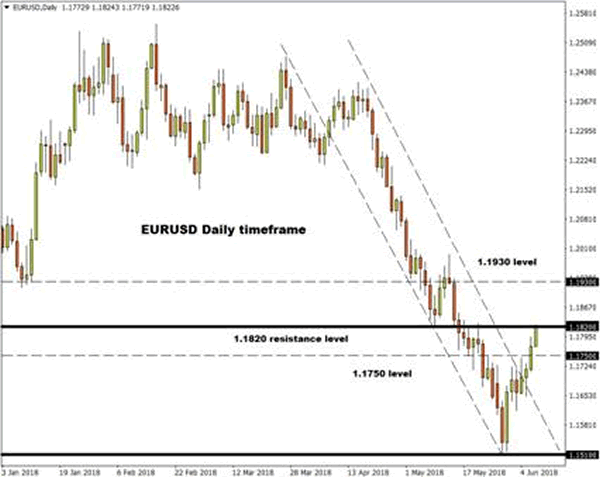
Taking a look at the technical picture, the EURUSD has marched to a fresh two-week high above 1.1810 as of writing. A solid break above 1.1820 could encourage an incline higher towards 1.1930. Alternatively, a failure for prices to conquer the 1.1820 level could result in a decline back towards 1.1750.
Commodity – WTI Oil
Oil markets are likely to remain in limbo ahead of the upcoming OPEC meeting on 22 June.
The depreciation of Oil witnessed in recent weeks continues to highlight how geopolitical risk factors are unable to sustain the bull rally. Market players are more concerned with the overall supply concerns and this is reflected in the depressed price action. With expectations heightened over OPEC and its allies easing production curbs to counteract falling output from Venezuela and Iran, WTI could be poised for further punishment. It must be kept in mind that rising output from Russia and OPEC combined with surging US Shale production could revive the oversupply concerns – ultimately haunting investor attraction towards Oil.
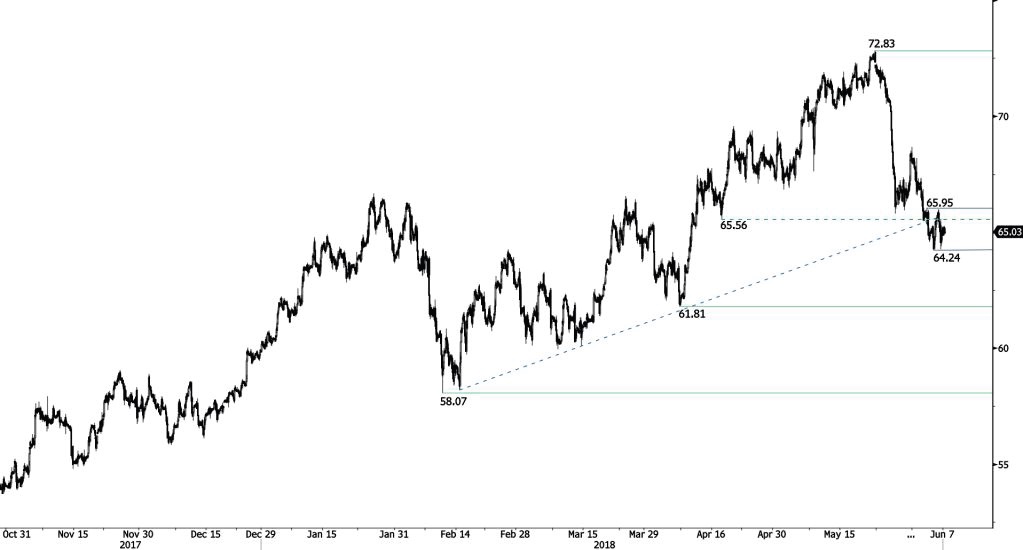
Focusing on the technical picture, WTI Oil is under pressure on the daily charts. Sustained weakness below $66 could encourage a decline towards $64.30 and $64.00, respectively.
Currency spotlight – GBPUSD
This has been a positive trading week for the GBPUSD, mostly thanks to a weakening US Dollar. With the bearish fundamentals behind the Pound’s weakness still intact, it will be interesting to see how much further the GBPUSD rebounds before bears attack again.
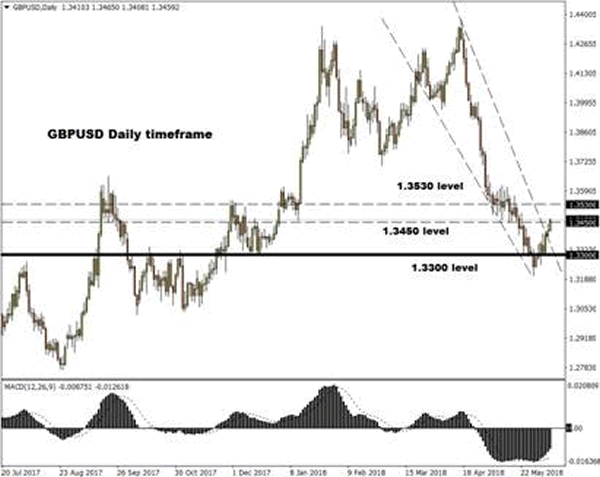
Taking a look at the technical picture, the GBPUSD is in the process of a technical bounce on the daily charts with prices trading around 1.3450 as of writing. A breakout above 1.3450 could encourage an incline higher towards 1.3530. Alternatively, a failure for bulls to conquer the 1.3450 level could result in prices sinking back towards 1.3380 and 1.3300, respectively.
AUDUSD Outlook – Bulls Show Strong Hesitation At Key Trendline / Fibo Barrier
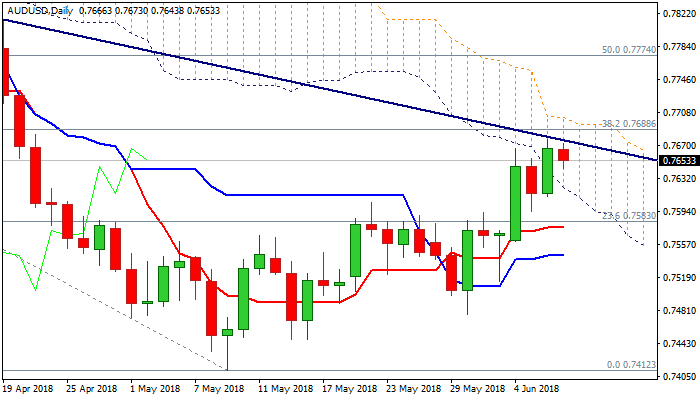
The Aussie dollar holds in red in early European trading after upside attempts were repeatedly capped by bear-trendline at 0.7674 (drawn off 0.7988, 11 Feb high) and additional pressure came from weaker than expected Australia’s trade data.
April trade surplus narrowed to A$ 0.977B from previous month’s A$ 1.73B surplus and also fell below expectation at A$0.98B.
Double failure and subsequent easing validates trendline resistance, the lower boundary of strong resistance zone between 0.7674 (trendline) and 0.7688 (Fibo 61.8% of 0.8135/0.7412 fall).
Bulls may show stronger hesitation here and may hold in extended consolidation before fresh attempts higher.
However, risk of pullback exists as bullish structure could be hurt by weakening momentum and overbought slow stochastic on daily chart.
Extended dips should hold above 0.7610 (daily cloud base / 55SMA) to keep bulls in play for renewed attack at trendline / Fibo barriers.
Sustained break higher would trigger stops parked above and spark fresh bullish acceleration towards next strong barriers at 0.7729 (100SMA) and 0.7752 (200SMA).
Negative scenario on break and close below daily cloud would risk deeper fall and put bulls on hold.
Res: 0.7674, 0.7688, 0.7718, 0.7729
Sup: 0.7643, 0.7630, 0.7610, 0.7588
CRUDE OIL Sideways Range
Crude oil bounce from 64.22 (05/06/2018 low) continues, approaching 66. Hourly support and resistance are given at 61.81 (06/04/2018 low) and 72.83 (22/05/2018 high). The technical structure suggests short-term increase.
In the long-term, crude oil has recovered after its sharp decline last year. However, we consider that further weakness is very likely. For the time being, the pair lies in an upside trend since June 2017. Support lies at 42.20 (16/11/2016) while resistance is located at 77.83 (20/11/2014). Crude oil is trading largely above its 200 DMA.
GBP/JPY Daily Outlook
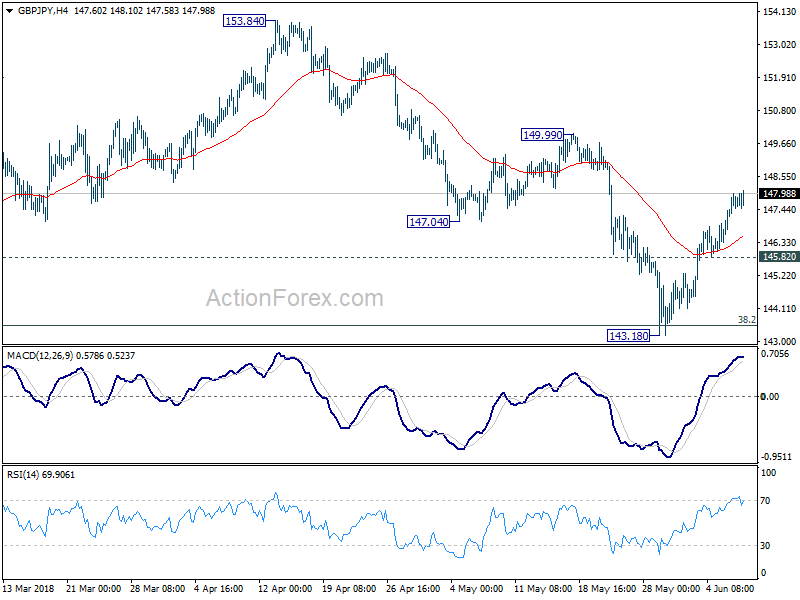
Daily Pivots: (S1) 147.15; (P) 147.58; (R1) 148.22; More...
Intraday bias in GBP/JPY remains on the upside as rebound from 143.18 is in progress. 149.99 resistance is the next target and break there will pave the way to retest 153.84 high. On the downside, break of 145.82 minor support will argue that the rebound is completed and bring retest of 143.18 low.
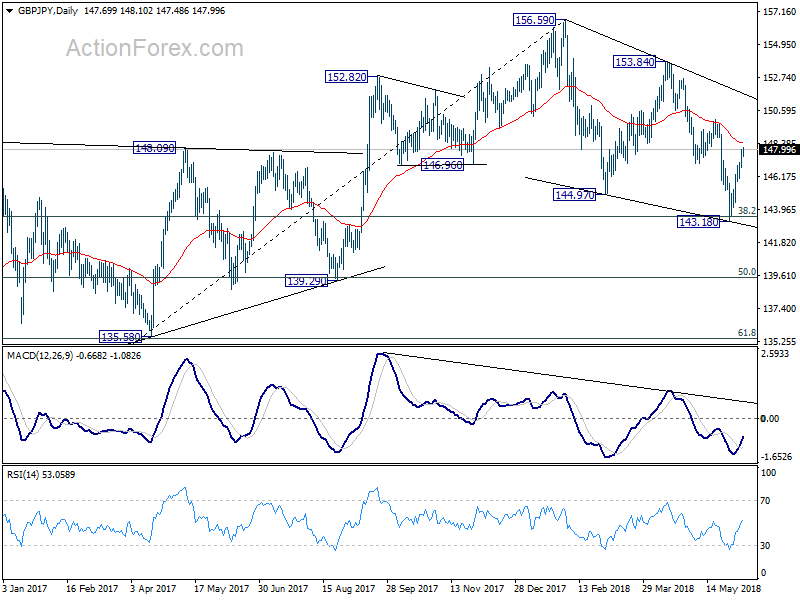
In the bigger picture, no change in the view that decline from 156.59 is a corrective move. In case of another fall, strong support should be seen above 139.29 cluster support (50% retracement of 122.36 to 156.59 at 139.47) to contain downside and bring rebound. Meanwhile, break of 153.84 should confirm that the correction is completed and target 156.59 and above to resume the medium term up trend.
SILVER The Resistance At 16.62 Has Been Broken
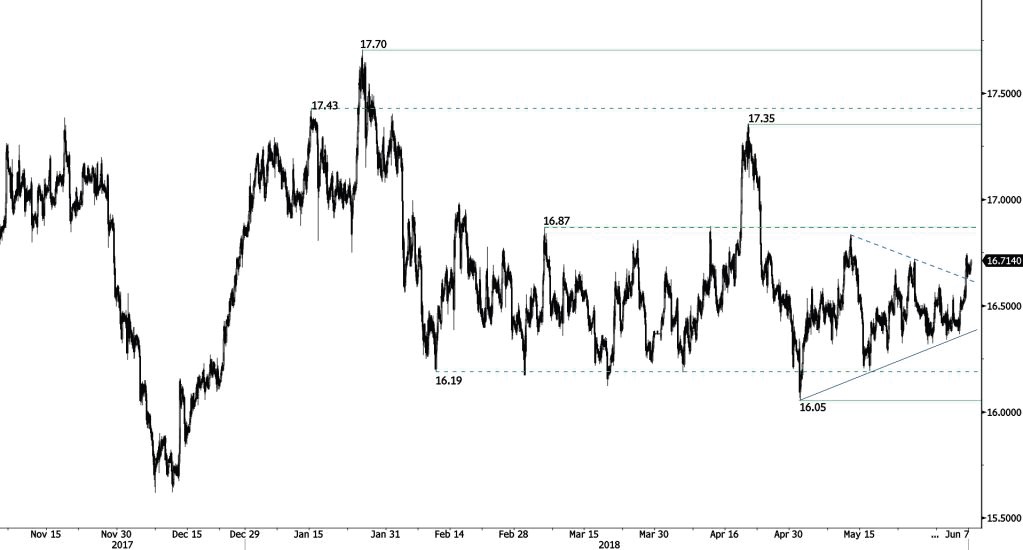
Silver strong bounce from 16.36 low continues, trading above 16.55 and heading along 16.60. The short-term succession of higher lows continues to favour a bullish bias as long as uptrend floor holds. Hourly support and resistance are given at 16.05 (01/05/2018 low) and 17.35 (19/04/2018 high). The technical structure suggests short-term upward moves.
In the long-term, the trend remains negative/ sideways. Further downside is very likely. Resistance is located at 21.58 (10/07/2014 high). Strong support can be found at 11.75 (20/04/2009). The pair is trading below its 200 DMA.