Sample Category Title
AUDJPY Upswing Falters Again; Stuck Within Recent Range
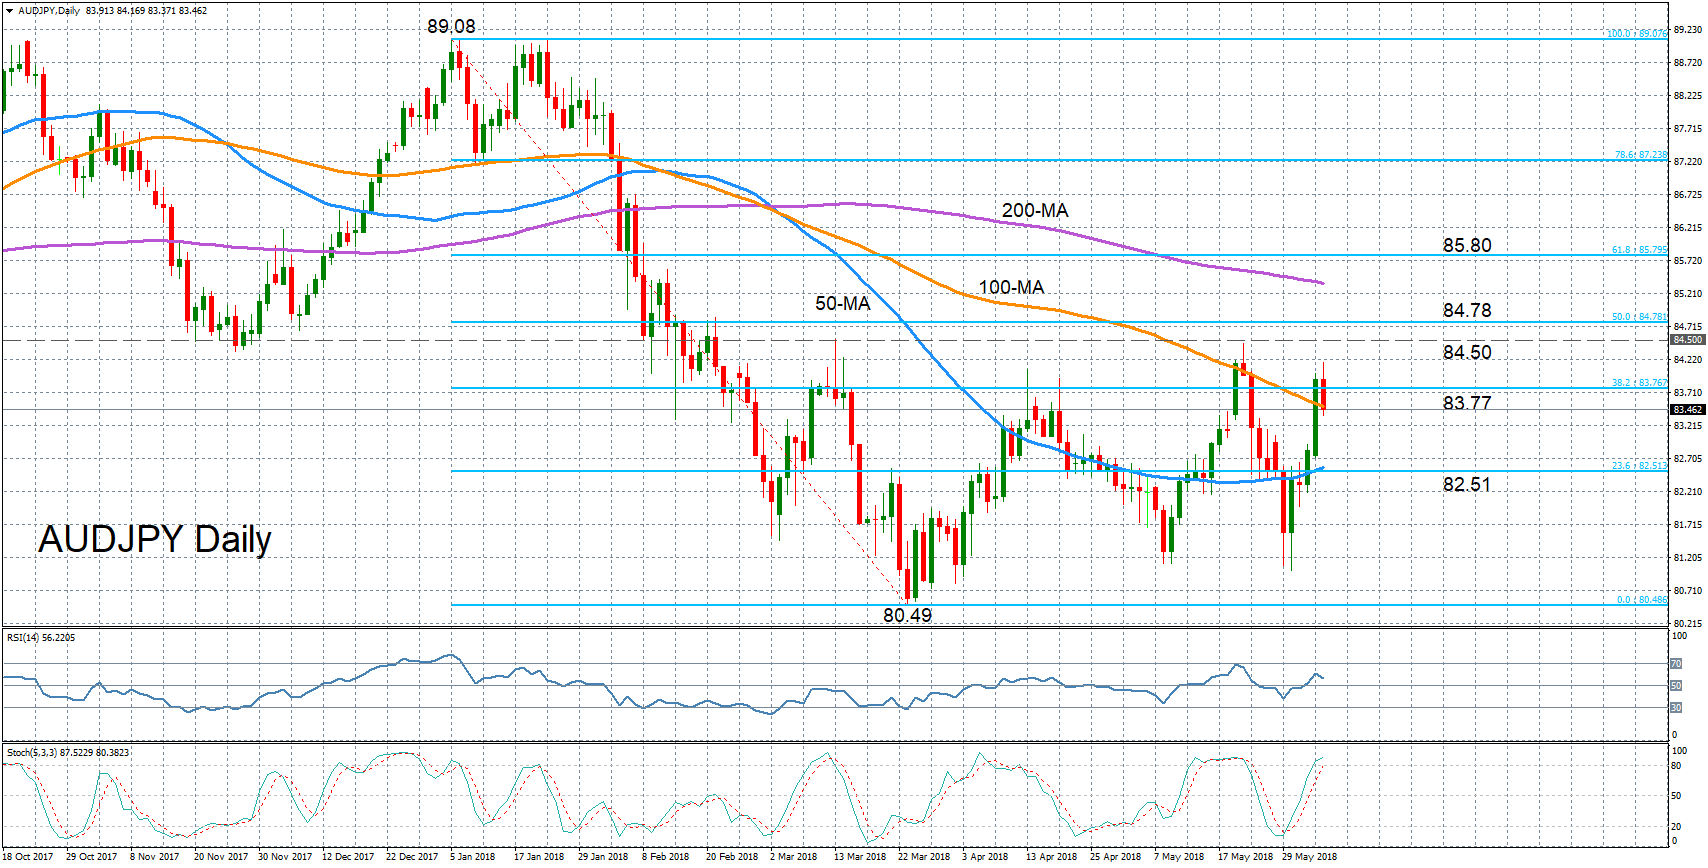
AUDJPY hit a two-week peak of 84.17 earlier today before pulling lower. Today’s high marked a sharp reversal from the two-month low of 81.01 touched on May 30.
The near-term bias remains bullish but momentum indicators suggest the rebound may be running out of steam. The RSI is pointing downwards, though it remains in positive territory, while the %K line of the stochastic oscillator is flatter after moving into overbought levels and could be heading for a bearish crossover with the %D line.
Immediate support is being provided by the 100-day moving average around 83.50. If the price fails to hold above this support and closes the session below it, the focus would shift back to the downside. Deeper losses would bring the 50-day moving average within range, which is overlapping with the 23.6% Fibonacci retracement level of the downleg from 89.08 to 80.49. A breach of this level, around 82.50, would see the short-term bias turn negative. Further down, March’s 16-month low of 80.49 should be watched. If broken, it would signal a return to a bearish outlook in the medium term, which had reverted to neutral following the sideways trading since March.
Alternatively, if the positive momentum strengthens and the pair heads higher again, immediate resistance would come from the 38.2% Fibonacci level at 83.77. A successful climb above this level would likely see the March and May tops near 84.50 once again acting as resistance. Above this barrier, the 50% Fibonacci at 84.78 is a key level that needs to be beaten to achieve a more sustainable uptrend.
Japanese Yen Trading Sideways, U.S Services PMI Climbs
The Japanese yen is unchanged in the Tuesday session. In North American trade, USD/JPY is trading at 109.84, up 0.02% on the day. On the release front, U.S manufacturing and employment reports were sharp. The ISM Non-Manufacturing PMI climbed to 58.6, beating the estimate of 57.9 points. JOLTS Job Openings improved to 6.70 million, crushing the estimate of 6.49 million. Later in the day, Japan releases Average Cash Earnings, which is expected to fall to 1.4 percent.
The Bank of Japan has steadfastly held that it will not exit its massive stimulus until inflation reaches the bank’s target of around 2 percent. Although inflation remains well below this level, a stronger economy has fueled expectations that the termination of stimulus is a question of ‘when’ rather than ‘if’. On Tuesday, Deputy Governor Masazumi Wakatabe said on Tuesday that the bank would not immediately start selling Japanese government bonds after the end of its stimulus scheme. Wakatabe said that a first priority for the BoJ would be taking care of excess liquidity. The cautious BoJ is unlikely to makes any dramatic fiscal moves, aware that even slight steps can have a strong impact on the markets and the currency exchange.
The on-again-off-again Korea nuclear summit is back on, complete with a starting time. The much-heralded meeting between President Trump and President Kim Jong-un will take place in Singapore on June 12, at 9:00 AM sharp. The summit will mark the face ever face-to-face meeting between leaders of the U.S and North Korea, but Trump has tried to lower expectations, saying that he didn’t expect the sides to sign an agreement. Rather, the meeting would mark the start of a process. North Korea is unlikely to agree to denuclearization, but the fact that progress is being made could boost investor risk appetite and weigh on the safe-haven Japanese yen.
Follow up on AUD/CAD long strategy
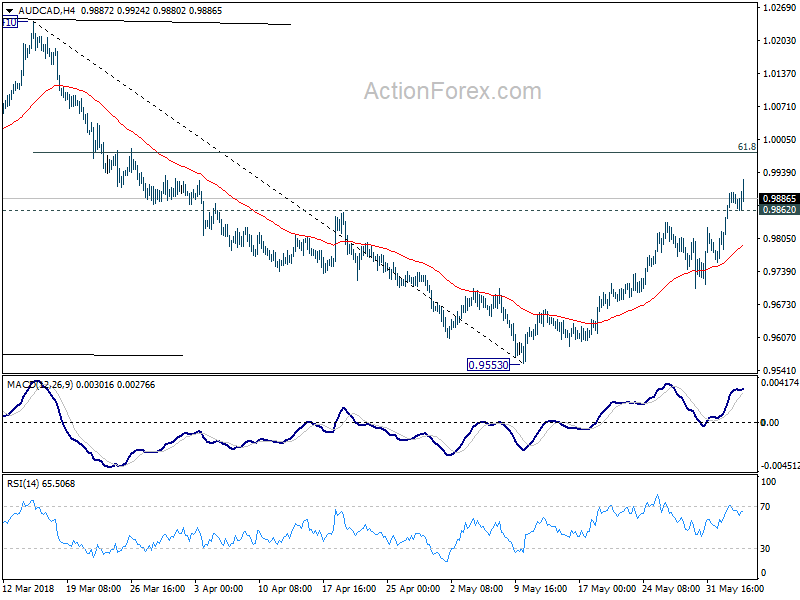
Following up on AUD/CAD long strategy here. The cross rose as expected and hit as high as 0.9924 so far today. There is still a bit of distance from our target at 61.8% retracement of 1.0241 to 0.9553 at 1.0066.
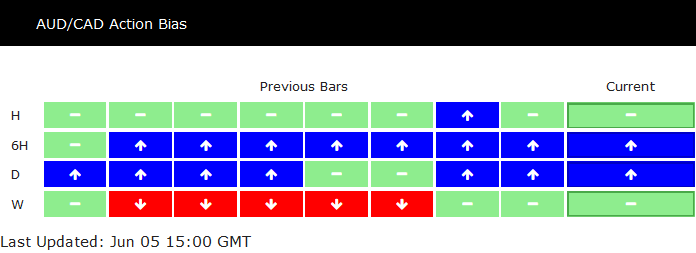
Looking at the action bias table, 6H action bias remains consistently upside blue, which support our bullish trade. The question is, from H action bias, there seems to be not enough upside momentum as AUD/CAD comes out of a consolidation.
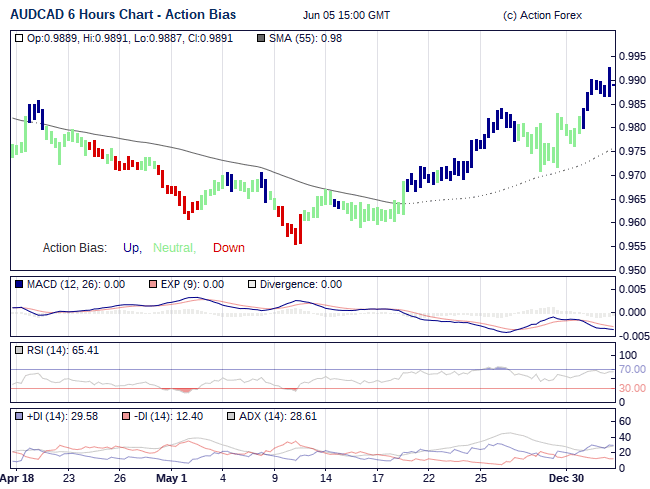
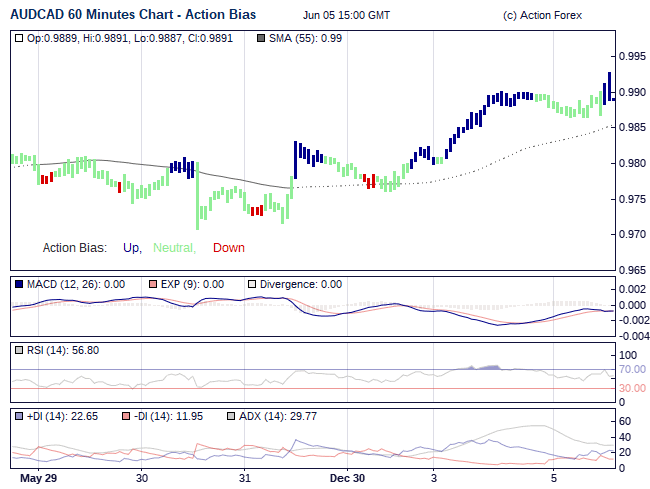
So, we'd hold the long position, with target still at 1.0066, but raise the stop to 0.9860, slightly below 0.9862 support. This is for locking in some profits if the current rise is a false break.
USDCAD Outlook: Surges Through 1.30 Today on 1% Rally so Far
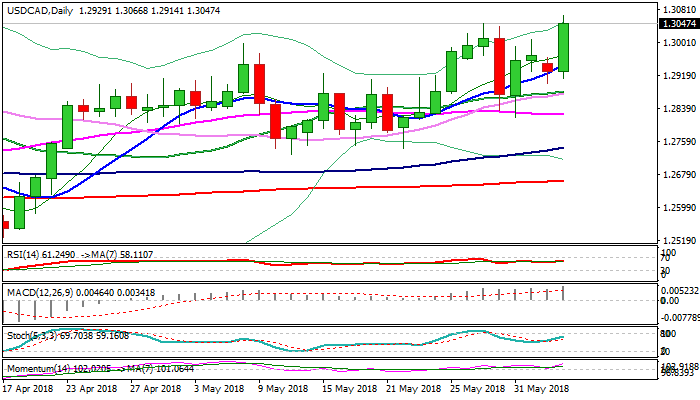
The pair broke above previous high at 1.3046 (29 May) on today’s strong rally which registered 1% rise until now.
Strong bullish mode started from early European trading, with downbeat Canada’s Q1 labor productivity data (-0.3% vs 0.3% f/c) adding pressure on Lonnie, while stronger than expected US ISM May services PMI 56.8 vs 55.7 f/c) further accelerated the greenback.
The pair is on track for the first close above psychological 1.30 barrier since 29 May, while daily close above former high at 1.3046 would add to strong bullish sentiment and open way for test of key med-term barriers at 1.3124/31 (19 Mar high/Fibo 61.8% of 1.3793/1.2061 fall).
The notion is supported by daily MA which returned to full bullish setup while strong bullish momentum is building.
Today’s rally shows initial signs of fatigue on hourly chart, as profit-taking after 150-pips rally could push the price lower.
Broken 1.30 level now offers support, while deeper dips should be contained by broken weekly cloud top (1.2927).
Res: 1.3066; 1.3100; 1.3124; 1.3131
Sup: 1.3000; 1.2964; 1.2946; 1.2927
US Trade Data in Focus ahead of G7 Summit as Tensions Run High after Tariff Decision
The trade balance in goods and services will be published by the United States Census Bureau on Wednesday at 12:30 GMT. After a sharp narrowing in the trade deficit in March, the shortfall is expected to hold near similar levels in April. The data will likely be watched closely ahead of the G7 summit on June 8-9, as the US President shows no sign of letting up his uncompromising stance in his fight to win more favourable trade terms from America’s partners.
In March, a record level of exports helped the deficit shrink from a more than a nine-year high of $57.7 billion in February to a 6-month low of $49.0 billion. The deficit is forecast to remain at $49.0 billion in April. The more sensitive trade gap with China also fell in March, narrowing by 11.6% to $25.9 billion as exports jumped 26.3% on the month and imports fell slightly.
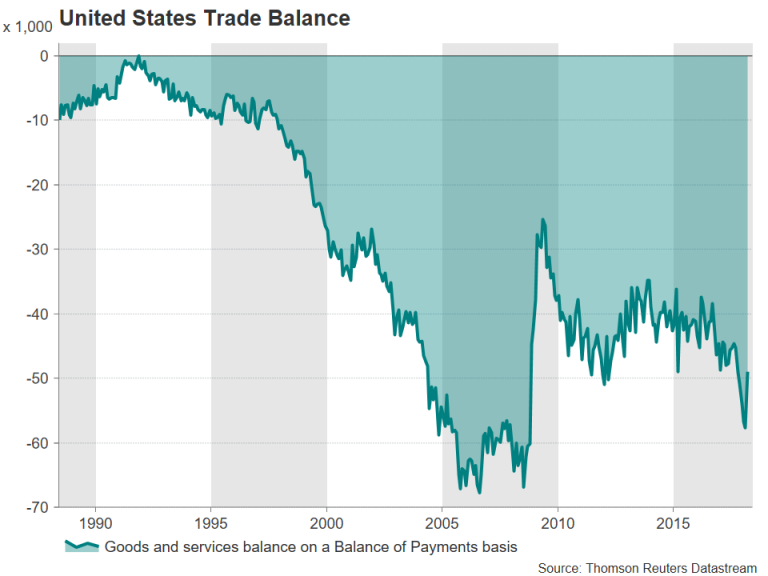
However, whether this is the start of a new trend or just monthly volatility remains to be seen. An expected rebound in consumer spending in the second quarter will likely fuel demand for imports and push the deficit back up again as US households start to reap the benefits of the tax cuts. Furthermore, US exports may struggle to keep up the same pace of growth if America’s main trading partners such as the Eurozone and Japan continue to experience softer economic growth.
If the trade deficit improves further in April, it could be seen as weakening President Trump’s argument that the US is being taken advantage of by its trading partners. G6 leaders could point out at the upcoming G7 summit that the US trade position is already on the mend and that tariffs are unjustified. The US angered its allies on June 1 when Trump refused to extend the exemption from the steel and aluminium tariffs for Canada, Mexico and the European Union.
On the other hand, if the trade deficit widens in April, it would probably heighten the urgency for President Trump to take action. A confrontational Trump at the G7 summit in little mood for compromise would likely do nothing in bridging differences and would only further unite the other six leaders against the US President. The absence of progress on the trade front at the summit would raise the prospect of the EU slapping retaliatory tariffs on US products and give China more reason to take a tougher stance in its trade talks with the US.
A negative tone at the G7 summit would reignite fears of a full-blown trade war, which markets have been dismissive of in recent weeks. The dollar is at risk of a sharp reversal against the safe-haven yen if traders begin to price in more tit-for-tat tariffs by the world’s major trading powers. Increased trade barriers on a broad range of products and not limited to just steel and aluminium would be harmful to global trade and potentially damage the US economy in the long run.
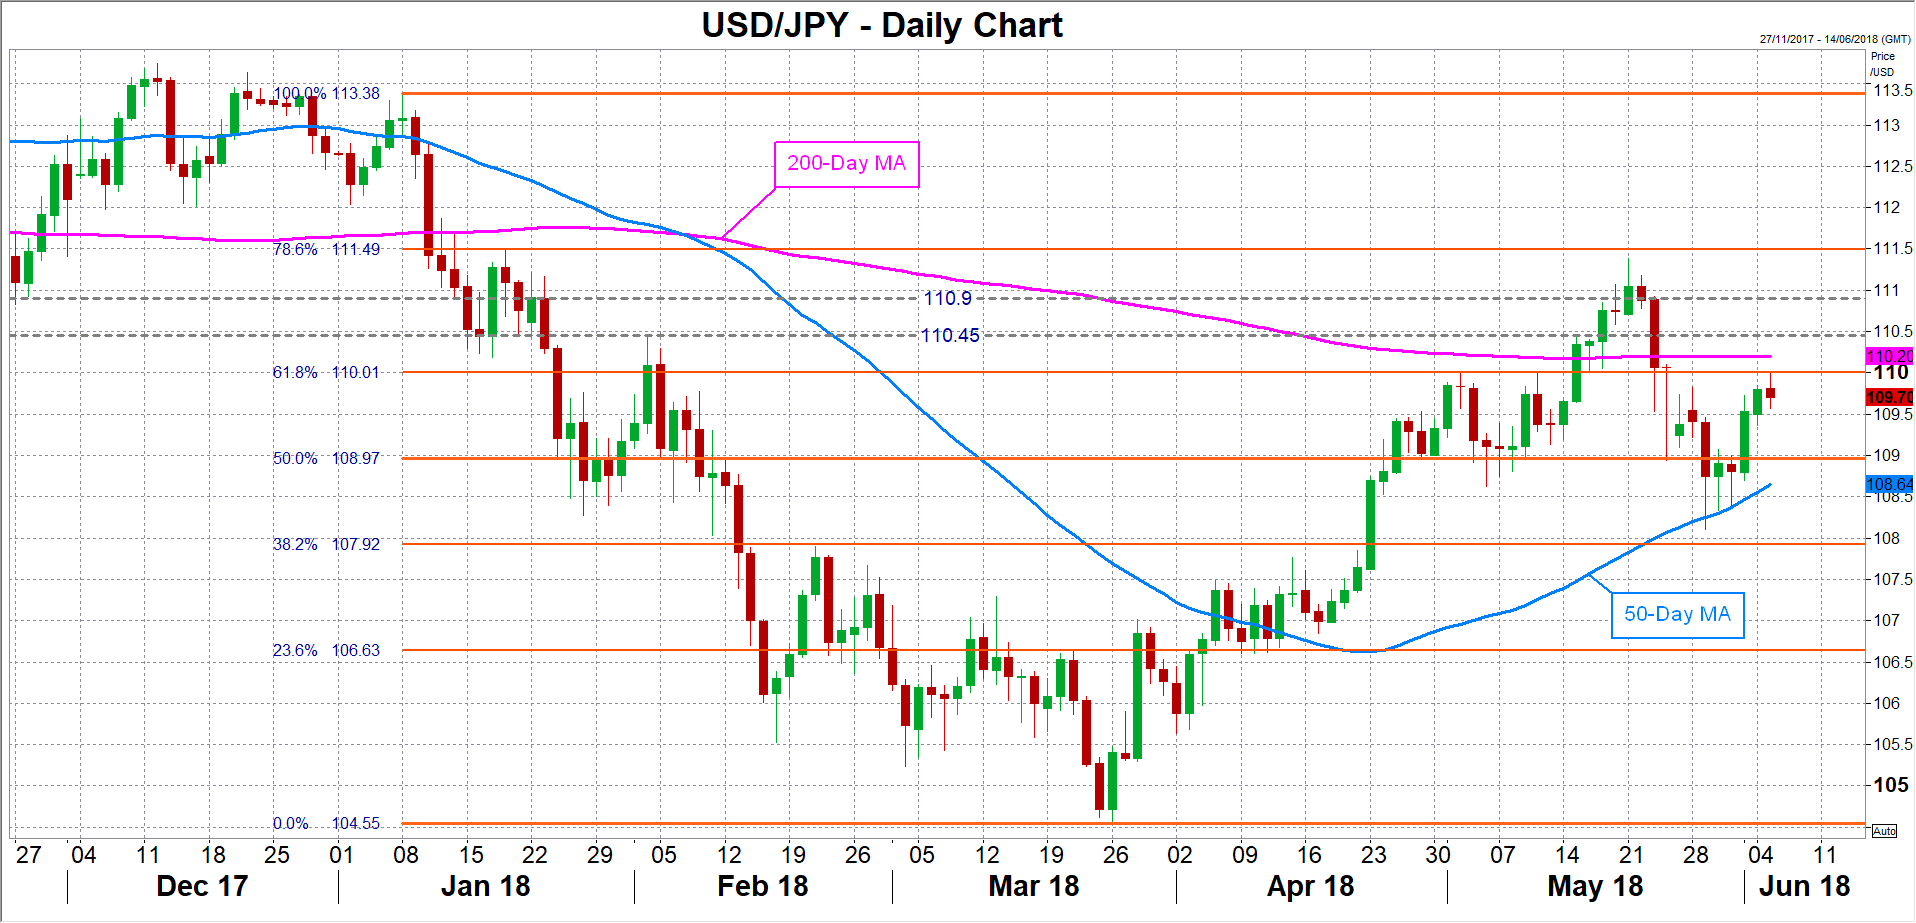
The dollar could head back towards the 109 level versus the yen if risk appetite deteriorates after this week’s summit. A bigger sell-off would drag the pair towards the 50-day moving average (currently around 108.65). A breach of this support would bring the 107.90 region into view.
However, a surprise agreement by G7 leaders for more dialogue to resolve their trade differences and to put retaliatory measures on hold would provide a major boost to risk-on sentiment. The dollar could reclaim the 110-yen level if the Japanese currency is sold off on the back of easing trade war concerns. A steeper rally in dollar/yen would see potential hurdles at 110.45 and 110.90 before the next major resistance at 111.50.
Sunset Market Commentary
Markets:
Global core bonds gained ground today. Two items played a role. First, the relief rally since last Thursday in the Italian BTP market ended. The Italian 10-yr yield spread vs Germany widened by 25 bps. Spanish/Portuguese spreads added 11 bps. Italian PM Conte’s maiden speech in parliament stressed willingness to execute the Lega-5SM coalition agreement without further ado. Some investors probably hoped for a more moderate approach. Second, oil price faced a new backlash as the US government reportedly asked Saudi Arabia and some other OPEC producers to increase oil production by about 1 million barrels a day. Brent crude declined from $75.5/barrel towards $74/barrel. German yields decline 1.3 bps (2-yr) to 4.3 bps (10-yr) with the belly of the curve outperforming the wings. The US yield curve shifts in parallel fashion with yields 2.1 bps (30-yr) to 3.4 bps (5-yr) lower.
The new stress on the Italian BTP market and lower oil prices both played in the card of a weaker EUR/USD. The pair returned below 1.1670 after setting an intraday high just below 1.1720 early in the session. The move remained rather subdued with lower core bond yields causing a balancing act.
Sterling outperformed today even if UK investors started the day with headlines that UK PM May won’t set out the UK’s detailed strategy to solve the Northern Irish dispute ahead of the June EU-UK Summit. Investors by and large shrugged off this umpteenth disappointment. A stronger than expected UK services PMI even rocked the queen’s money. EUR/GBP dropped from the 0.8885 area to 0.8730 and is again approaching the key support area around 0.87. GBP/USD reversed yesterday’s losses and changes hands around 1.3365.
News Headlines:
The US service industries expanded in May at a faster pace than forecast (services ISM 58.6 from 56.8 vs 57.6 expected) on stronger orders and sales, while a gauge of materials prices continued to advance.
The CNB may raise interest rates sooner than expected due to faster wage growth and a weaker-than-expected crown exchange rate, Governor Rusnok said. EUR/CZK dropped the past two days from 25.80 towards 25.60. (Reuters)
The UK services PMI recovered more than forecasted in May, rising from 52.8 to 54.0 (vs 53 consensus). However, forward looking indicators suggested that the economy could still relapse. The final EMU services PMI for May faced a small downward revision, from 53.9 to 53.8. April EMU retail sales disappointed (0.1% M/M), but the March figure was upgraded from 0,1% M/M to 0,4% M/M.
Former Spanish PM Rajoy says he will step down as president of People’s Party once new leader has been chosen: “It is time to bring an end to this period. The party should continue to move ahead under the leadership of someone else. That’s best for me and for the party”. (BB)
South Africa’s economy contracted at the sharpest rate in almost a decade in the first three months of the year (-2.2% Q/Qa), underlying the challenge confronting President Ramaphosa’s bid to revive growth. (FT)
USD/CAD Mid-Day Outlook
Daily Pivots: (S1) 1.2898; (P) 1.2934; (R1) 1.2968; More.....
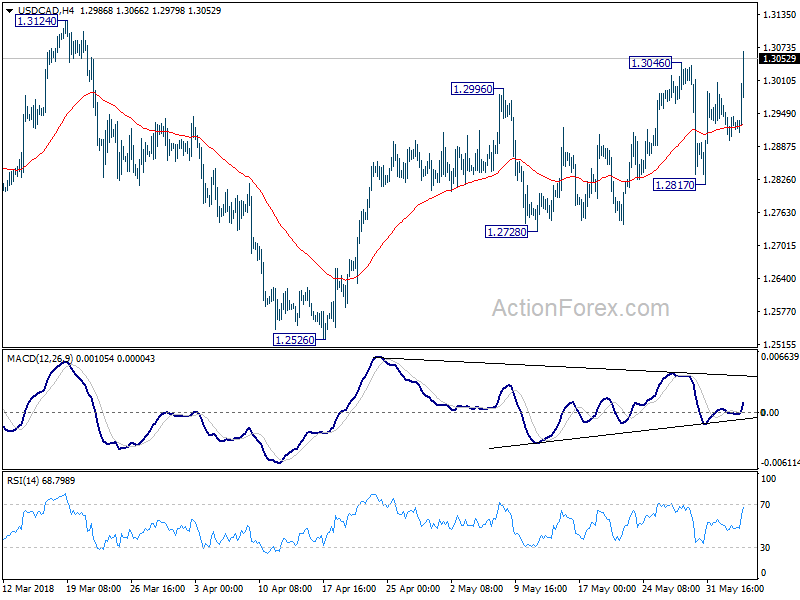
USD/CAD's break of 1.3046 suggests that rise from 1.2526 has resumed. And the development affirms our bullish view. Intraday bias is back on the upside for 1.3124 key resistance Decisive break there will carry larger bullish implication. For now, near term outlook will stay cautiously bullish as long as 1.2817 support holds, in case of retreat.
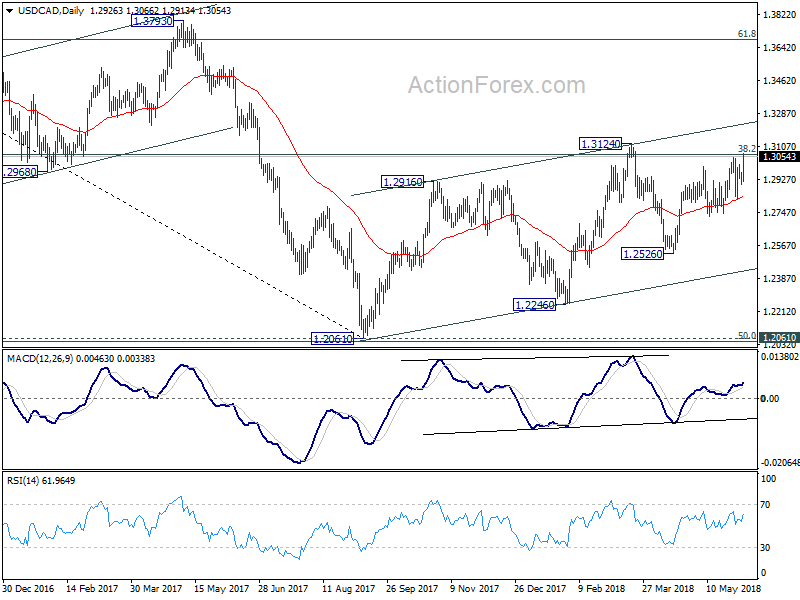
In the bigger picture, we're favoring the case that that rebound from 1.2061 has not completed yet. But there is no follow through upside momentum so far. Focus remains on 38.2% retracement of 1.4689 to 1.2061 at 1.3065. Sustained trading above there will confirm medium term bullish reversal. That is, down trend from 1.4689 has completed at 1.2061 already. In that case, next target will be 61.8% retracement at 1.3685. However, break of 1.2526 support will dampen this bullish view again. And, focus will be back on 1.2061 key support level, which is close to 50% retracement of 0.9406 (2011 low) to 1.4689 (2015 high) at 1.2048.
Dollar jumps as ISM services rose to 58.6, beat expectation
ISM non-manufacturing composite rose to 58.6 in May, up from 56.8 and beat expectation of 57.4. Business activity index rose 2.2 to 61.3. New orders rose 0.5 to 60.5. Employment index rose 0.5 to 54.1.
Dollar responses positive to the upside surprise. In particular USD/CAD finally takes out 1.3046 resistance to resume recent rally.
ISM noted in the release that "the majority of respondents are optimistic about business conditions and the overall economy." But "there continue to be concerns about the uncertainty surrounding tariffs, trade agreements and the impact on cost of goods sold."
Some quotes from respondents:
"Material prices have been difficult to predict this year, and suppliers have struggled to hold prices for any extended period on quotes, specifically on lumber and lumber-related products. The instability has proven frustrating, but a larger problem is that we are starting to see longer lead times in many of the same areas that could start impacting timelines if they continue to get worse as we get into the main building season." (Construction)
"The trade discussions with NAFTA, Korea and the European Union will have critical impacts on our spend relating to steel products. Also, the potential of the U.S. pulling out of the Iran nuclear deal could push crude prices higher." (Mining)
"Oil price stabilization in the (US) $60 to $70 per barrel [is] having a positive impact on hiring, both contract labor and direct employees, in the oil and gas industry and supporting industries." (Professional, Scientific & Technical Services)
Full release here.
EURGBP in Neutral Mode in Near Term; Still Stands in Downward Channel in Longer Timeframe
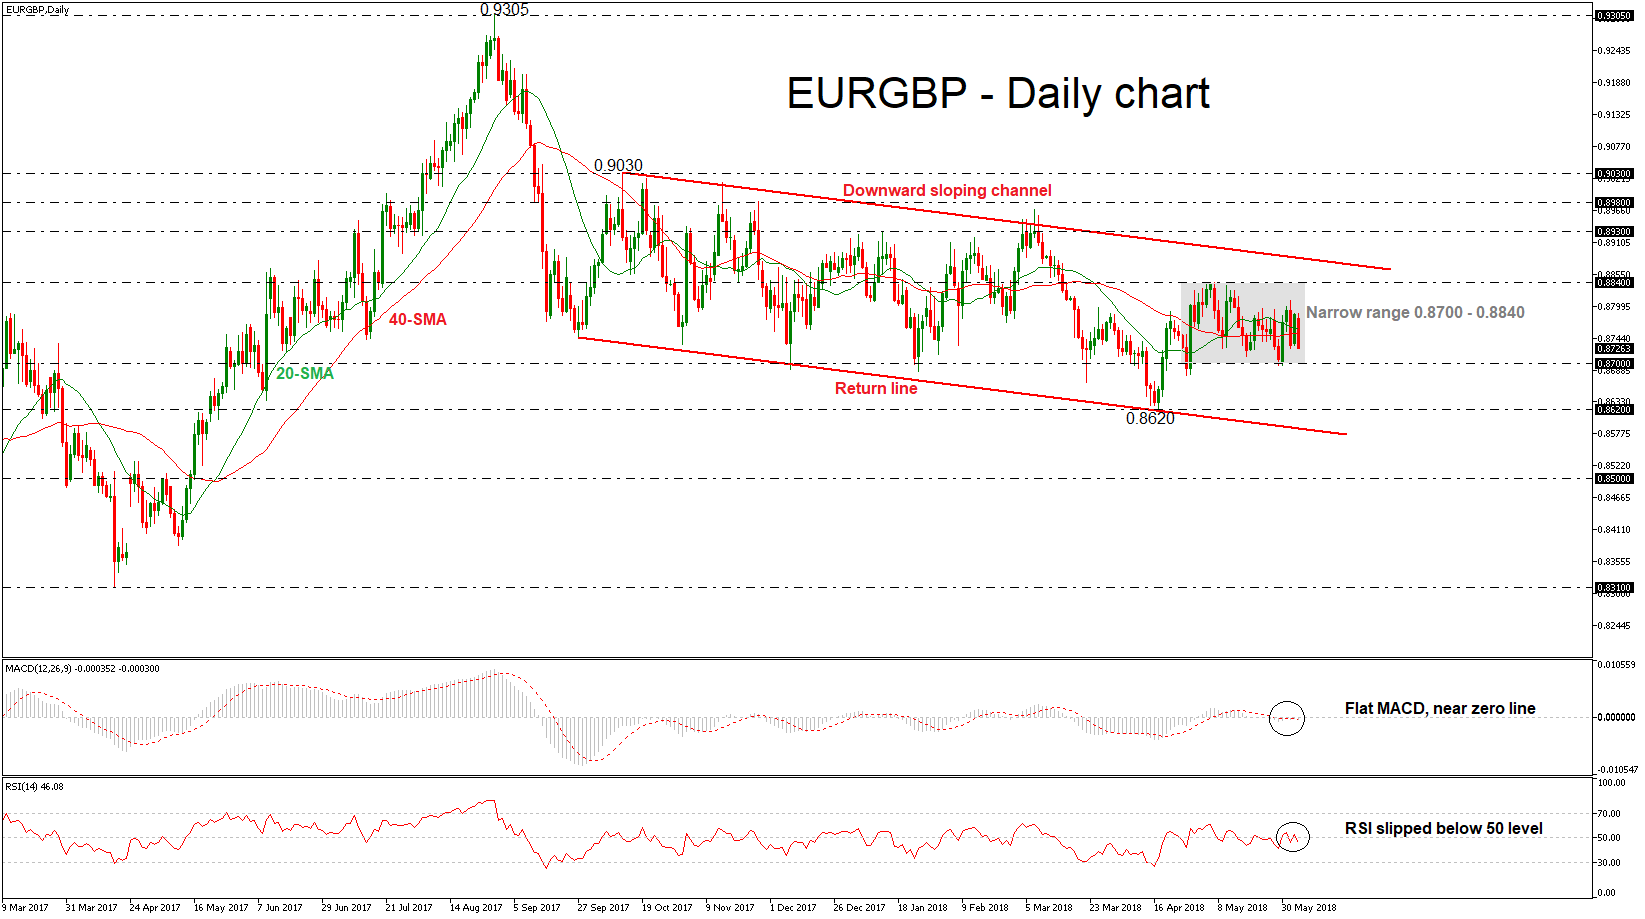
EURGBP has been trading sideways in the short-term over the last month with upper boundary the 0.8840 resistance level and lower boundary the 0.8700 handle.
In the near-term, the price is moving around the 20- and 40-day simple moving average (SMA), while the technical indicators hold near their neutral levels. The RSI indicator is pointing down and it has managed to cross into negative territory below the 50 level. Also, the MACD oscillator is flattening near its trigger line.
Strong losses could drive the price towards the next immediate support level of 0.8700. In case of a slip below the aforementioned level, the price could touch the 0.8620 support barrier, which is holding near the lower boundary of the downward sloping channel. In case of further downside pressure, the pair could penetrate the channel to the downside and drive EURGBP towards the 0.8500 handle.
On the flip side, an immediate level is likely to come from the 0.8840 hurdle, which has proved a strong resistance area in the past. A break above that could lead prices near the upper channel line around the 0.8900 critical level.
In the bigger picture, the pair remains in a slightly downward-tilting channel, which has been in place since September 2017. The longer-term neutral to bearish outlook was recently confirmed again when the pair touched an 11-month low of 0.8620 on April 16.
EURGBP Outlook: Strong Bearish Signal on Probes Below Daily Cloud Top
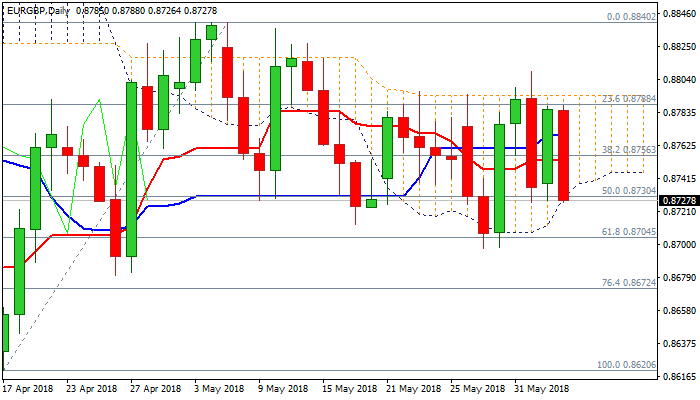
The cross dipped on Tuesday as sterling rallied on better than expected UK data and euro came under pressure on rise of Italian bond yields after new PM promised to bring radical changes to the country. Fresh weakness nearly fully reversed yesterday's recovery and pressures low of past two days at 0.8727, which marks the lower boundary of three-day congestion, capped by descending 100SMA (0.8787). The downside is reinforced by the base of daily cloud and clear break lower would generate firmer bearish signal as the price holds in the range within daily cloud since 21 May and break below cloud would expose key near-term support at 0.8697 (29/30May higher base). Today's fall brings daily MA's back to full bearish configuration, which increase pressure as momentum turned south. Converged 10/55SMA's offer solid resistance at 0.8749/56 zone which is expected to cap and keep bears in play.
Res: 0.8756; 0.8768; 0.8787; 0.8809
Sup: 0.8718; 0.8697; 0.8680; 0.8672