Sample Category Title
AUD/USD Buying Interest Is Fading
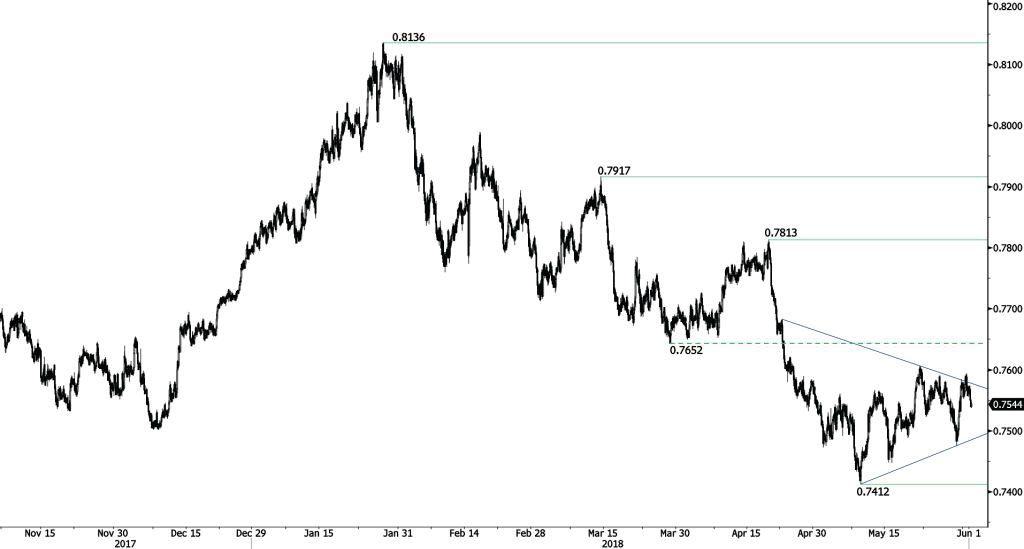
AUD/USD has weakened after the successful test of its key resistance at 0.7582. Despite the lack of follow-through after the break of the hourly support, a break of the strong resistance at 0.7652 is needed to invalidate the current short-term bearish bias.
In the long-term, the upward trend slows down after failing to reach key resistance at 0.8164 (14/05/2015 low). Key support stands at 0.6009 (31/10/2008 low). A break of the key resistance at 0.8164 (14/05/2015 high) is needed to invalidate our long-term bearish view.
USD/CAD Moving Towards Its Recent Highs
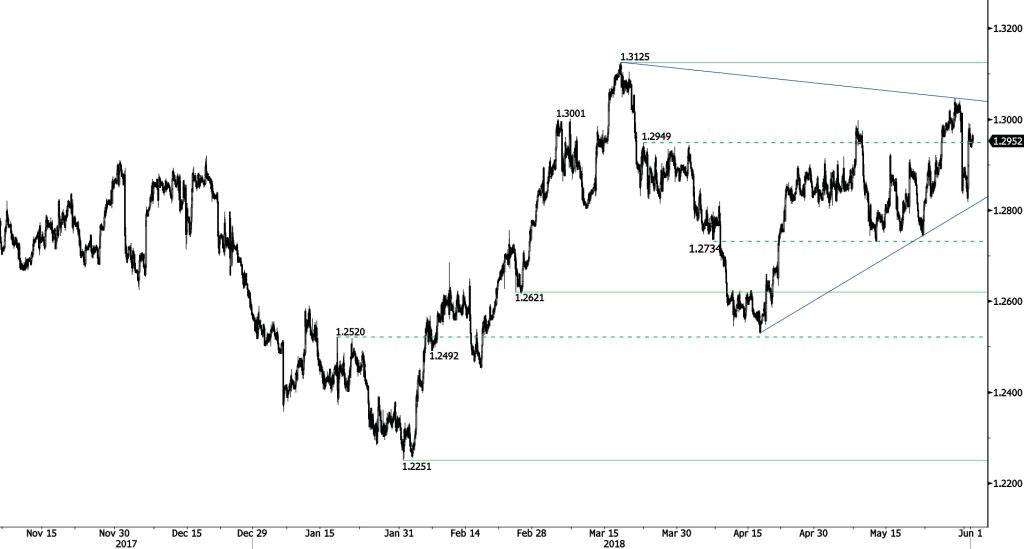
USD/CAD continues to improve after strong bounce off rising trendline 1.2801. Next resistance can be found at 1.3125 (19/03/2017 high). The technical structure suggests shortterm sideways moves.
In the longer term, the pair is trading between resistance point at 1.3805 (05/05/2017 high) and support at 1.2128 (18/06/2015 low). Strong resistance is given at 1.4690 (22/01/2016 high). The pair is likely to head lower. The pair is trading above its 200 DMA.
USD/CHF Decline In Channel
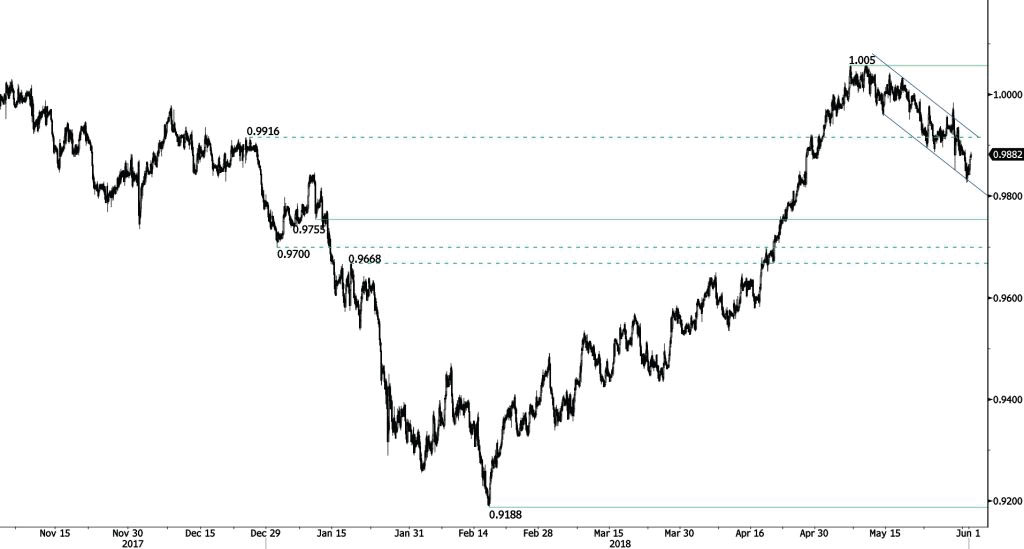
USD/CHF's has broken the support at 0.9916 (26/12/2017 high), validating a bearish reversal pattern with a downside risk at 0.9755. Key support and resistance given at 0.9755 (10/01/2018 low) and 1.0091 (09/05/2017 high) are maintained. The technical structure suggests short-term sideways trading moves.
In the long-term, the pair is still trading in range since 2011 despite some turmoil when the SNB unpegged the CHF. Key support lies at 0.9072 (07/05/2015 low) while resistance at 1.0344 (15/12/2016 high) is distanced. The technical structure favours a long term bullish bias since the unpeg in January 2015
USD/JPY Choppy Trading
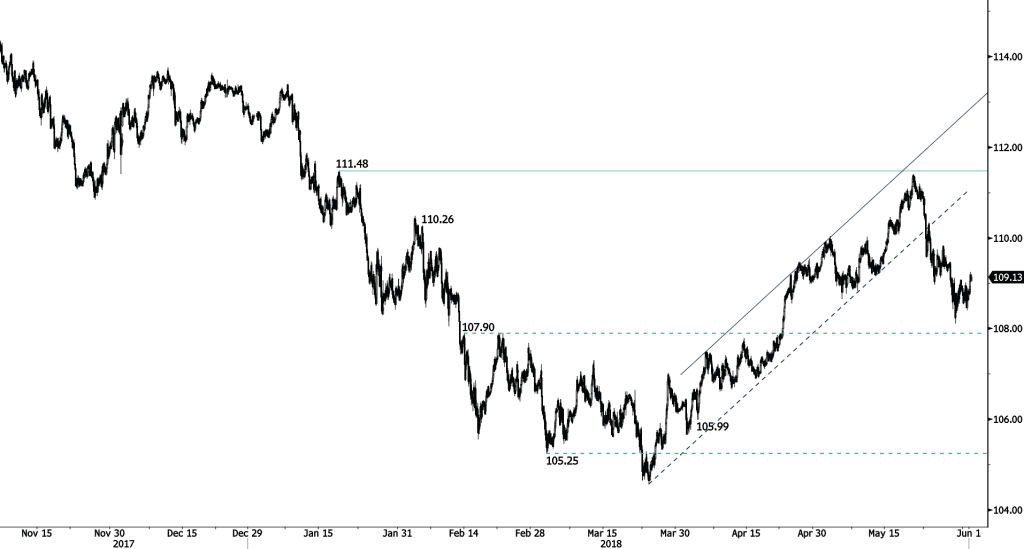
USD/JPY continues to bounce. Strong support and resistance are located at 107.90 (13/02/2018 low) and 111.48 (18/01/2018 high). The technical structure suggests short-term sideways trading moves.
We favor a long-term bearish bias. Support remains at 101.20 (09/11/2016 low). A gradual rise toward the major resistance at 125.86 (05/06/2015 high) seems unlikely. Expected to decline further support at 101.20 (09/11/2016 low). The pair trades slightly above its 200 DMA.
GBP/USD Bullish Momentum Is Fading
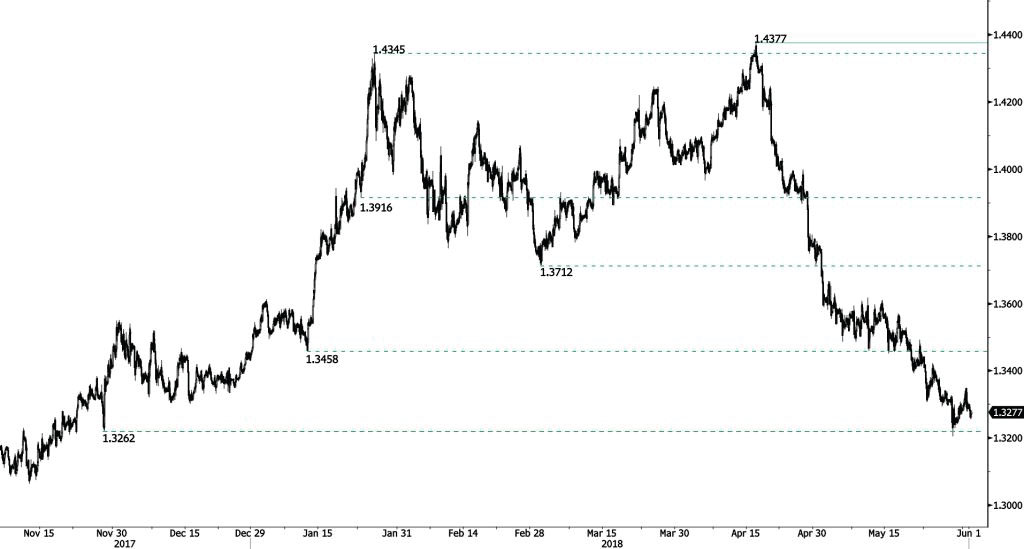
GBP/USD has reversed. Further weakness towards the support at 1.3223 is favored. Key support and resistance are given at 1.3068 (13/11/2017 low) and 1.3458 (11/01/2017 low. The technical structure suggests further downside.
The long-term technical pattern is reversing. The Brexit vote had paved the way for further decline but the pair is moving to 2016 highs. Long-term support and resistance are given at 1.1841 (07/10/2017 low) and 1.5018 (24/06/2016 high).
EUR/USD Fading Interest
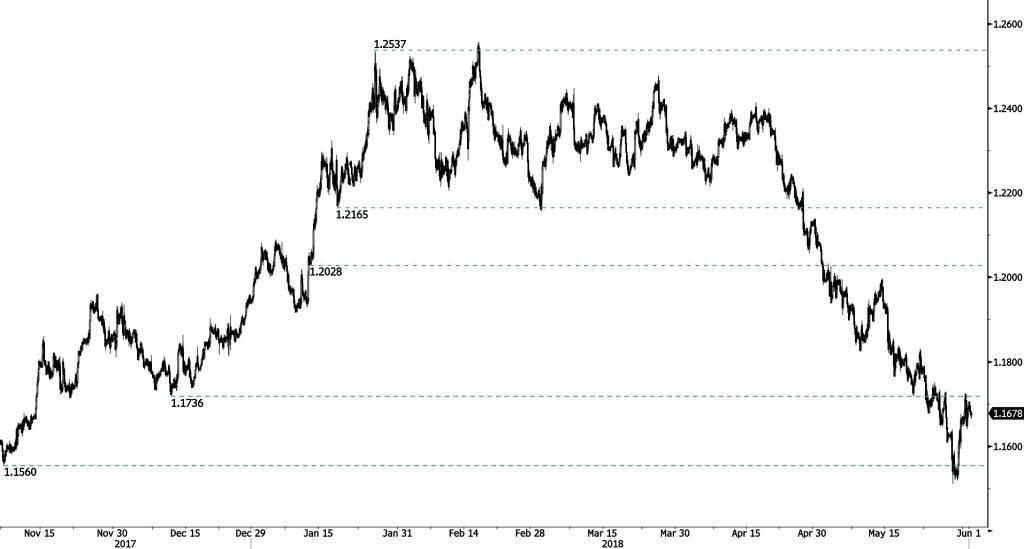
EUR/USD has experienced a pickup in buying interest near the support at 1.1560. The shortterm technical structure is negative as long as prices remain below the hourly resistance at 1.2036 (11/01/2017 low). Next key support and resistance are now given at 1.1463 (12/02/2018 low) and 1.2323 (17/01/2018 high).
In the longer term, the momentum is turning largely negative. We favor a continued bearish bias. Key resistance is holding at 1.2886 (15/10/2014 high) while strong support lies at 1.1554 (08/11/2017 low).
AUDUSD Outlook – At The Back Foot On Renewed Trade War Fears, US Jobs Data Expected To Provide Clearer...
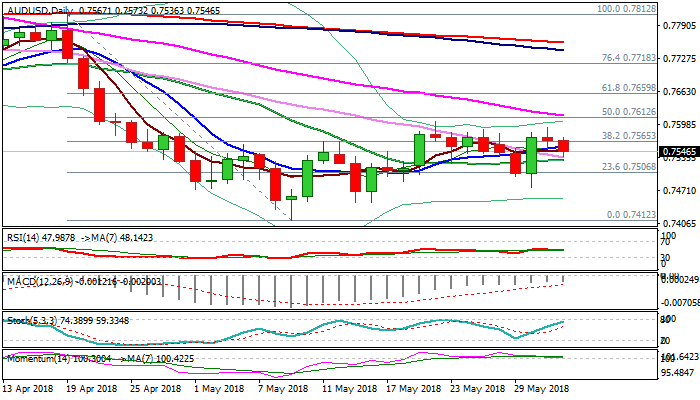
The Aussie dollar dipped to session low in Asia on Friday after previous day’s upside attempts stalled under strong 0.76 zone barrier.
Renewed fears about trade war as the US imposes new tariffs on imported steel and aluminum kept Australian dollar at the back foot ahead of release of US jobs data later today, with mixed signals from daily techs, signaling unclear near-term direction.
Pivotal support lays at 0.7530 (sideways-moving 20SMA), loss of which would generate stronger bearish signal on double-top formation at 0.76 zone.
Bullish signal could be expected on close above 0.76 barrier (22 May high / falling 55SMA).
Release of US labor data is expected to generate stronger direction signal.
Res: 0.7573, 0.7593, 0.7605, 0.7616
Sup: 0.7530, 0.7498, 0.7475, 0.7447
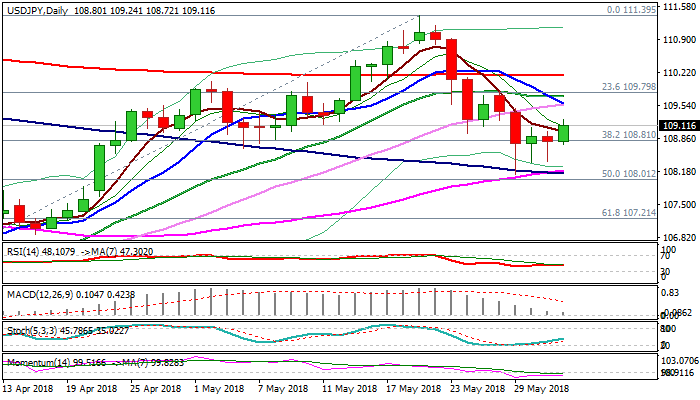
USDJPY Outlook – 30SMA Likely To Cap Recovery
The pair accelerated higher in early Friday’s trading, following triple downside rejection which left long-tailed daily candle of past three days, signaling that pullback from 111.39 (21 May high) runs out of steam.
However, prevailing bearish tone on daily chart as momentum remains weak and falling 10SMA is forming the third bear-cross (10/200, 10/20 and currently probing below 30SMA), suggests limited correction before bears resume.
Converged 10/30SMA’s (109.56) should limit recovery and keep bearish bias in play.
Strong supports lay at 108.20/00 zone (rising 55SMA which formed bull-cross with 100SMA and 50% retracement of 104.63/111.39 rally) and break here would generate strong bearish signal.
On the other side, converged 10/30SMA’s mark initial pivot, followed by 20SMA at 109.71, with weekly close above it to neutralize bears and shift near-term focus higher.
Res: 109.07, 109.50, 109.74, 110.00
Sup: 108.99, 108.72, 108.35, 108.20
GBPUSD Outlook – Remains Below 10SMA Ahead Of UK Mfg Data
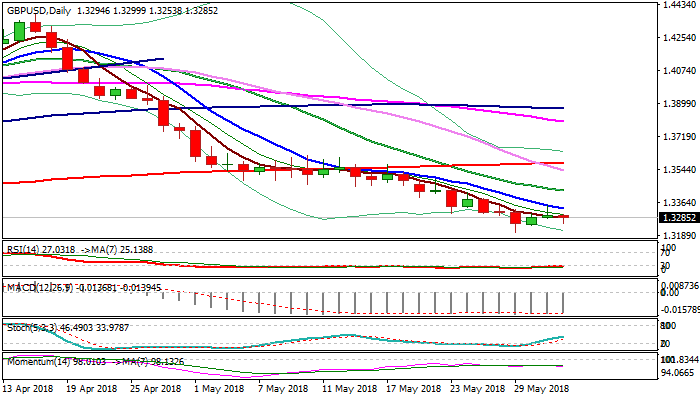
Cable stood at the back foot in Asia on Friday, with recovery attempts in early European trading, but near-term outlook is negatively aligned.
Thursday's strong upside rejection which left daily candle with long upper shadow after falling 10SMA capped recovery, generated negative signal.
Daily / weekly techs are in strong bearish setup and keep the downside in focus for renewed attack at key 1.3205 support, where top of weekly cloud offered a footstep for larger downtrend from 1.4376.
Weekly close below 10SMA would offer fresh negative signal.
UK Manufacturing PMI is key release for sterling in the European session (May f/c 53.5 vs 53.9 in Apr) with release at below forecasted level to keep pound at the back foot.
Conversely, stronger than expected release would spark stronger bullish acceleration through 1.33 handle for retest of 10SMA (1.3331).
Bullish scenario on weekly close above falling 10SMA would neutralize existing downside risk and signal further recovery.
Res: 1.3300, 1.3331, 1.3348, 1.3410
Sup: 1.3253, 1.3241, 1.3205, 1.3153
EURUSD Outlook – Trades Around Pivotal 10SMA Barrier But Holds Firm Tone Ahead Of US Jobs Data
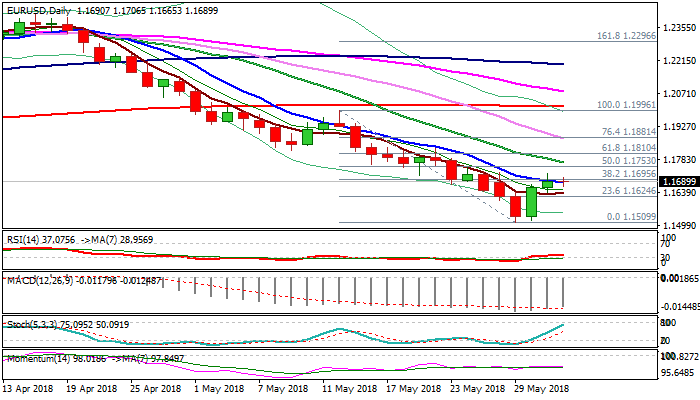
The Euro holding within narrow range around falling 10SMA (currently at 1.1682) in early Friday’s trading, but remains firm following past two days rally.
Probes through key near-term barriers, 10SMA and Fibo 38.2% of 1.1996/1.1509 (1.1695), failed to close above on initial attempt, but scope for fresh upside exists.
Weekly close above these pivots would generate strong bullish signal for extension of recovery rally from 1.1509 (29 May low).
Concerns over political crisis in Italy eased, keeping the Euro supported, but technical studies are lacking momentum to support further rally, as falling 4-hr cloud weighs.
Repeated failure at 10SMA would be initial signal of recovery stall and risk stronger bearish acceleration on break below 5SMA (1.1640) and signal that larger bears remain intact after correction.
Bullish scenario requires sustained break above 10SMA to open falling 20SMA (1.1772).
US jobs data are in focus as key event today. According to the forecasts, job growth in the US likely accelerated in May and increased to 188K, following 164K in April and 135K in March, when employment growth was affected by poor weather.
Solid numbers today, even slightly below expected figure, would be sufficient to support Fed’s tightening bias as US central bank is widely expected to hike rates in June.
In addition, US average hourly earnings are forecasted at 0.2% in May vs 0.1% previous month while unemployment is expected to remain unchanged at 3.9% in May, the lowest since 2000.
Strong US employment data would offer fresh support to the greenback and limit Euro’s recovery.
Res: 1.1724, 1.1753, 1.1773, 1.1810
Sup: 1.1665, 1.1640, 1.1617, 1.1594