Sample Category Title
EUR/USD Analysis: Fails To Overcome 1.17
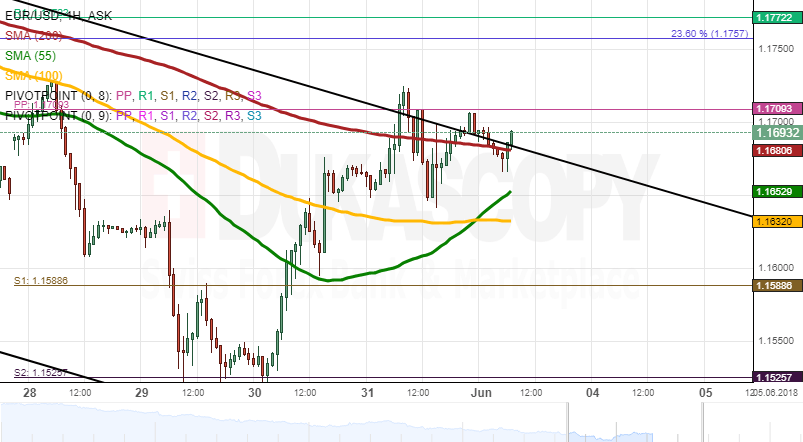
EUR/USD showed some volatility on Thursday but it did not leave that session's opening level near 1.1670. Any significant leaps were restricted by SMAs on the 1H and 4H time-frames. As a result, the pair did not fully breach the upper boundary of a seven-week channel circa 1.17.
If this mark is breached in the nearest time, the Euro is likely to target the 1.1760 area where the 100-period (4H) SMA, the weekly PP and the monthly R1 are located. This level should be surpassed only if some fundamentals provides the pair with strong bullish momentum.
On the other hand, technical indicators flash bearish signals. It should be noted that the rate faces the 55– and 100-hour SMAs at 1.1640. Given the close proximity of this support, a more likely daily low should be 1.16.
GBP/USD Analysis: Falls Below SMAs
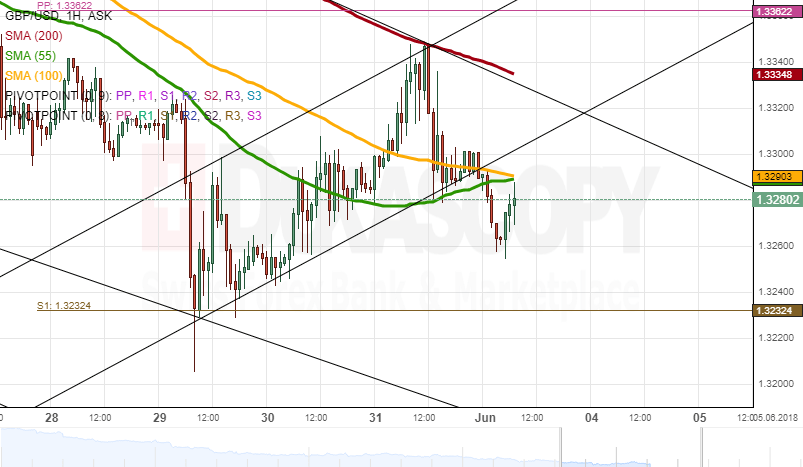
Bulls dominated the GBP/USD exchange rate during the first part of Thursday. This upside momentum was stopped by the strong resistance of the 200-hour and 55-period (4H) SMAs at 1.3350.
Bulls failed to move the rate above this barrier, thus paving the way for a subsequent surge past the 55– and 100-hour SMAs and down to 1.3260 where it was located at the time of this analysis.
Technical indicators show mixed results today. However, given that the pair is located below all three SMAs, it might still continue moving lower during this session. It should be noted that this assumption could be disrupted by today's fundamentals that are likely to push the rate in any direction.
By and large, the pair is expected to remain within the 1.3200/1.3350 range.
USD/JPY Analysis: Bearish Today
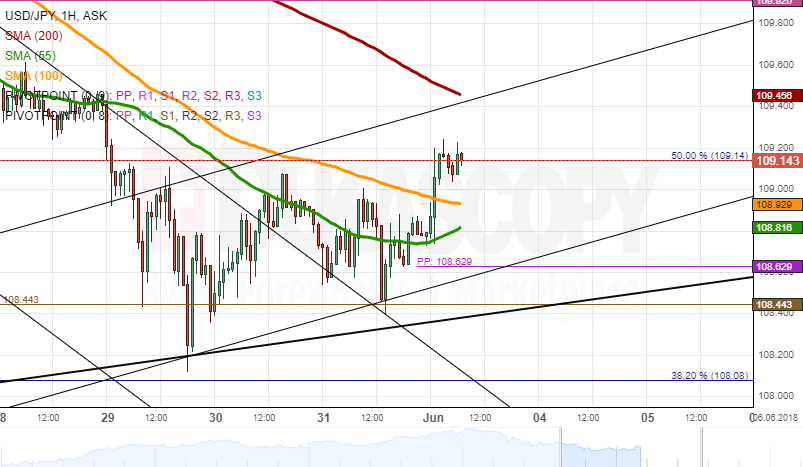
Thursday's trading session did not introduce significant changes to the pair's price level, as any attempts to move either direction were restricted by the 100-hour SMA and the weekly S1. The former was breached to the upside early on Friday, thus clearing the way until the weekly PP and the 200-hour SMA at 109.50.
In case no fundamentals surprise the market, it is unlikely that this level is breached, as it is likewise reinforced by the 200-period SMA on the 4H chart. Thus, it is expected that the pair is tended south in this session. The nearest support is the 55– and 100-hour SMAs at 108.80. The given fall should not stop there but continue even lower until the 108.40 mark.
Gold Analysis: Stranded In Narrow Range
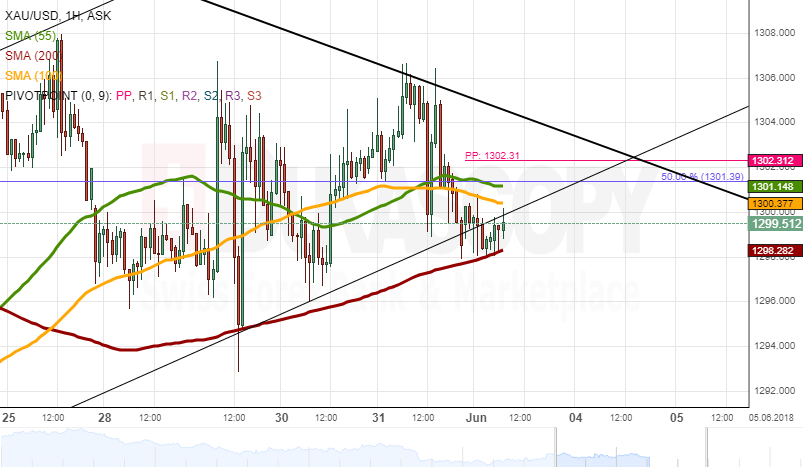
XAU/USD remained stable on Thursday, similarly to other major currency pairs which include the US Dollar. After failing to surpass the 1,306.00 mark mid-day, the bearish sentiment took over the market and consequently pushed Gold below the 55– and 100-hour SMAs and the 50.00% Fibo retracement. A further fall was stopped by the 200-hour SMA. Thus, the rate was stranded in a narrow range between these three SMAs both in the 1H and 4H charts.
Given the strength of these both barriers, the soon breakout should dictate the pair's direction in this session. Technical indicators flash bearish signals. In case this scenario occurs, the pair would approach the senior channel and the 61.80% Fibo at 1,290.00 Conversely, the daily high should be the 1,310.00 mark.
USD/CAD: Canadian Overnight Rate
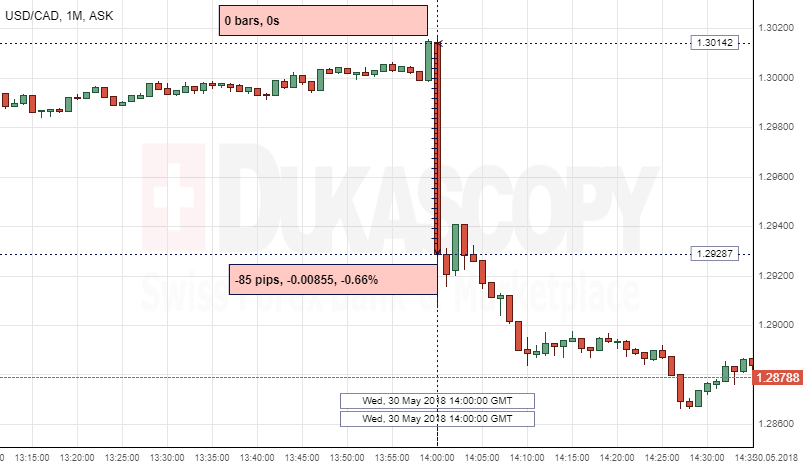
The Canadian Dollar strengthened against the Greenback, following the Canadian Overnight Rate data release on Wednesday. The USD/CAD currency pair lost 85 pips, or 0.66%, to continue fluctuating in the 1.2864 area.
The Bank of Canada released Overnight Rate data that came out in line with the forecast of 1.25%, staying unchanged from the previous period.
"With sales yet to stabilize, it's hard to imagine the bank to opt to tighten policy further and increase the downside risk to housing," said BMO economist Benjamin Reitzes.
GBP/NZD 1H Chart: Guided By SMAs
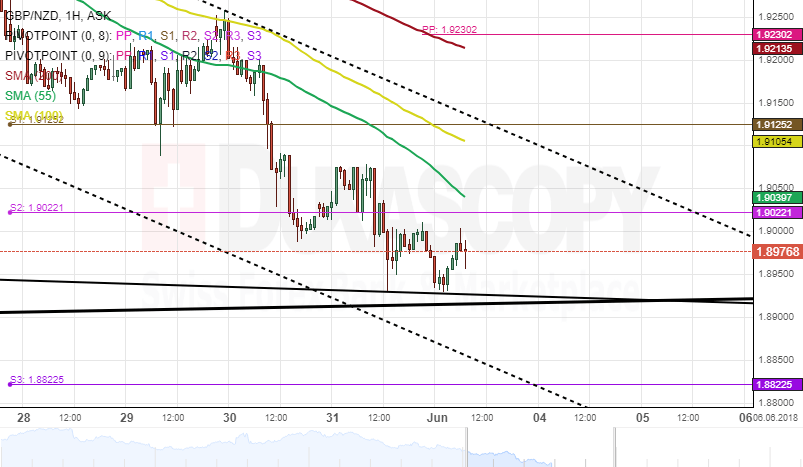
The bearish sentiment which began mid-May has guided the British Pound down against the New Zealand Dollar. This marks a 3.80% decrease in price within the last two weeks.
A strong resistance cluster set by the 100– hour simple moving average and the weekly pivot point at 1.9230 has pushed the exchange rate further south. it seems that this may point to a continuous decline for the pair.
Meanwhile, technical indicators flash bullish momentum during the following week, thus indicating that some upward correction is likely to occur next week. The pair has to surpass the monthly S2 at 1.90 before such corrective moves happen.
EUR/NZD 4H Chart: Trading In Narrow Channel
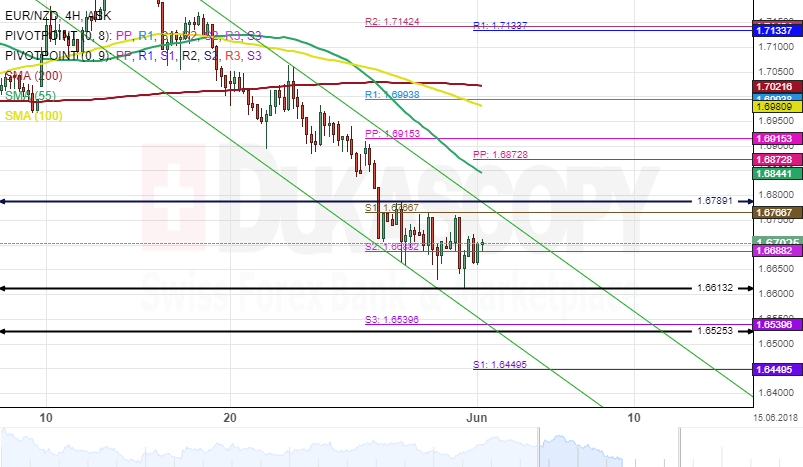
The common European currency has been trading in a descending pattern against the New Zealand Dollar since mid-May. The currency pair has depreciated 3.77% since it reversed from the upper boundary of a dominant descending channel on May 15.
The Euro continues to diminish its trading range and moving in a narrow channel. During the last three sessions, the exchange rate has been bouncing between 1.6789 and 1.6613.
It is likely that a breakout could occur from the narrow descending channel within the next trading days.
XAUUSD Intraday Analysis
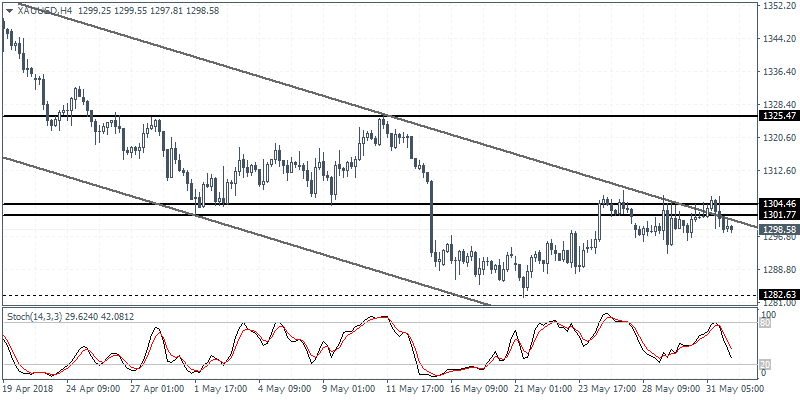
XAUUSD (1298.58): Gold prices were seen easing back following the test of resistance near 1304 - 1301 level. The reversal off this resistance level is expected to push gold prices to the downside. With the consolidation taking place, as long as the previous lows of 1282 are not breached, we expect to see gold prices staying subdued. A breakout above 1304 is needed in order for further gains to be posted. In the near term however, gold prices could remain range bound at the current price levels.
USDJPY Intraday Analysis
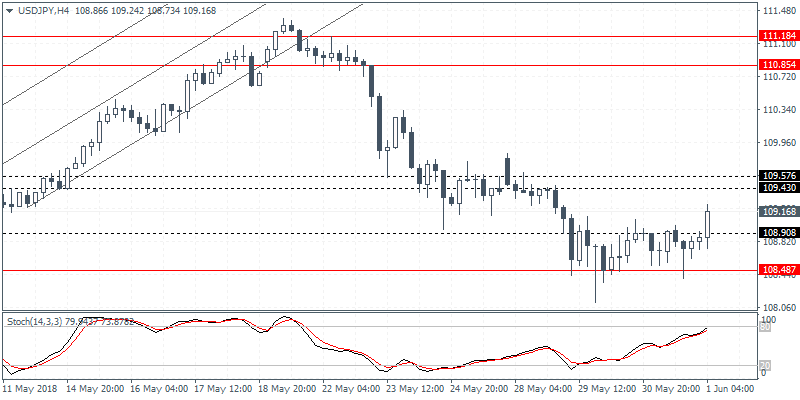
USDJPY (109.16): The USDJPY currency pair settled into a consolidation between 108.90 - 108.48 level before attempting to breakout from this tight range. The upside momentum currently is pushing the USDJPY to rally toward the next main resistance level at 109.57 - 109.43 level. If resistance is established here, we expect USDJPY to maintain the range below this resistance level. For the short term, USDJPY is likely to have formed a bottom in the near term.
EURUSD Intraday Analysis
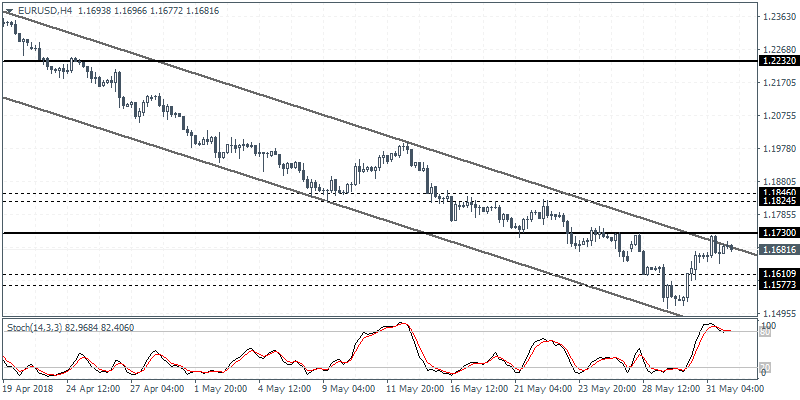
EURUSD (1.1681): The EURUSD currency pair managed to post gains for the second day but price action was mostly subdued. The early trading on Friday showed some bearish momentum in price action which indicates perhaps a moderate pullback to the gains from the previous two days. On the 4-hour chart, the recent gains coincide with the upper end of the falling price channel alongside the hidden bearish divergence. Unless the EURUSD clears the resistance level at 1.1730, we expect to see a pullback in price. Support is most likely to be established around 1.1610 - 1.1577. If price rebounds along this level, we could expect to see further gains in store.