Sample Category Title
USD/CHF Daily Outlook
Daily Pivots: (S1) 0.9823; (P) 0.9862; (R1) 0.9899; More...
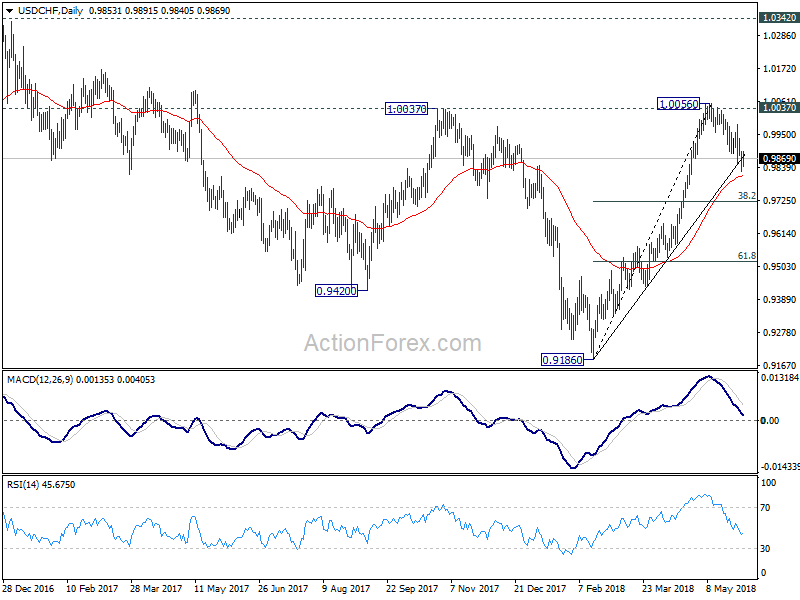
Intraday bias in USD/CHF remains on the downside, with focus on trend line support (now at 0.9872). Sustained trading below there will indicate that fall from 1.0056 is a larger scale correction, correcting rise from 0.9186. And deeper fall would be seen back to 0.9724 fibonacci level before completion. Though, rebound from current level, followed by break of 0.9982 minor resistance will bring retest of 1.0056 high.
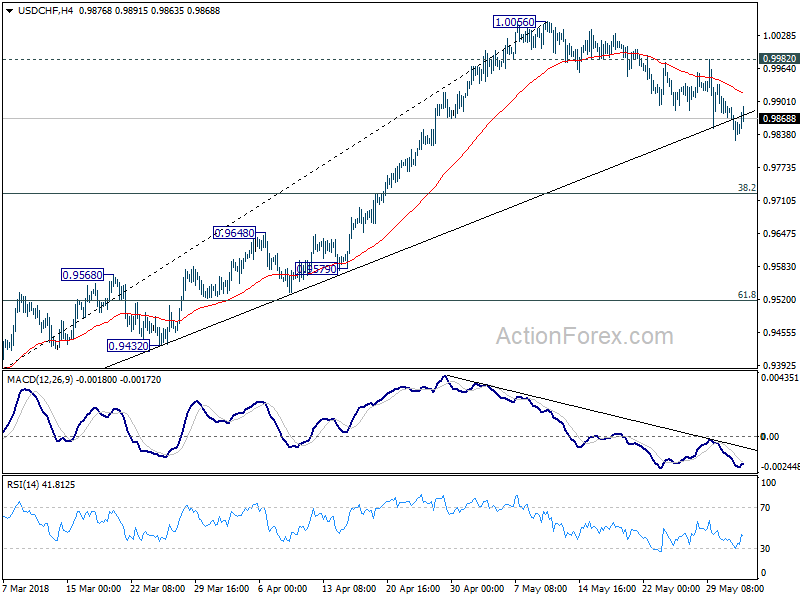
In the bigger picture, medium term decline from 1.0342 has completed with three waves down to 0.9186. Rise from there is currently viewed as a leg inside the long term range pattern. Hence, while further rally would be seen, we'd be cautious on strong resistance from 1.0342 to limit upside. For now, further rise is expected as long as 38.2% retracement of 0.9186 to 1.0056 at 0.9724 holds.
USD/JPY Daily Outlook
Daily Pivots: (S1) 108.46; (P) 108.74; (R1) 109.09; More...
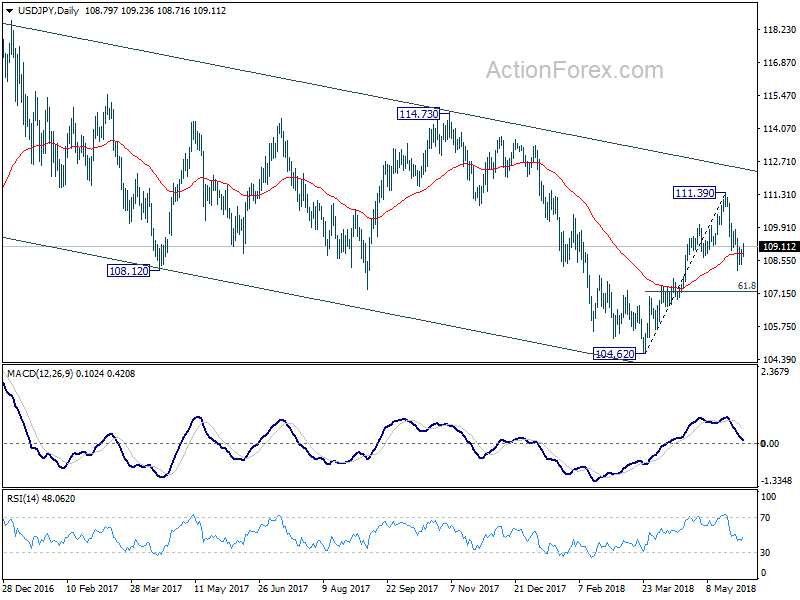
USD/JPY is staying in consolidation above 108.10 temporary low and intraday bias remains neutral first. As long as 109.82 minor resistance holds, near term outlook remains mildly bearish. Below 108.10 will target 61.8% retracement of 104.62 to 111.39 at 107.20. Break will likely resume larger decline from 118.65 for a new low below 104.62. Nonetheless, break of 109.82 will turn focus back to 111.39 resistance instead.
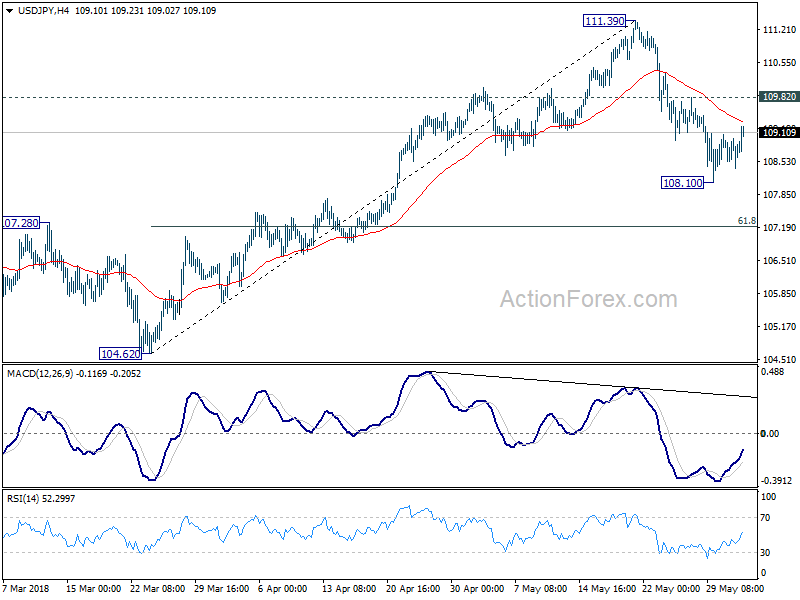
In the bigger picture, USD/JPY remains bounded in medium term falling channel from 118.65 (2016 high). The development. Current deeper than expected fall from 111.39 argues that fall from 118.65 is not finished. Break of 104.62 low would target 98.97 or even below. Though, break of 111.39 will revive the case that fall from 118.65 has completed and turn focus to 114.73 for confirmation.
AUD/USD Daily Outlook
Daily Pivots: (S1) 0.7549; (P) 0.7571; (R1) 0.7590; More...
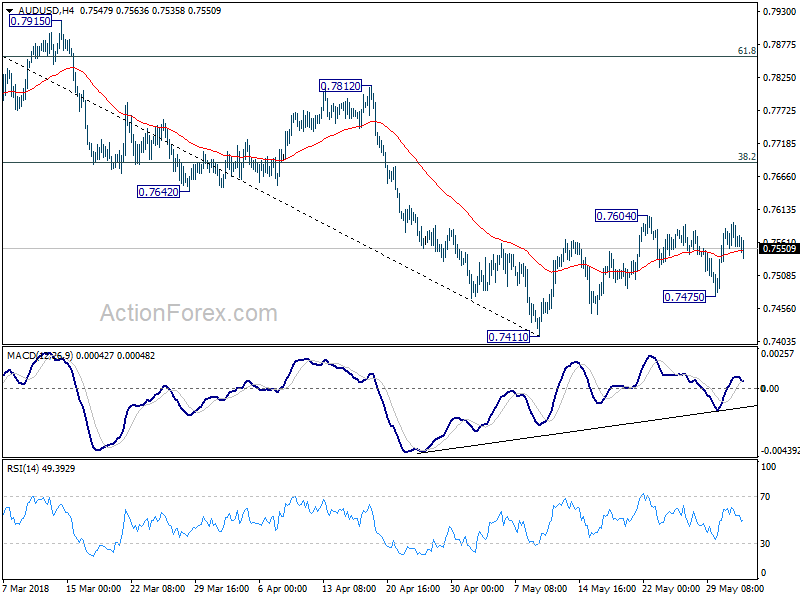
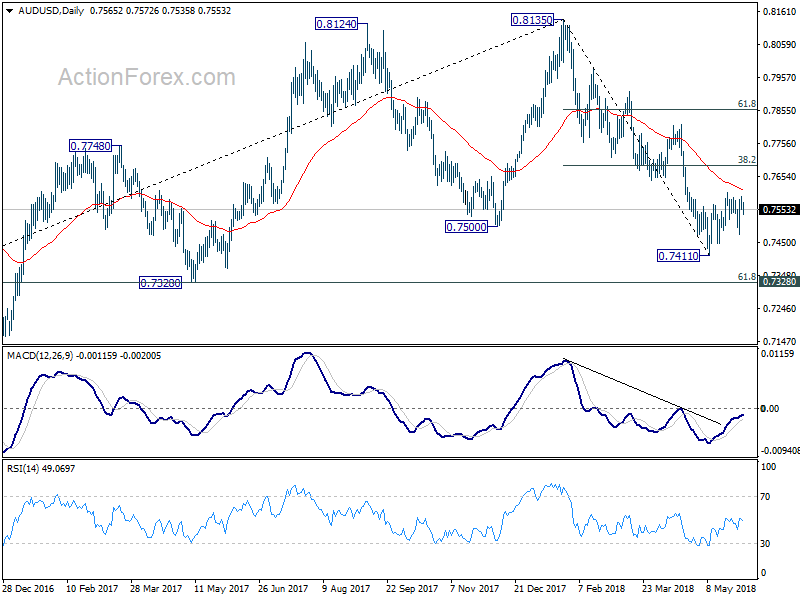
Intraday bias in AUD/USD remains neutral at this point. Above 0.7604 will extend the corrective rise from 0.7411. But we'd expect strong resistance from 38.2% retracement of 0.8135 to 0.7144 at 0.7688 to limit upside to bring decline resumption eventually. On the downside, below 0.7475 will bring retest of 0.7411 low first. Break will resume the larger decline from 0.8135 to cluster support at 0.7328 (61.8% retracement of 0.6826 to 0.8135 at 0.7326).
In the bigger picture, medium term rebound from 0.6826 is seen as a corrective move. Prior break of 0.7500 key support suggests that such correction is completed at 0.8135. Deeper decline would be seen back to retest 0.6826 low. In case of another rise, we'd expect strong resistance from 38.2% retracement of 1.1079 to 0.6826 at 0.8451 to limit upside to bring long term down trend resumption eventually.
Trade Tensions Escalate As Political Risks Fade, US Jobs Figures The Data-Highlight
Here are the latest developments in global markets:
FOREX: The US dollar index is a little more than 0.1% higher on Friday, ahead of the release of the always-important US employment report at 1230 GMT. Elsewhere, the Canadian dollar dived yesterday following discouraging news on the trade front, while the euro continued to regain ground as Italy’s political impasse came to an end.
STOCKS: Wall Street closed lower on Thursday, as an escalation of trade tensions suppressed risk appetite. The Dow Jones fell by 1.02%, while the S&P 500 and the Nasdaq Composite shed 0.69% and 0.27% respectively. That said, futures tracking the Dow, S&P, and Nasdaq 100 are all currently pointing to a notably higher open today, which may be owed to news that a government was finally formed in Italy, ending a prolonged political vacuum. In Asia, Japan’s Nikkei 225 declined 0.14% but the Topix rose by 0.1%, while in Hong Kong, the Hang Seng climbed by 0.21%. Europe was a much more optimistic story, with futures tracking all the major indices being well-into the positive territory. In particular, the Italian FTSE MIB and the Spanish IBEX 35 are expected to open higher, with futures tracking them being up by 2.6% and 1.07% respectively, as political risks in both nations appeared to be easing.
COMMODITIES: Oil prices are practically unchanged on Friday, after posting hefty losses in the previous session. Both WTI and Brent crude slumped as the announcement of tariffs by the US clouded the outlook for global trade, something that could hurt oil demand moving forward. Even a larger-than-anticipated drawdown in the weekly EIA crude inventory data was not enough to support prices for more than a few minutes. In precious metals, gold prices are also nearly flat today around $1,300 per ounce. The yellow metal finished the day lower yesterday despite trade risks coming back to the forefront; it started sliding after it found fresh sell orders near its 200-day moving average once again. That zone has been acting as a reliable resistance barrier recently, and as long as the price action remains below it, the metal’s technical outlook stays negative.
Major movers: Global trade risks heighten as European political risks fade
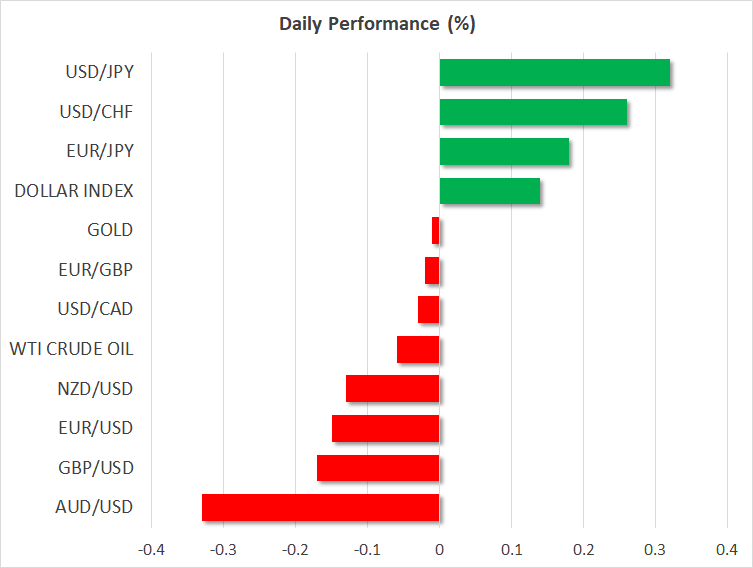
The “trade war” narrative got yet another chapter yesterday, after the US announced it will proceed with slapping tariffs on steel and aluminum imports from the EU, Canada, and Mexico. The EU said it would announce its own counter-tariffs within hours, which will be aimed at signature US products such as bourbon and Harley Davidson motorbikes. These are predominantly made in Republican states, thus targeting Trump’s voter base. Mexico and Canada replied in similar fashion to the EU, drawing a warning from President Trump that the US will agree to a fair NAFTA deal, or “no deal at all”. Both the Canadian dollar and the Mexican peso slumped, while the US dollar remained largely unfazed.
While the situation has clearly escalated, and tit-for-tat tariffs will be announced soon by nations who have long been traditional US allies, the market response was surprisingly calm. Sure, US stock markets ended the day lower and haven currencies like the yen gained a little ground against the dollar, but the magnitude of these moves was nothing like one would expect in case investors were pricing-in a material deterioration in global trade. This suggests investors still view these moves as “hardball” negotiating tactics from the US aimed at drawing out concessions, and believe the situation will eventually be resolved through talks instead of evolving into a full-fleshed trade war.
Moving forward, things could get worse before they get better. The US is currently investigating whether it should introduce tariffs on car imports, something that would disproportionally single out car-making nations like Germany, and set the stage for more retaliatory measures by the EU.
In Europe, political risks appear to be fading at a very rapid pace. A coalition government has been agreed in Italy after several months of uncertainty. The two anti-establishment parties agreed on a new economy minister, after their previous pick was rejected by the Italian President for being euro-skeptic (he will now serve as foreign minister). Italian bond yields fell sharply, while the euro continued to recover ground and looks ready to close the week in positive territory against the dollar.
In Spain, even though PM Rajoy will probably lose a no-confidence vote today, a political deadlock will likely be avoided as the leader of the socialist party, Pedro Sanchez, appears to have enough votes to become the new PM.
Day ahead: US employment report firmly in focus; trade developments also eyed
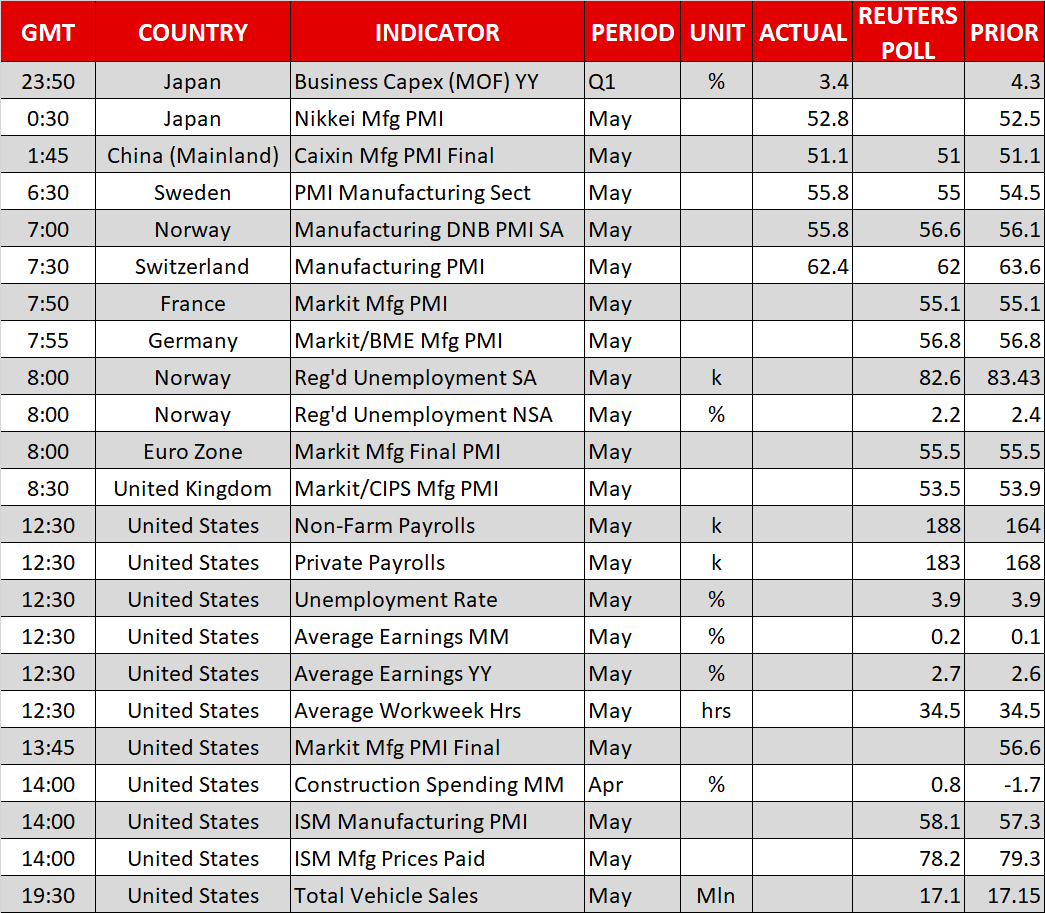
The US jobs report dominates the attention out of today’s releases, while any updates on global trade will also be eyed after the Trump administration’s decision to proceed with the imposition of tariffs on steel and aluminum from countries that are considered traditional US allies.
The Markit’s final release of eurozone manufacturing PMI for May due at 0800 GMT is anticipated to confirm the reading at 55.5. While comfortably above the 50 level, thus denoting expansion, this would also constitute the lowest print since February last year; economic momentum is easing in the euro area.
Politics remain at play in Europe and can affect positioning on the euro. In Italy, the two anti-establishment parties 5-Star Movement and League have come to an agreement on forming a government after all. Meanwhile in Spain, Mariano Rajoy is expected to be ousted from the position of prime minister in a no-confidence vote today in parliament. However, the situation in the country is more of an internal one, rather than pose risks for the rest of Europe – anti-establishment forces are not expected to take power as is the case in Italy.
Manufacturing PMI data for May will also be made public out of the UK, at 0830 GMT. This will be the first and only release – as opposed to the eurozone that also sees the release of preliminary estimates – and therefore it might prove more market moving that the respective eurozone release earlier in the day. The relevant index is projected to further deteriorate, specifically to come in at 53.5 (from 53.9 in April), its lowest since late 2006. A data miss could further push back in time market participants’ expectations for a Bank of England rate hike, consequently exerting selling pressure on sterling.
At 1230 GMT, the focus will turn to the nonfarm payrolls report for May out of the US, which also happens to be the last employment report before the Federal Reserve completes a meeting on monetary policy on June 13. Nonfarm payrolls are forecast to have increased by 188k (vs 164k in April), while the unemployment rate is expected to remain at 3.9%, its lowest since 2000. Most interest though is yet again likely to fall on wage growth which is seen as having the capacity to stoke inflationary pressures. In this respect, average earnings are anticipated to grow at a faster pace in May compared to April on both an annual (2.7% vs 2.6%) and monthly (0.2% vs 0.1%) basis.
Other US data hitting the markets throughout the rest of the day include Markit’s final manufacturing PMI for May (1345 GMT), April’s construction spending figures (1400 GMT), the ISM’s manufacturing PMI for May (1400 GMT), and May’s total vehicle sales (1930 GMT).
The trade war narrative is back after the US decided to proceed with tariffs on steel and aluminum imports from Canada, Mexico and the EU, bringing to an end the two-month exemption period it had granted previously. Some of the parties involved have already retaliated and should the situation escalate, then shock waves might reverberate across international financial markets. It should also be kept in mind that developments are expected to have implications not just for currency markets, but also equity, fixed income and commodities. Also trade-related, US Secretary of Commerce Wilbur Ross will be visiting Beijing on Saturday for more discussions with Vice Premier Liu He. The US and China have also gotten more confrontational ahead of the meeting.
In energy markets, the US Baker Hughes oil rig count is due at 1700 GMT. Also of interest to oil traders, is a planned meeting in Kuwait City on Saturday where Saudi Arabia, Kuwait and the U.A.E. will be discussing supply.
In terms of policymakers’ appearances: Riksbank Governor Stefan Ingves will be talking about current monetary policy issues at 1000 GMT, while Minneapolis Fed President Neel Kashkari – non-voting FOMC member in 2018 – will be participating in a panel discussion at 1255 GMT. However, the topic of discussion is such that renders any market sensitive comments unlikely. Lastly, Bank of England Chief Economist Andy Haldane will be giving a lecture at 1310 GMT.
Technical Analysis: USDJPY looks bullish in the short-term after bounce from 6-week low
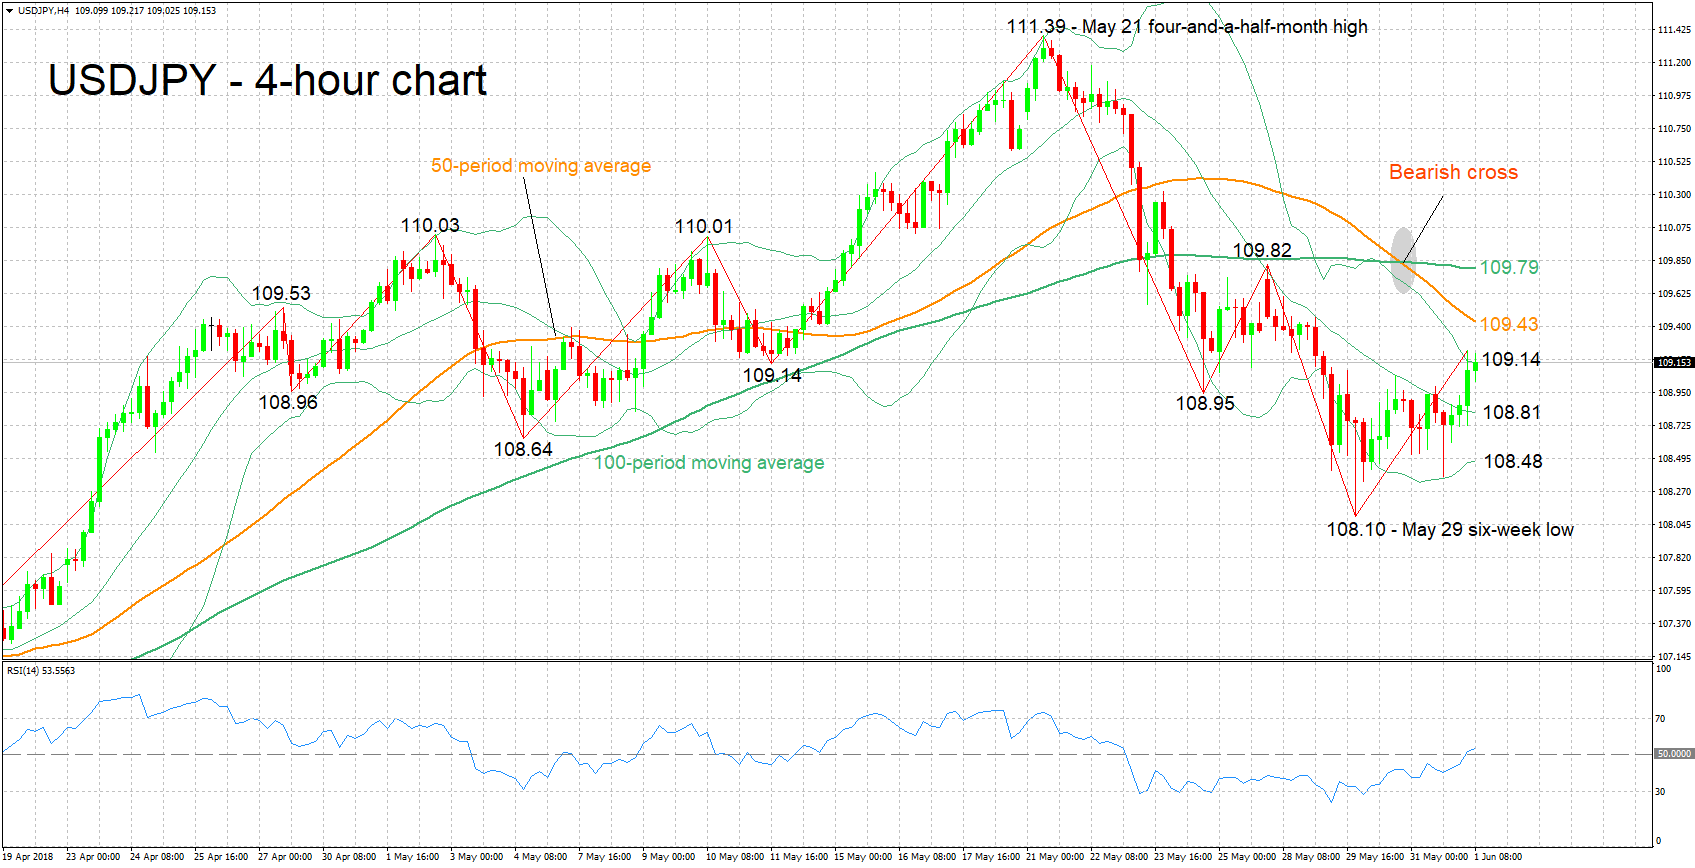
USDJPY has advanced after hitting a six-week low of 108.10 on Tuesday. The RSI continues to rise, having crossed above the 50 neutral-perceived level, in favor of a positive picture in the short-term.
An upbeat jobs report out of the US, especially on the wage growth front, is expected to boost the pair. Resistance seems to be taking place at the moment around the upper Bollinger band at 109.14 (this level itself was violated but the area around it seems to still act as a barrier). The regions around the 50-period moving average at 109.43 and the 100-period MA at 109.79 – including the 110 round figure – could act as additional barriers to stronger bullish movement.
Disappointing data out of the US, on the other hand, are likely to push USDJPY lower. Potential support to declines might come around the middle Bollinger line at 108.81 – this is a 20-period MA line –, the lower Bollinger band at 108.48, and the six-week low of 108.10 from earlier in the week.
Other US releases, as well as any safe-haven flows on the back of trade uncertainty, can also move the pair.
USD/CAD Daily Outlook
Daily Pivots: (S1) 1.2851; (P) 1.2922; (R1) 1.3026; More.....
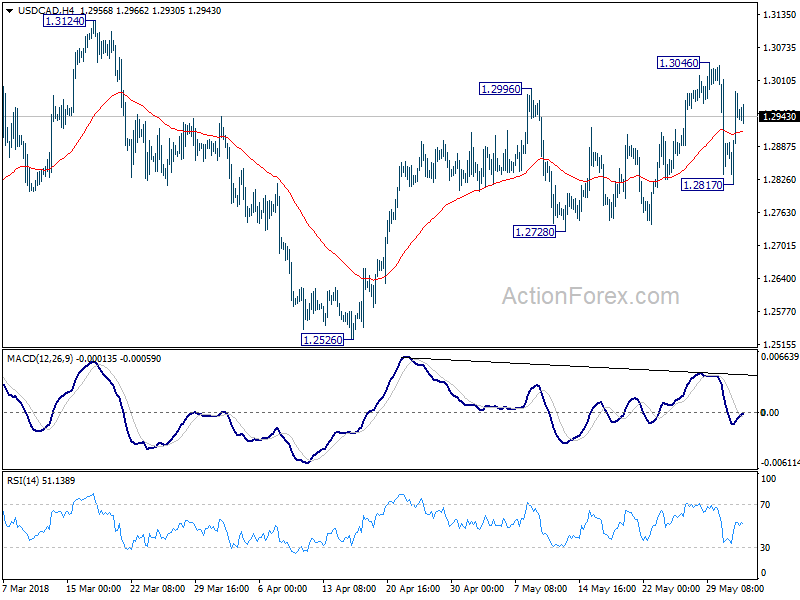
Intraday bias in USD/CAD remains neutral at this point. With 1.2728 support intact, we're holding on to the bullish view to expect further rise. Above 1.3046 will resume the rise from 1.2526 and target 1.3124 key resistance. Decisive break there will confirm medium term reversal. Nonetheless, break of 1.2728 will indicate completion of the rebound from 1.2526 at 1.3046. And in that case, deeper fall would be seen back to 1.2526 and below.
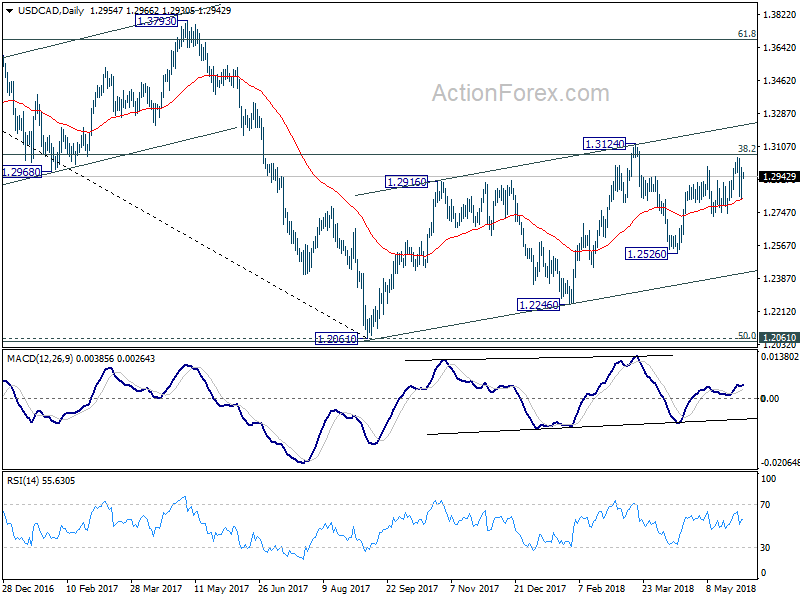
In the bigger picture, we're favoring the case that that rebound from 1.2061 has not completed yet. But there is no follow through upside momentum so far. Focus remains on 38.2% retracement of 1.4689 to 1.2061 at 1.3065. Sustained trading above there will confirm medium term bullish reversal. That is, down trend from 1.4689 has completed at 1.2061 already. In that case, next target will be 61.8% retracement at 1.3685. However, break of 1.2526 support will dampen this bullish view again. And, focus will be back on 1.2061 key support level, which is close to 50% retracement of 0.9406 (2011 low) to 1.4689 (2015 high) at 1.2048.
USDCAD Struggles Above SMAs, Signaling Further Gains In Short Term
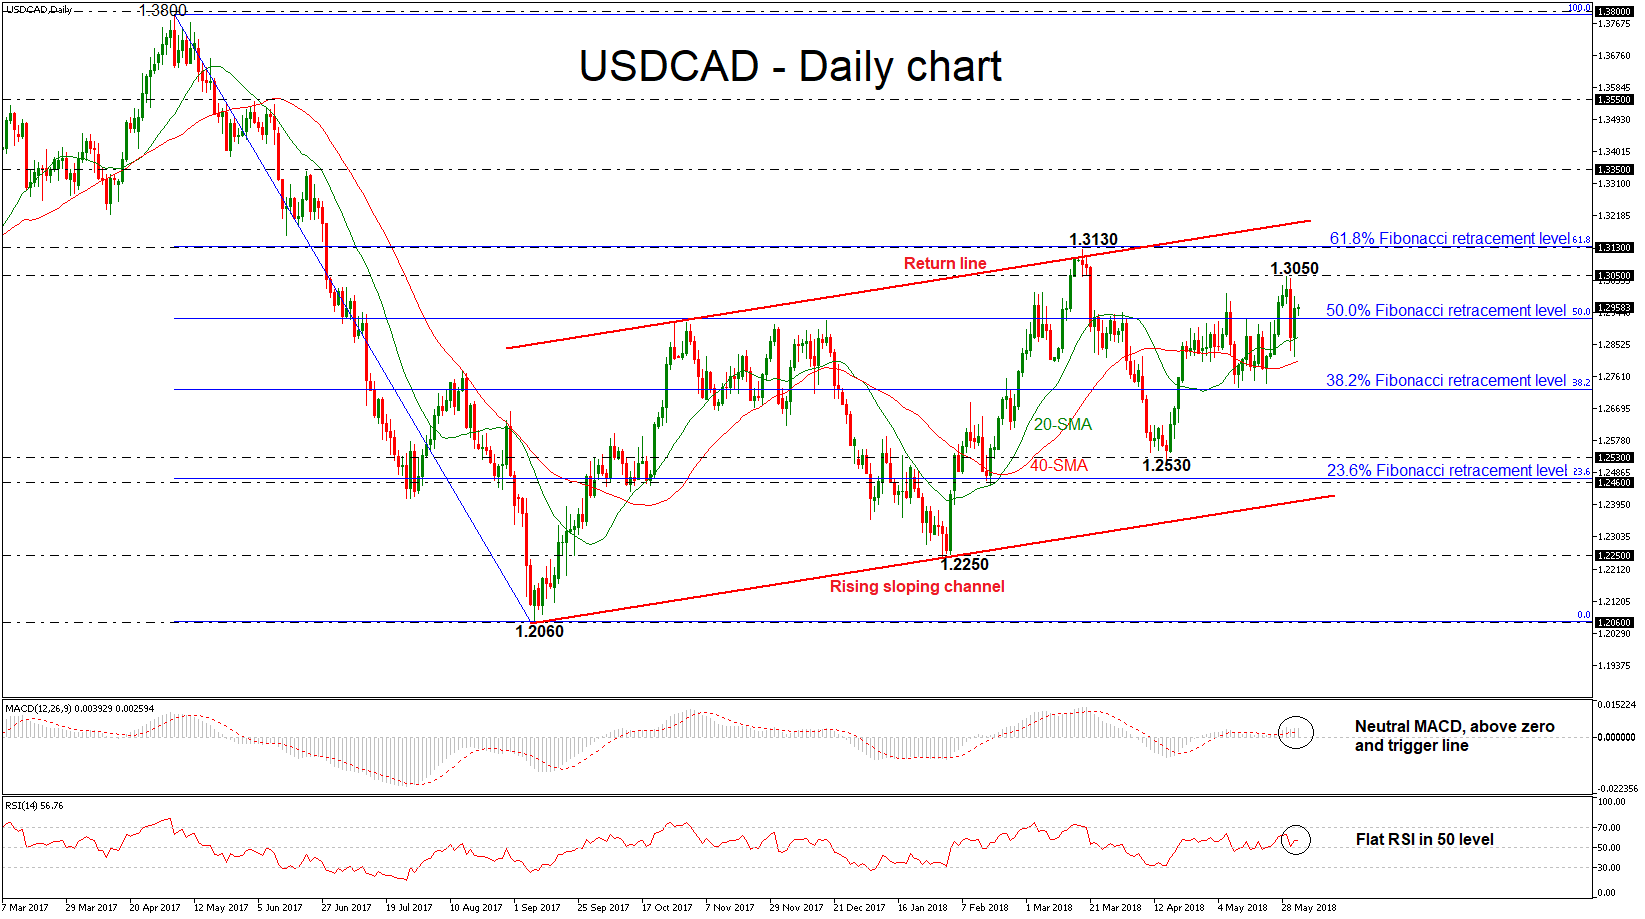
USDCAD remains above the simple moving averages in the daily timeframe over the last six days suggesting that the pair is ready for a bullish extension. After the aggressive sell-off on Wednesday, the price pared some of the losses and jumped above the 50.0% Fibonacci retracement level of the downleg from 1.3800 to 1.2060, around 1.2925, once again.
Looking at the short-term chart, based on technical indicators, momentum is too weak to provide a sustained move higher. The MACD oscillator is flattening near its trigger line in the positive area, while the RSI indicator is standing above the 50 threshold but is flattening.
In case of further upside movement, the 1.3050 resistance level could act as a significant barrier before being able to re-challenge the 1.3130 obstacle, which overlaps with the 61.8% Fibonacci mark. A climb above this region would send prices above the upward sloping channel towards the 1.3350 hurdle, suggesting a strong bullish structure.
On the flip side, the next support should come from the 20- and 40-simple moving averages (SMAs) at 1.2875 and 1.2806 respectively. A dip below this region would drive the price toward the next barrier of the 38.2% Fibonacci, around 1.2725. Further losses could send the pair until the next low of 1.2530, taken from the trough on April 17 and significantly weaken the bullish medium-term picture.
Overall, USDCAD has been developing within a rising sloping channel since September 2017, failing several times to exit from this range.
GBP/JPY Daily Outlook
Daily Pivots: (S1) 144.07; (P) 144.70; (R1) 145.27; More...
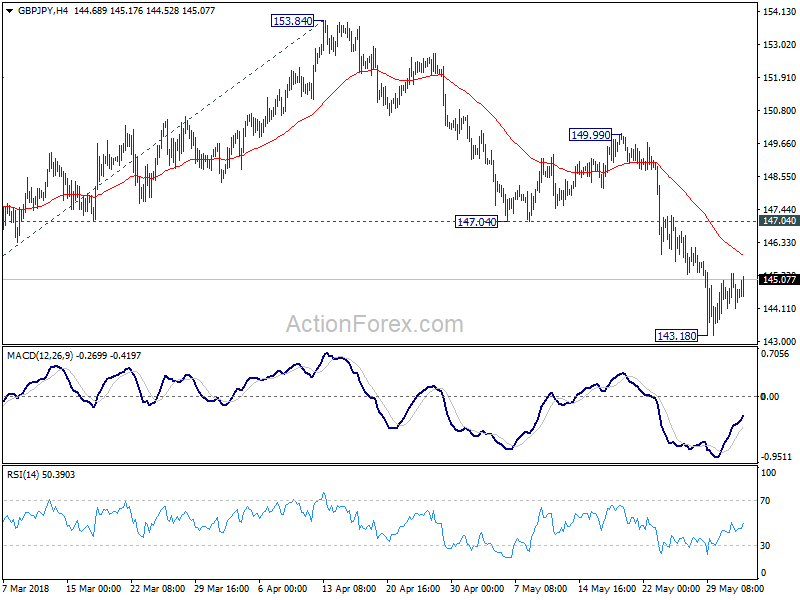
Intraday bias in GBP/JPY remains neutral as consolidation from 143.18 is still in progress. Further recovery could be seen. But upside should be limited by 147.04 support turned resistance to bring decline resumption. Break of 143.18 will extend the fall from 159.59 to 100% projection of 156.59 to 144.97 from 153.84 at 142.22 next.
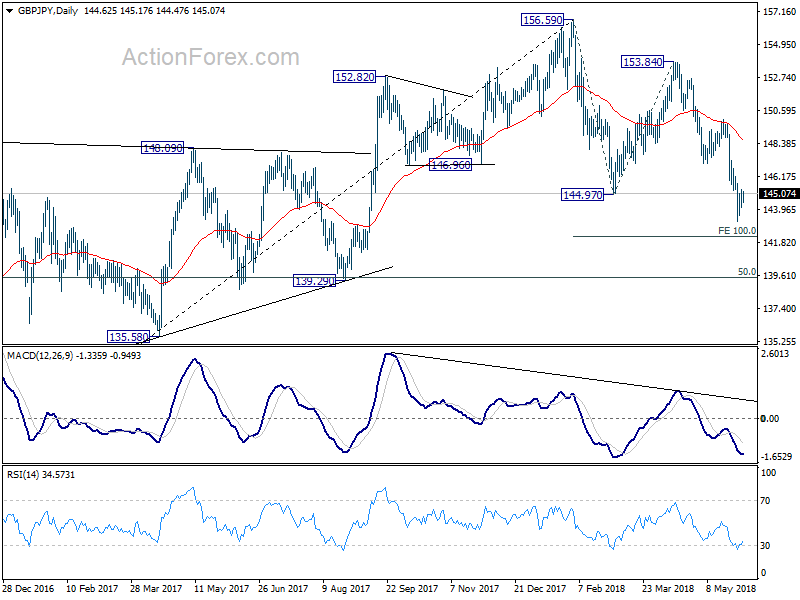
In the bigger picture, for now, we're treating price actions from 156.59 as a corrective move. Therefore, while deeper fall is expected, strong support should be seen above 139.29 cluster support (50% retracement of 122.36 to 156.59 at 139.47) to contain downside and bring rebound. There is still prospect of extending the rise from 122.36. However, considering that GBP/JPY failed to sustain above 55 month EMA (now at 153.94), firm break of 139.29 will confirm trend reversal and turn outlook bearish.
EUR/JPY Daily Outlook
Daily Pivots: (S1) 126.47; (P) 127.09; (R1) 127.85; More....
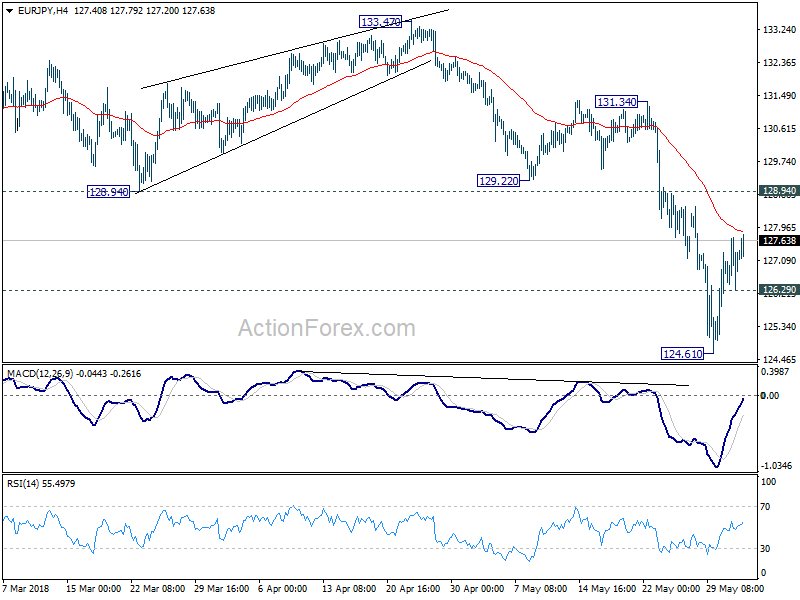
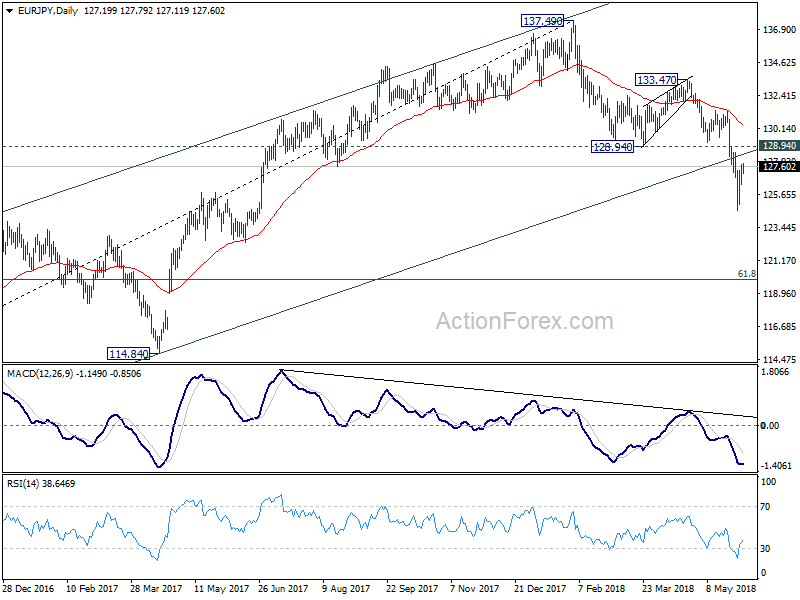
EUR/JPY's recovery from 124.61 is still in progress. While further rise cannot be ruled out, upside should be limited by 128.94 support turned resistance to bring fall resumption. On the downside, below 126.29 minor support will bring retest of 124.61 first. Break will resume whole fall from 137.49 and target next medium term fibonacci level at 119.90.
In the bigger picture, the case of medium term trend reversal continues to build up. That is rise from 109.03 (2016 low) could have completed at 137.49 already. This is supported by bearish divergence in daily MACD current downside acceleration, as well as the break of 38.2% retracement of 109.03 to 137.49 at 126.61. Deeper decline should be seen to 61.8% retracement at 119.90 and below. This will be the preferred case as long as 128.94 support turned resistance holds.
GBPUSD Turning Bearish Below 1.3300
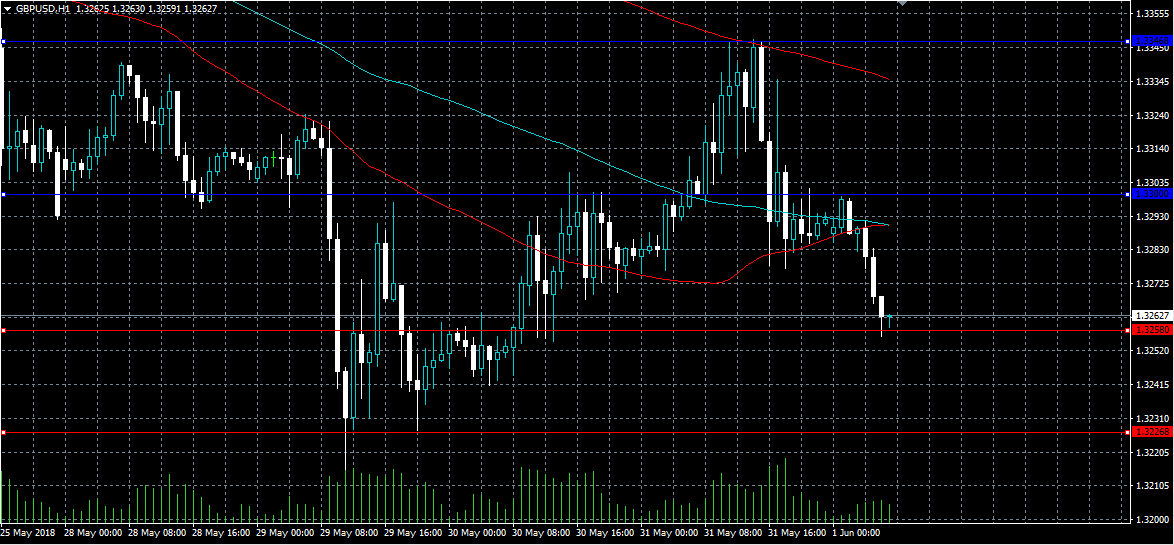
The British pound has fallen back below the key 1.3300 level against the US dollar, following a strong rebound higher in the value of the US dollar index on Thursday. The GBPUSD pair is currently testing key support around the 1.3258 level, after sterling buyers failed to gain traction above the 1.3300 handle. Traders now look towards key PMI data from the UK economy, and the release of the US Non-farm payrolls job report later today.
The GBPUSD pair is now intraday bearish while trading below the 1.3300 level, key support is located at the 1.3258 and 1.3226 levels.
If the GBPUSD pair moves back above the 1.3300 level, we may see technical buying towards the 1.3346 and 1.3400 levels.
EUR/CHF Daily Outlook
Daily Pivots: (S1) 1.1470; (P) 1.1521; (R1) 1.1579; More....
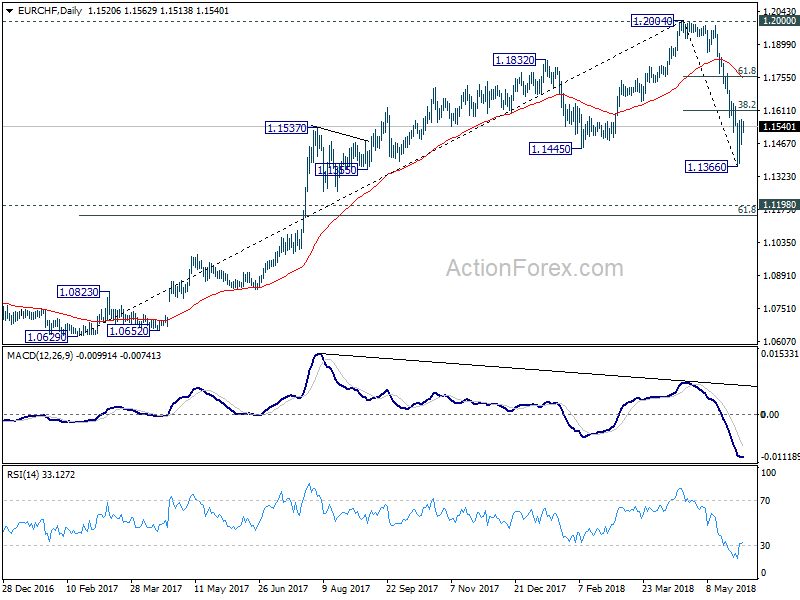
Intraday bias in EUR/CHF remains neutral as consolidation from 1.1366 is still in progress. Further recovery could be seen. But we'd expect strong resistance from 38.2% retracement of 1.2004 to 1.1366 at 1.1610 to bring another decline. Below 1.1366 will resume the fall from 1.2004 and target next key support zone between 1.1154 and 1.1198.
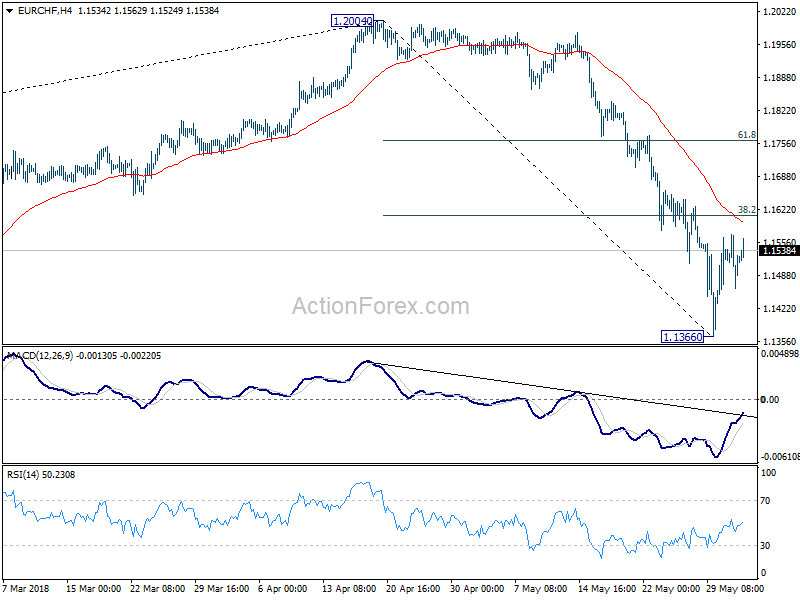
In the bigger picture, current development suggests solid rejection by prior SNB imposed floor at 1.2000. Considering bearish divergence condition in daily MACD, 1.2004 should be a medium term top. And price action from 1.2004 is correcting the up trend from 1.0629. The cross has met 1.1445 already, which is close to 38.2% retracement of 1.0629 to 1.2004 at 1.1479. We'd expect strong support from there to bring rebound to extend the medium term corrective pattern. However, sustained break of 1.1445 will target next key cluster level at 1.1198 (2016 high), 61.8% retracement of 1.0629 to 1.2004 at 1.1154.