Sample Category Title
Trump’s White House issued strong statement on China, unexpected yet expected
The White House issued strong worded statement regarding trade relationship with China today.
From a fact sheet titled "President Donald J. Trump is Confronting China's Unfair Trade Policies", it's said that "China has consistently taken advantage of the American economy with practices that undermine fair and reciprocal trade."
And it accused that "China has aggressively sought to obtain technology from American companies and undermine American innovation and creativity."
The statement noted that "President Trump has taken long overdue action to finally address the source of the problem, China's unfair trade practices that hurt America's workers and our innovative industries." And, "President Trump has worked to defend America's intellectual property and proprietary technology from theft and other threats."
Simultaneously, there's another statement outlining the Steps to Protect Domestic Technology and Intellectual Property from China's Discriminatory and Burdensome Trade Practices.
The Chinese Ministry of Commerce responded in a statement that the US statements were unexpected yet expected. It said the today's statement contradict the consensus reached in Washington not long ago. And the MOFCOM pledged that "China has confidence, ability, and experience to safeguard the interests of the Chinese people and the country's core interests. China urges the United States to act in accordance with the spirit of the joint statement."
To us, yes, it's unexpected yet expected.
Recalling what European Council President Donald Tusk said, he accused the US of "capricious assertiveness". And in his own words again:
https://twitter.com/eucopresident/status/996731038062862336
ECB Lautenschlaeger: First hike around mid 2019 not entirely out of ballpark
ECB hawk Sabine Lautenschlaeger said that "June might be the month to decide once and for all to gradually end net asset purchases by the end of this year." And, "a first hike around the middle of 2019 is not entirely out of the ballpark."
Despite recent soft batch of data, she emphasized that "we are seeing that the pace of growth has become more moderate, but we are not seeing a turning point". And, "we remain confident in the strength of the economy."
Cottarelli didn’t present cabinet to president Mattarella, possibly going to straight to snap election
To the market's surprise (and actually that make sense), Italian Prime Minister designate Carlo Cottarelli didn't present his cabinet to President Sergio Mattarella at the meeting today. The president's spokesman Giovanni Grasso said that "the prime minister-designate met with the president and told him about the current situation. The two will meet again tomorrow morning."
It's obvious that the caretaker government won't have enough confidence vote. And in any case, an early election, possibly in August, is the likely outcome. So it actually makes sense for Cottarelli to go straight forward to snap election.
Yen stays strong, DOW selloff instensifies
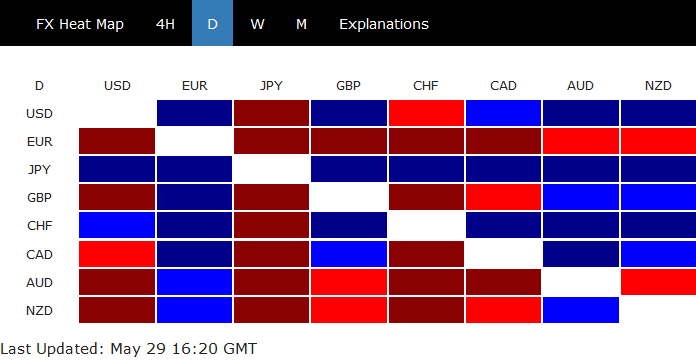
Yen remains the strongest one today, followed by Swiss Franc as risk aversion dominate. Euro is suffering the worst selling as the eye of the storm lies in Italy. Australian and New Zealand Dollar follow as the weakest.
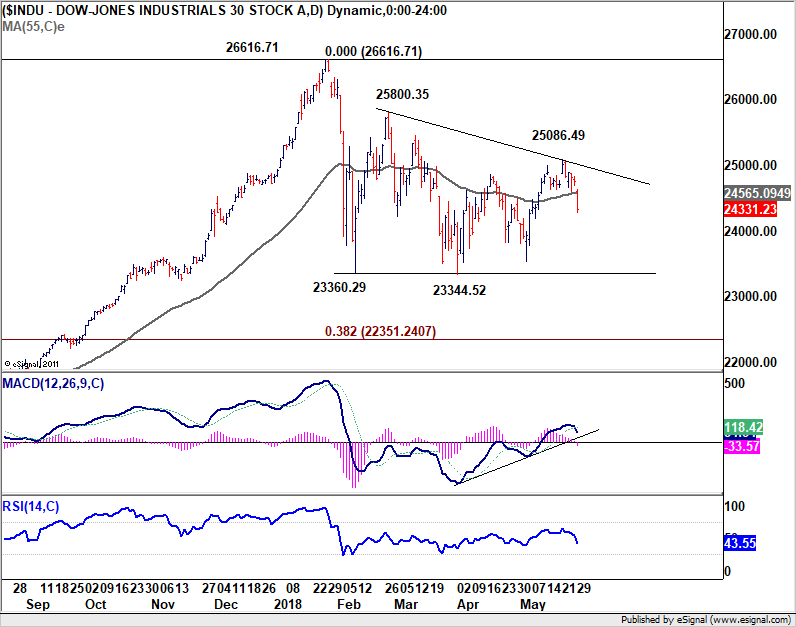
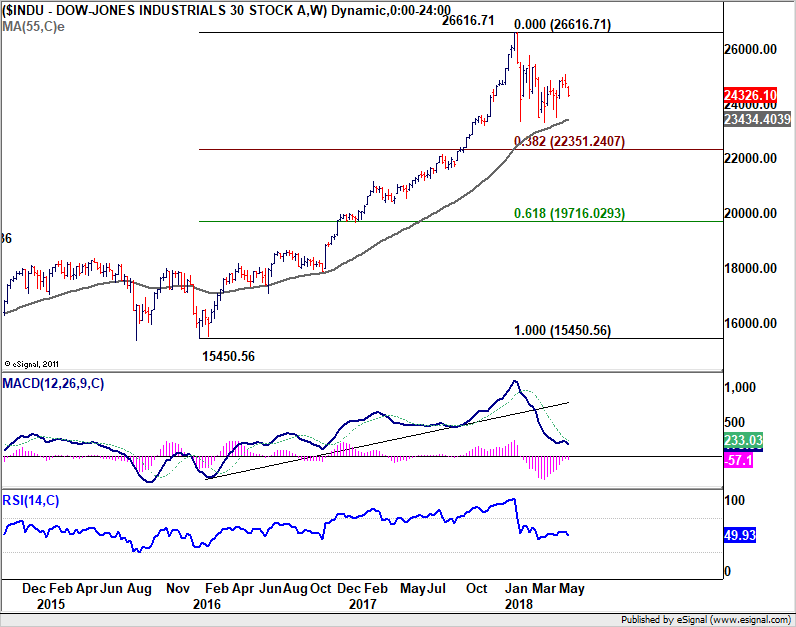
DOW's selloff accelerates notably today and it's now down more than -1.6% at the time of writing. The development suggests that choppy recovery from 23344.52 could have completed at 25086.49. That's somehow a disappointment as it cannot even tough 25800.35 resistance. But after all, our view is unchanged. That is price actions fro 26616.71 is a corrective pattern that's still unfolding. It should at least have a take on 38.2% retracement of 15450.56 to 26616.71 at 22341.24 before completion. Now, 23344.52 support is the target for near term.
US: Cut the Unemployment Rate Some Slack
Executive Summary
A growing chorus of employers is expressing difficulty in finding workers as the labor market has tightened over the past few years. Currently, there is only one unemployed person per job opening compared to 6.5 in the wake of the Great Recession. The unemployment rate is lower today than at any point in the past 18 years. Even more generous measures that account for the workers not officially counted as unemployed point to the tightest labor market since the height of the 1991-2001 expansion.
There are a number of reasons to believe that the unemployment rate, currently 3.9 percent, will soon sink below the 3.8 percent rate last reached in April 2000. An older workforce and slower population growth among working-age adults alone point to lower measures of unemployment. Just how low the unemployment rate may go, however, will depend on whether demographic constraints are combatted by greater labor force participation.
We see a number of tailwinds to labor force participation, including rising wages and the increased ability/need for older workers to remain employed. Yet mismatches between the location of job growth and the skills of workers not currently employed remain hurdles to a full recovery in participation among prime-age workers, as does opioid abuse and high incarceration rates. These challenges suggest that even accounting for lower labor force participation today, the job market is tight, as indicated by the official unemployment rate.
Beyond the Unemployment Rate, the Labor Market Is Tight
In no other period has the traditional unemployment rate been met with as much skepticism as it has in the current economic expansion. To be considered unemployed in the "official" measure of unemployment, workers must have actively searched for a job in the prior four weeks. Yet the severity of the past recession led many workers to at least temporarily stop looking for employment, limiting the efficacy of the unemployment rate in capturing labor market slack earlier in this cycle.
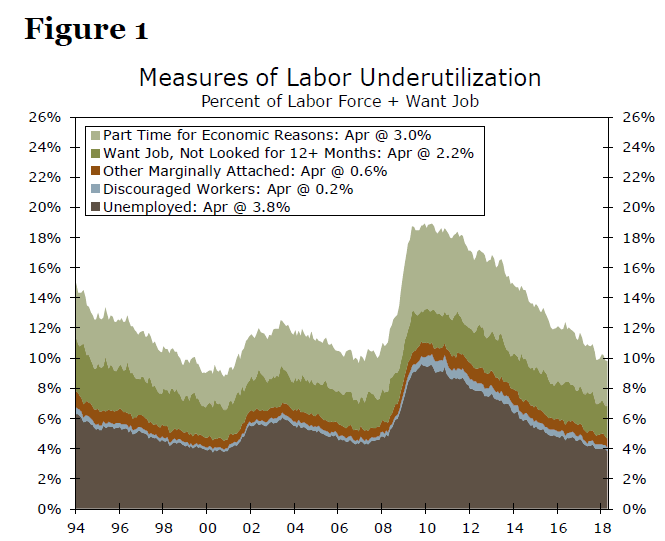
Nearly nine years on, the unemployment rate sits at an 18-year low of 3.9 percent. It is not the only measure, however, that suggests the labor market has more than recovered from the Great Recession. Whether including workers specifically not looking for a job because they are discouraged about their prospects, or taking a wider view and counting any worker who claims to want a job, the pool of available labor is also at an 18-year low (Figure 1). The only sign we see that the slack may not be quite as low as during the heyday of the late-1990s/early-2000s is when adding under-employed workers to the mix. That pushes the rate of available workers up to 9.8 percent, two ticks above the 9.6 percent low of the previous expansion.
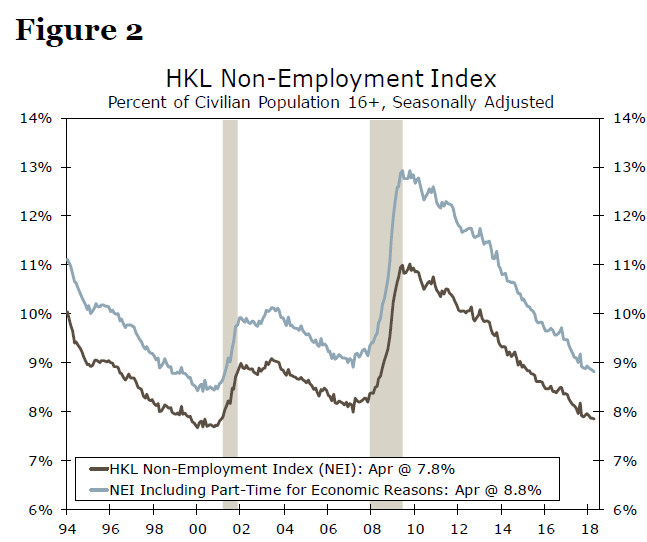
It is worth noting, however, that not all workers outside the labor force or officially unemployed are equally likely to become employed. Researchers at the Federal Reserve, therefore, have created a measure of "non-employment" that reflects the varying likelihood that any person without a job will become employed.1 When also including under-employed workers, this highly encompassing measure of slack also indicates the labor market is the tightest it has been since the 1991-2001 expansion (Figure 2)..
How Low Can You Go?
With the slack disappearing even on the fringes of the labor market, how much lower might the unemployment rate go? That depends in part, of course, on the near term demand outlook for labor. Continued growth in the economy through 2019—likely at the strongest pace of the expansion to boot—should keep workers in high demand. However, the lows to which the unemployment rate could plumb will also depend on supply constraints, which tend to be more structural.
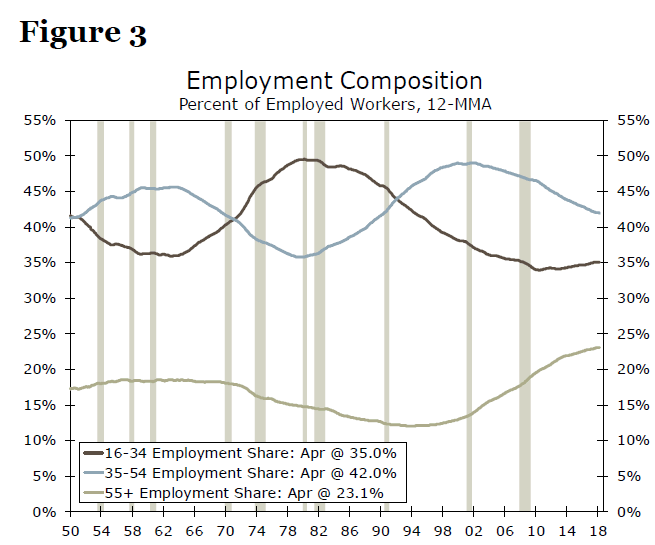
Among those is an aging workforce. Nearly a quarter of workers are over the age of 55 (Figure 3). Older workers have lower rates of unemployment since they are less likely to switch jobs and more likely to exit the labor force if unemployed. Therefore, the older composition of the workforce, on its own, favors the unemployment rate breaching the 3.8 percent low of 2000.
The aging workforce is also a function of slower population growth in recent decades. Since 2010, the civilian population ages 16-64 has grown at an average annual rate of 0.4 percent per year compared to 1.1 percent as recently as the 2000s (Figure 4). Slower growth in the supply of potential labor has constrained the availability of workers beyond the cyclical demand drivers. In a previous report, we estimated that in light of this dynamic, monthly payroll gains would only need to average 70,000-100,000 to keep the unemployment rate unchanged.2 Taking the top end of that range, our expectations for employment growth to average around 160,000 through the end of 2019 suggests the unemployment rate could reach as low as 3.5 percent if the labor force participation rate remains unchanged at 62.9 percent.
Labor Force Participation: Willing and Able?
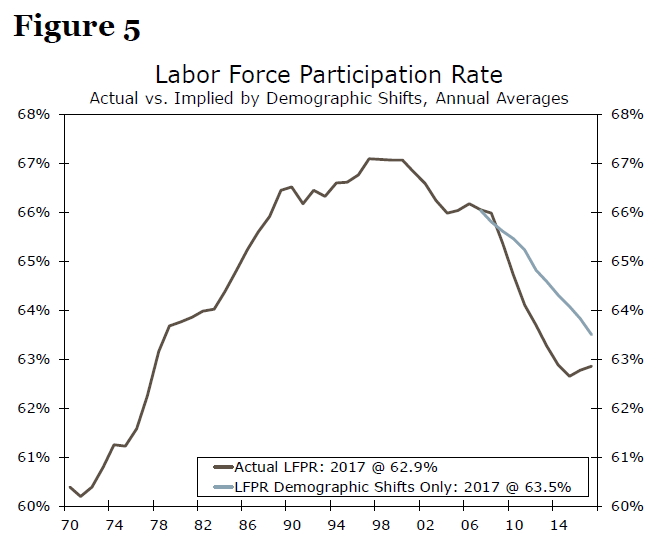
Any assumption about where the labor force participation rate will go has considerable uncertainty associated with it. Demographics have weighed heavily on the participation rate as more of the Baby Boomer generation has aged into retirement. Holding participation rates constant since 2007 suggests shifting demographics have accounted for about 80 percent of the drop in labor force participation over the past decade (Figure 5).
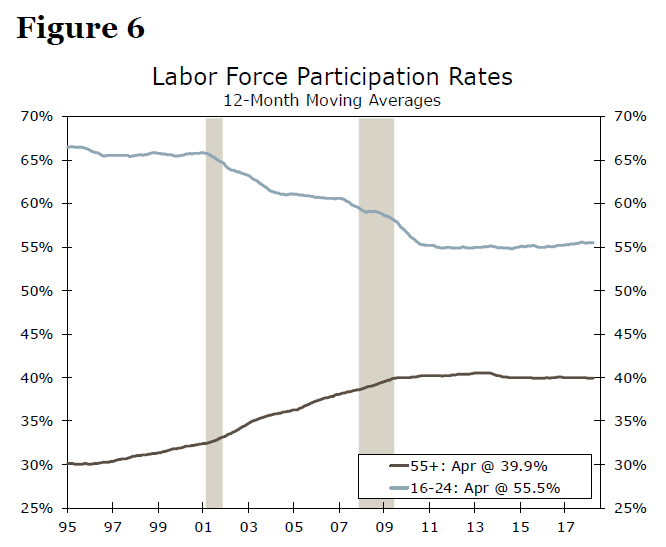
That said, participation rates among older workers have trended up since the early 2000s as health and longevity have improved and the responsibility to save for retirement has shifted to more employees. At the same time, young Americans (under age 25) have delayed entering the workforce in favor of more schooling. Participation among both the young and old, however, has been fairly stable the past few years as the stronger economy (and financial markets) has at least temporarily arrested these longer-term trends (Figure 6).
Prime Age Participation: Limited Room for Improvement
A bigger question surrounding the potential amount of slack remaining in the labor market hangs over Americans in the prime of their working years. Labor force participation for the population ages 25-54 has yet to fully recover following the Great Recession (Figure 7). Those still sitting on the sidelines represent an important potential source of labor market slack, should they become willing and able to search for work. If the prime-age participation rate immediately returned to its 2007 level, the flood of new workers would bring the overall unemployment rate up to 4.5 percent— much higher than the current 3.9 percent.
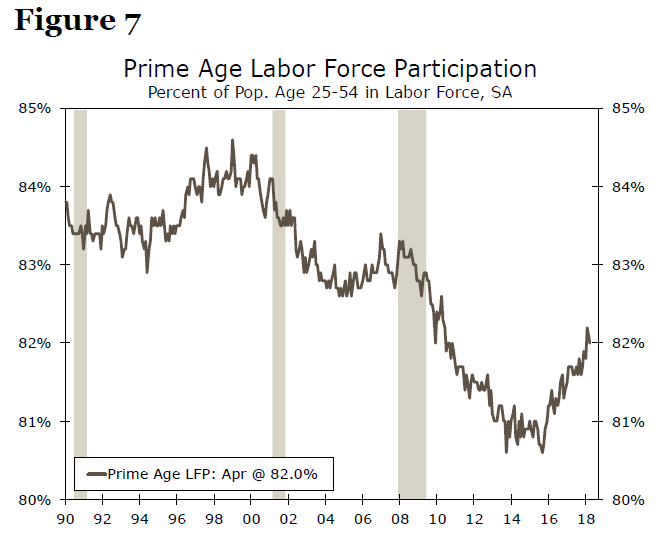
We see some scope for the prime participation rate to continue rising, although a full recovery to pre-recession levels faces a number of hurdles. On the bright side, the strong job market (meaning higher wages and increased job opportunities) is encouraging more Americans to enter the labor force. Since the start of 2016, the prime-age participation rate has ticked up 0.8 percentage points, a difference of 1.0 million individuals through April. This has put the prime participation rate back to where it was in late 2010.
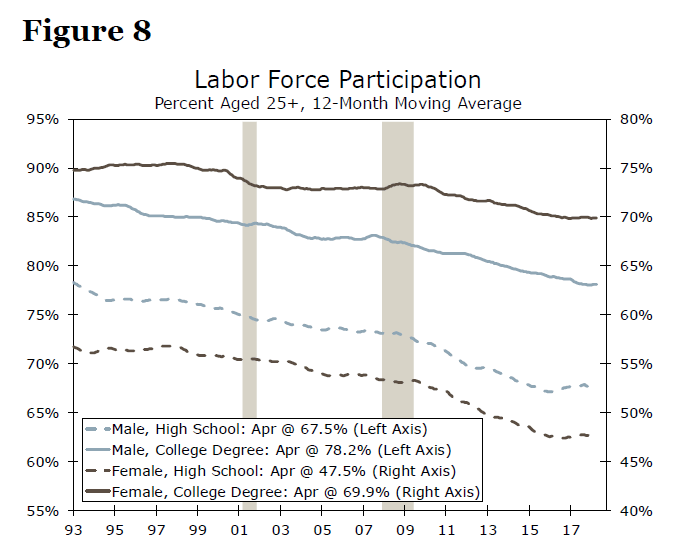
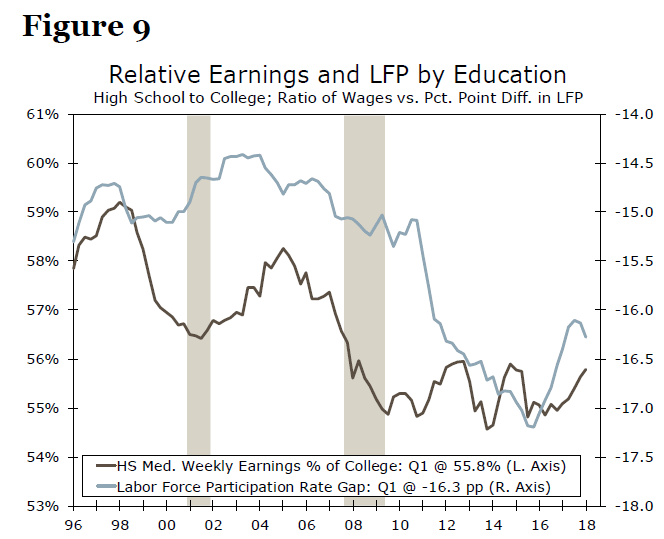
Breaking out trends by education and gender, we see that the recent recovery in participation rates has been concentrated among men and women with less schooling. Men with only a high school education, who experienced the largest drop in participation post-recession, have returned to the labor force more quickly than most other groups since January 2016 (Figure 8). This uptick in participation has coincided with rising relative wages for high school-educated workers (Figure 9), which indicates increased demand for these workers and larger income returns to work. As demand for labor and wages continue to rise, in particular for Americans who have been most likely to drop out of the labor force, we would expect to see further gains in overall labor force participation.
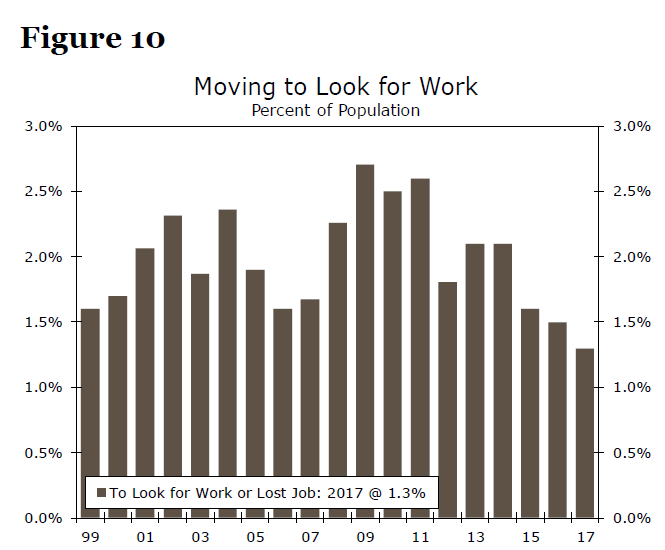
Yet structural factors will likely prevent labor force participation from returning to its level in the mid-2000s. Among those is a mismatch between where workers are willing and able to live and where job openings are located. Since 2008, 80 percent of new jobs have been created in the nation's largest metros (the 54 areas with populations of one million or more). Only 56 percent of the U.S. population lives in these metros, however, and Americans have become more reluctant to relocate over the past 30 years.3 The percentage of the population moving to look for work or because of a lost job fell to 1.3 percent in 2016-2017, the lowest level since the series began in 1998 (Figure 10).
New jobs also may not match the skillsets of workers on the sidelines. Trade and automation have reduced the demand for workers in less-skilled but high-paying fields like manufacturing, which employs about two-thirds as many people as it did 30 years ago. Lower-skilled jobs have primarily been added in the service sector, which tends to pay much lower wages than manufacturing. While high-school educated men in the 1980s made about 75 percent of what their college-educated counterparts earned, this ratio has fallen to about half.4 Relative wages for high-school educated workers have increased somewhat in the past two years, at the same time as the participation gap has shrunk, but are not likely to return to historical levels. Americans who do not have the skills to work in emerging fields and are unwilling to accept the reduced wages for what low skilled jobs are available remain unlikely to re-enter the workforce even as the labor market continues to tighten.
Putting aside the nature or location of jobs being created, several other long-term factors are weighing particularly hard on the labor force participation rate of prime-age workers. Recent research has attributed about 20 percent of the decline in men's labor force participation from 1999 to 2015 to increased opioid prescriptions during this period.5 Opioid abuse has not been caused by the labor market's weakness following the Great Recession, but rather by the availability of prescriptions.6 While efforts are being made to reduce opioid prescriptions and address addictions, the issue looks unlikely be solved by a hot labor market and will likely continue to weigh on participation rates over the near term.
Furthermore, rising incarceration rates over the past 40 years mean a larger portion of the population have criminal records. A recent study estimates that 3 percent of the U.S. adult population has been to prison and that 8 percent of adults have a felony conviction.7 A conviction makes it harder for individuals to work because of employer reluctance to hire applicants with criminal records. The U.S. incarceration rate has declined slowly since peaking in 2006, but it will take a long time to meaningfully reduce the percentage of the population with criminal records.
Conclusion: Even with Low Participation, the Job Market Is Tight
The labor market is as tight as it has been at any time since the 1990s, as measured by the unemployment rate and broader measures of labor market slack. Under-employment is slightly more elevated than at the end of the previous economic expansion, but not by much. Rising wages and greater availability of jobs may convince more Americans to enter the labor force. However, structural factors will keep labor force participation lower than in previous decades. Therefore, we see little remaining slack inside or outside the official definition of the labor force. Employers are likely to continue struggling to fill open positions, and we expect continued upward pressure on wages as a result.
British Pound Loses Ground, 1.32 Line Under Pressure
The British pound has posted losses in Tuesday trade. In the North American session, GBP/USD is trading at 1.3263, down 0.36% on the day. Earlier in the day, the pair touched a low of 1.32o4, its lowest level since November. On the release front, CB Consumer Confidence dipped to 128.0, missing the estimate of 128.0 points. The U.K will publish the BRC Shop Price Index. On Wednesday, the US publishes ADP nonfarm payrolls and Preliminary GDP.
The health of the British economy is raising alarm bells. Economic growth in the first quarter was weaker than expected, and the unseasonably snowy weather in March cannot explain away the economic slowdown. Inflation has dropped to 2.4%, and the Office for National Statistics had a bleak message for investors, noting that GDP was a negligible 0.1% in the first quarter. At its May meeting, the Bank of England has reduced its forecast for growth in 2018 to 1.4%, down from the 1.8% forecast in February. With the May government still mired in trying to sort out the endlessly complex divorce with the European Union, the British pound could continue to face headwinds in the second quarter. A rate hike would boost the currency, but the BoE may be reluctant to make a move – the bank had to backtrack from an expected rate increase earlier in May, and there is growing speculation that we will see a repeat (lack of) performance at the BoE’s August meeting, with the odds of an August rate hike at less than 50 percent.
One of the most talked about meetings in recent memory continues to dominate the headlines, but the proposed summit between President Trump and North Korean leader Kim Jong-un is yet to be finalized. The two leaders are scheduled to meet in Singapore on June 12, but curiously, neither side will confirm whether the meeting is on. Last week, Trump sent a letter to Kim, saying that Trump was canceling the much-anticipated meeting. However, the White House has since sent a team to Singapore and a senior North Korean official is on his way to Washington to meet with Secretary of State Mike Pompeo. These moves have fueled speculation that the summit will indeed take place.
Do U.S. Government Deficits Matter Anymore?
Highlights
- The combination of U.S. tax cuts and increased government spending will worsen the deficit amidst an expanding economy, when the government’s revenue base is typically at its best. This begs the question: what will government finances look like when the next recession hits?
- We answer this question by designing an economic recession scenario. Even though the magnitude of our recession is nowhere near the scale of the 2008 financial crisis, deficit levels actually approach that period. This adds to a debt burden that was already set to rise thanks to a structural deficit.
- Given America’s unique status as the preeminent global reserve currency, a worsening fiscal scenario in a recession is unlikely to trigger a fiscal crisis, as it might for an emerging market. But, it will exact an economic and political toll.
- These larger deficits make it more difficult for political leaders to apply fiscal stimulus to counteract the recession effects on household and corporate income. Likewise, the worsening debt burden can restrain the pace of economic recovery.
- Higher debt service costs plus expanding demographic pressures for Medicare and Social Security will take a larger share of government coffers, leaving less room for the federal government to spend on other priorities.
The biggest change to the U.S. economic outlook over the past six months has been the double-dose of fiscal stimulus from Washington: first tax cuts, then a large two-year boost to government spending (BBA18). We have discussed the impact of these measures (see here and QEF), alongside the concern of deliberately creating larger deficits in good economic times. Now, we explore what has become an increasing curiosity among our clients: what could happen to U.S. government finances when the next recession hits? To be clear, this is scenario-based analysis and we are not forecasting a recession in our two-year outlook. But, it’s well documented that this economic cycle is long in the tooth, and this typically brings a greater risk of a build-up in excesses and greater sensitivity to changes in policy.
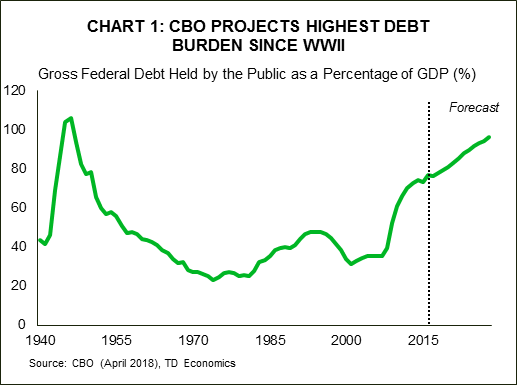
The Congressional Budget Office (CBO) estimated that the combination of tax cuts and increased spending would grow the deficit from 3.4% of GDP in 2017, to over 5% by 2022. The combination of larger deficits and an increasing burden of Medicare and Social Security due to population aging causes the debt-to-GDP ratio to hit the highest level since 1946 (see Chart 1). These projections assume a consistent period of economic growth, averaging 2.2% in real terms (4.3% nominal) over the next five years. So that’s just the starting point of an economy that maintains an uninterrupted expansion. Now, lets look at some possibilities in the event that a recession occurs in this time frame.
Stress testing the deficit
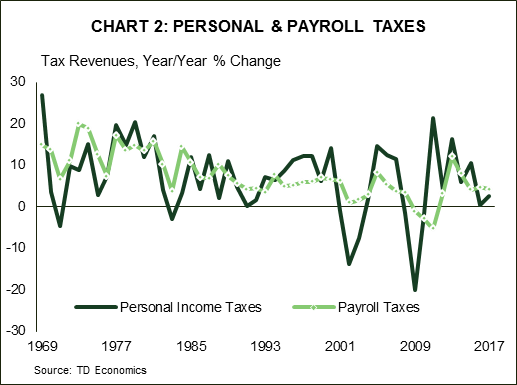
It’s no stretch of the imagination to state that government finances worsen in a recession, as tax revenues collapse and government “automatic stabilizer” expenses kick in, such as unemployment insurance benefits and food stamps (see Chart 2). These typical experiences through history inform us of the backdrop to our recession thought-experiment.
We modelled our recessionary scenario off the Federal Reserve’s adverse scenario from its recent stress test exercise (referred to in short as CCAR). However, we needed to make an alteration with regards to timing, by pushing forward the starting point of the recession by two years (to Q1 2020). We chose to start the recession in 2020 for the simple reason that we needed to pick a starting point and there is no indication at present among the economic indicators that a recession rests within the immediate forecast horizon. The recessionary scenario lasts six quarters and real GDP falls roughly 3¼% from peak-to-trough. The unemployment rate rises steadily from 3.7% at the end of 2019, to peak at 7.3% in the fourth quarter of 2021. As a point of reference, the decline in real GDP is amounts to only three-quarters of the 2008 experience.
To incorporate the fluctuations in government revenues that will be coming on stream due to the Tax Cuts and Jobs Act (TCJA), we then overlay the difference between our baseline revenue forecast and our recessionary scenario relative to the CBO’s current base-case fiscal forecast from April 2018 for the next ten years. We do the same exercise on the spending side.
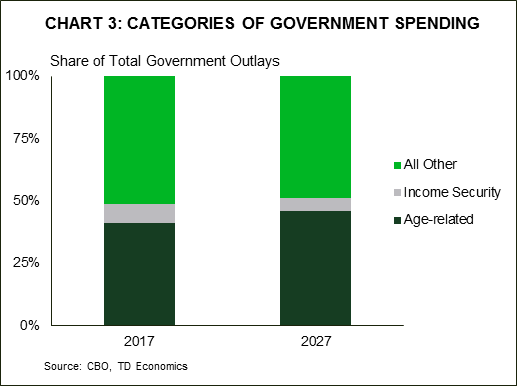
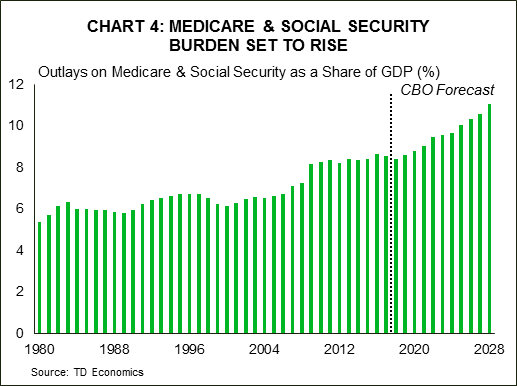
However, estimating changes in spending are more nuanced than revenues. There are a few moving parts to consider. Certain spending items are more cyclical than others, but don’t necessarily bear the largest weight on government coffers. For instance, income security spending on programs like unemployment benefits and SNAP (food stamps) are highly related to the economic cycle, but make up quite a small share of overall government spending (see Chart 3). In contrast, spending on Medicare and Social Security rises inexorably, but this is largely related to the aging population rather than the cyclical downturn (Chart 4). The remainder of spending, which includes defense, Medicaid and all other federal government spending, varies largely due to political decisions, with no discernible relationship to the economic cycle. Therefore, determining what would happen to this portion of government spending relative to the current CBO baseline carries more judgement than the revenue side of the ledger.
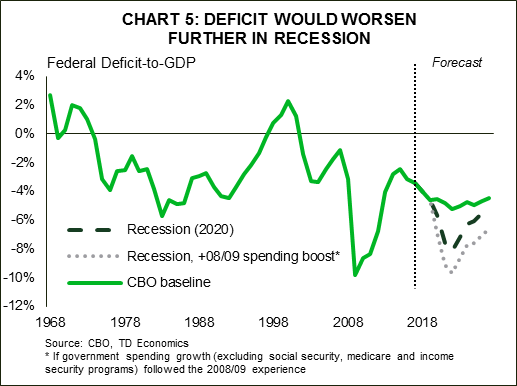
Summing it all up, the deficit-to-GDP trough worsens from the 5.2% in the CBO’s baseline projection, to roughly 8.1% by 2022 (see Chart 5). This would mark the largest deficits outside of the global financial crisis. In other words, although the recession is far less severe than the Great Recession, the size of government deficits would almost equal its stature. This is a purely forecasted result based on the behavior of government finances during past recessionary periods. It does not include a decision by Washington to either ramp up discretionary spending more than the historical experience, or likewise to cut back on spending given ballooning deficits. Either scenario would largely depend on the political situation at the time. If we assume that the government would come under political pressure to stimulate the economy similar to that seen in 2008-09, the deficit would indeed approach the depths reached in 2009 at 10%.
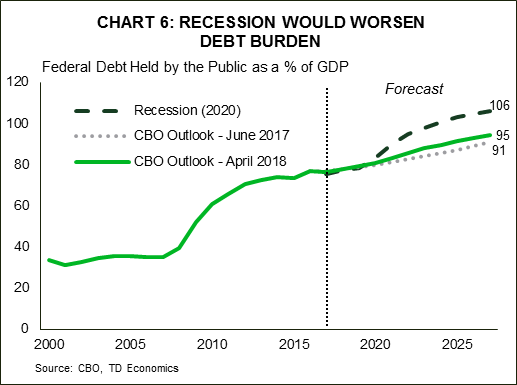
It’s natural to assume that a recovering economy will automatically minimize and eventually eliminate the deficit. However, there are two obstructions that become magnified in the future relative to post-2008. The first is that the population is a lot older, and this makes it more difficult to shrink a deficit in the absence of active policy with the explicit intent of doing so. The government’s tax base will reflect the reality of a labor force slowing to a mere 0.5% within the next five years, the period in which a recovery would be in full swing. The second is a heftier debt burden relative to the current cycle. Even in the event the budget returns to balance, the stock of debt from past deficits remain. The compounding effect of deficits would increase the debt-to-GDP ratio by 11 percentage points above the CBO’s current baseline in 2027 (see Chart 6). In its recent report, the CBO makes a point to highlight the risks from the higher debt burden from fiscal stimulus. Additional debt built-up due to a recession would only heighten these risks.
Fiscal Space: Use it if you’ve got it
An economic forecast can tell you how a recession might impact the deficit. But, it isn’t in an economist’s tool box to predict how political leaders would respond. In an ideal world, governments would ramp up spending in areas like infrastructure, to help counteract the impact of a recession, at the expense of larger deficits in the short-run. But, it is reasonable to think that it will be politically more difficult to do this during the next recession, when deficits are approaching depths not seen since the global financial crisis, while debt levels march to unprecedented levels.
That tendency has in fact been born out in recent work by Romer and Romer (Christina D. Romer, 2012), which showed that economies with less monetary and fiscal policy space have more severe recessions after a financial crisis. While both monetary and fiscal policies are important in how a country fares after a financial crisis, their results indicate that fiscal policy space edges out in importance.
Their research also shows that low fiscal space (which in their sample are countries with debt levels more than one standard deviation above the mean debt-to-GDP level, which was 96%) is associated with worse outcomes following a crisis. These countries had deeper recessions than countries that have fiscal space. This is not so surprising, as countries with high debt loads are often forced into fiscal consolidations after a crisis because investor nervousness makes it harder to borrow. A good real world example of this was Italy. Prior to the financial crisis, Italy’s debt-to-GDP ratio was about 100%, and Italy’s sub-par recovery after the financial crisis can almost entirely be accounted for by its lack of fiscal space. Japan in 1997 had a similar experience.
These findings are specific to a financial crisis, and the next U.S. recession may not take that form. It could certainly be more moderate, and odds favor this outcome given the degree of banking oversight that has come out of the 2008 episode. And, the research does not specifically outline whether it is the perception of policymakers or actual rising borrowing costs that results in less fiscal stimulus being used in countries with a higher debt load.
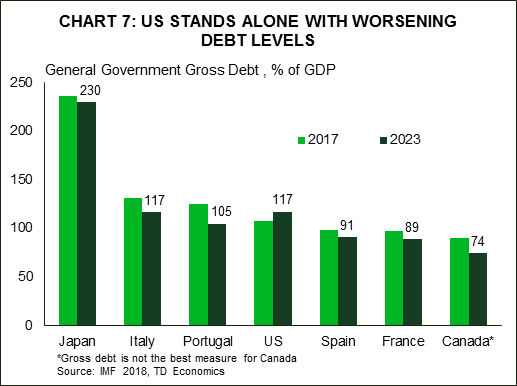
Importantly, the U.S. differs from Italy and Japan in a distinct way. It is the world’s reserve currency, and the U.S. Treasury market has been treated as a global safe haven, that is, so far. Should this hold, the U.S. won’t necessarily face a spike in borrowing costs as a penalty imparted by investors for worsening deficits. This is the concept of exorbitant privilege. However, the U.S. is increasingly looking like Italy, in another respect – its debt burden. The IMF recently released updated fiscal projections across countries showing that the U.S. stands alone among major economies with a worsening debt burden over the next five years (Chart 7). Privilege still comes with responsibility.
Higher debt burdens exact a toll
Even without a market-driven fiscal crisis, there would still be political and economic costs to absorb. First, the political landscape could make it difficult to engage in a great degree of fiscal stimulus. In turn, this could slow the timing of the economic recovery, or mute the magnitude of growth. Second, there would likely be some penalty imparted to Treasury yields from higher debt burdens that ultimately leads to a flood of supply. Our analysis indicates that the worsening path of the deficit shown in Chart 6 would result in the 10-Year Treasury yield being 25 basis points higher than otherwise.
Third, we cannot rule out a debt downgrade, or perhaps a negative watch, depending on how rating agencies viewed the prospects for the economic outlook and fiscal discipline. Ratings agencies last put the U.S. government on a negative ratings watch in 2013, and downgraded U.S. debt in 2011, both episodes occurred after a debt ceiling standoffs. The ratings agencies argued these down to the wire standoffs undermined the confidence of the U.S. dollar as the preeminent global reserve currency, by casting doubt over the full faith and credit of the U.S. These risks could crop up again if Congress is divided when dealing with fiscal decisions in the next recession, and similar standoffs could shake market confidence.
Finally, the recovery phase would likely be muted by the simple fact that the government will not only be dedicating a greater share of their tax revenues to paying their debt, but they would also need to demonstrate fiscal restraint on spending as revenues recover, given the high deficits. This is the situation outlined by Romer and Romer (2017).
The elephant in the room
The results of the stress test of U.S. government finances put a sharper focus on the already worsening fiscal outlook presented by the CBO in April. But the elephant in the room is the fact that debt burdens are set to rise as far as the eye can see thanks to a budget that doesn’t return to balance over the next ten years, despite a growing economy. In effect, this is the “best case scenario” which hardly seems so. This paper has not addressed what might be done to put U.S. finances on a more sustainable path. These ideas were put forward by the Simpson Bowles Report in 2010, but never adopted. That is because the sort of changes required to eliminate the structural deficit, such as cuts to entitlement benefits or other revenue raising measures, will be politically difficult and will exact a drag on the economy.
To give an idea of the size of the changes required, recent work from the Brookings Institute (Alan J. Auerbach, 2018) estimated that to keep the debt-to-GDP ratio constant would require immediate and permanent spending cuts or tax increases totaling 4% of GDP. That is equivalent to a 21% cut in non-interest spending, or a 24% increase in revenues relative to current levels. The recent fiscal stimulus raises the deficit by slightly more than 2% of GDP in 2019. Therefore, the required fiscal course correction would be roughly twice as big, and in the opposite direction as the recent fiscal stimulus. The precise size of the fiscal drag would depend on how quickly the budget is brought back to balance, and the mix of spending cuts and tax increases enacted to get there. Given the recent stimulus boosted our real GDP growth forecast by 0.5 and 0.7 percentage points in 2018 and 2019 respectively, the economic drag could be significant.
That makes it easier to see why the necessary changes are so politically difficult. However, the longer policymakers wait to make changes to the fiscal trajectory, the more painful the adjustments will be. And, it will be difficult to make that adjustment without making changes to age-related entitlement spending, which looking back at Chart 3, is over 40% of the total.
The Bottom Line
By undertaking significant fiscal stimulus at a time of full employment, the federal government has significantly increased downside risks to the economy over the medium term. Our stress test simulation shows that the next recession could trigger deficits approaching those seen during the global financial crisis. This could constrain the degree to which governments use fiscal policy to lessen the recessionary effects on households.
Finally recession-elevated deficits may be temporary, but their impact on the debt burden is long-lasting. A higher debt burden raises longer-term borrowing costs. This would occur at the same time as age-related entitlement spending on Medicare and Social Security is poised to accelerate leaves even less flexibility for the federal government to spend on other priorities. It could also mean the government may feel pressure to return to fiscal restraint given the heavy debt burden, which would dampen the economic recovery.
Turning this rubik’s cube over and over causes all sides to match. America’s dependence on the kindness of foreign investors will rise over time, and America’s economic growth prospects will incorporate tough choices.
Bibiliography
- Alan J. Auerbach, W. G. (2018). The Federal Budget Outlook: Even Crazier After All These Years. Washington, D.C.: Tax Policy Center.
- Christina D. Romer, D. H. (2012). Phillips Lecture - Why Some Times Are Different: Macroeconomic Policy and the Aftermath of Financial Crises. Economica, 1-40.
Battered Euro Looks to Eurozone’s Inflation Data for Reprieve
The common European currency has plunged in recent weeks, as a combination of heightened political uncertainty in Italy, a slowing Eurozone economy, and an increasingly cautious tone by the ECB have taken their toll. In the midst of all this, the battered euro will look for some reprieve in Eurozone’s inflation data for May, due out on Thursday at 0900 GMT.
The past weeks have not been kind to the euro, which has plunged amid signs that a slowdown in Eurozone’s economy would lead the ECB to take a more cautious approach in scaling back its massive stimulus program. The inability to form a government in Italy, and the latest signs the nation may soon head to early elections exacerbated the selloff as investors fled the Italian bond market. Recent reports that Spain may be faced with snap elections too didn’t do the currency any favors either.
These concerns have led investors to materially push back the timing of the first expected ECB rate hike. The first 10bps deposit rate increase is currently fully priced in for Q4 2019; it was anticipated to come during Q2 2019 just a few months ago. So, while markets still appear relatively convinced the Bank will begin unwinding its asset purchase program (QE) later this year, they also think economic and political woes will keep it from raising rates for a while.
As such, Eurozone’s preliminary inflation data for May will be watched closely to either confirm or disprove this narrative. In May, the bloc’s headline CPI rate is forecast to have rebounded to 1.6% in yearly terms, after it pulled back to 1.2% in April. Meanwhile, the core rate (excluding food, energy, alcohol, and tobacco) is projected to have risen to 1.0%, after it dipped to 0.7% previously. Note that Germany’s flash CPI data will be released a day earlier, on Wednesday at 1200 GMT.
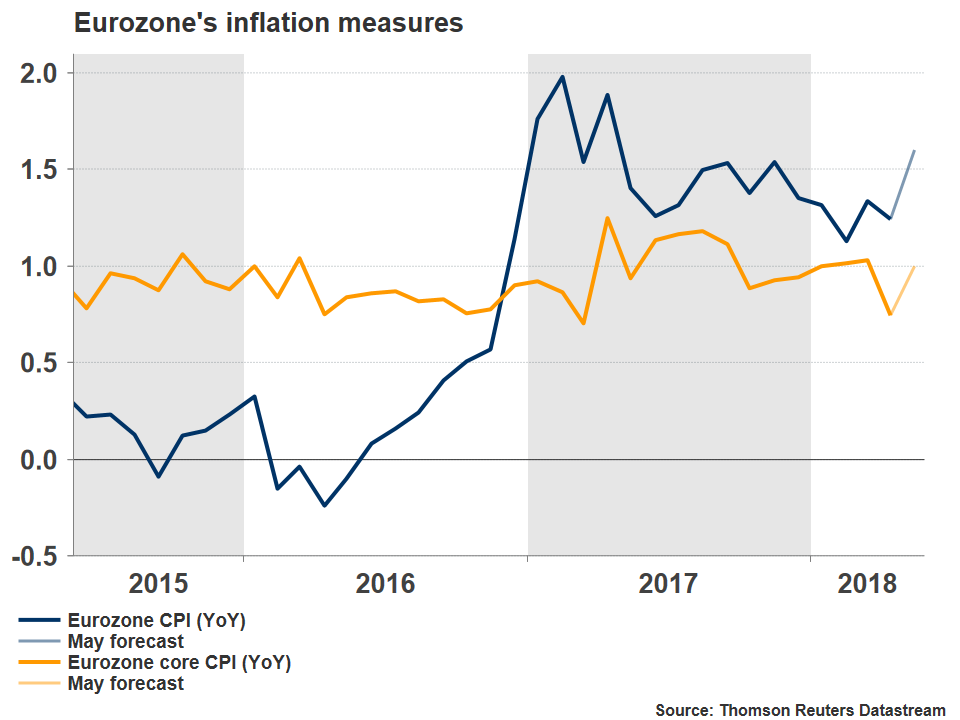
While economists’ forecasts are optimistic, other gauges of price pressures such as Markit’s preliminary Composite PMI for May were not quite as upbeat. The survey showed that “average selling prices for goods and services rose at the slowest rate since last September”, which in isolation, suggests the risks surrounding the CPI forecasts may be tilted somewhat to the downside. That said, any disappointment may be more visible in the core rate, as the headline is likely to be pushed up by favorable energy effects; oil prices have risen 50% from May 2017. Another factor that could help inflation accelerate in the future is the euro’s plunge, which increases the price of imported goods. Even though these may boost headline inflation, they are still unlikely to cause the ECB to shift to a more hawkish stance, unless core inflation rises as well. Policymakers will probably view energy and currency effects as transitory factors that will fade over time and hence, not a reason to alter their policy stance – similar to what happened in early-2017. This is precisely why the core CPI rate is often considered more important for monetary policy decisions; it strips out energy-related effects.
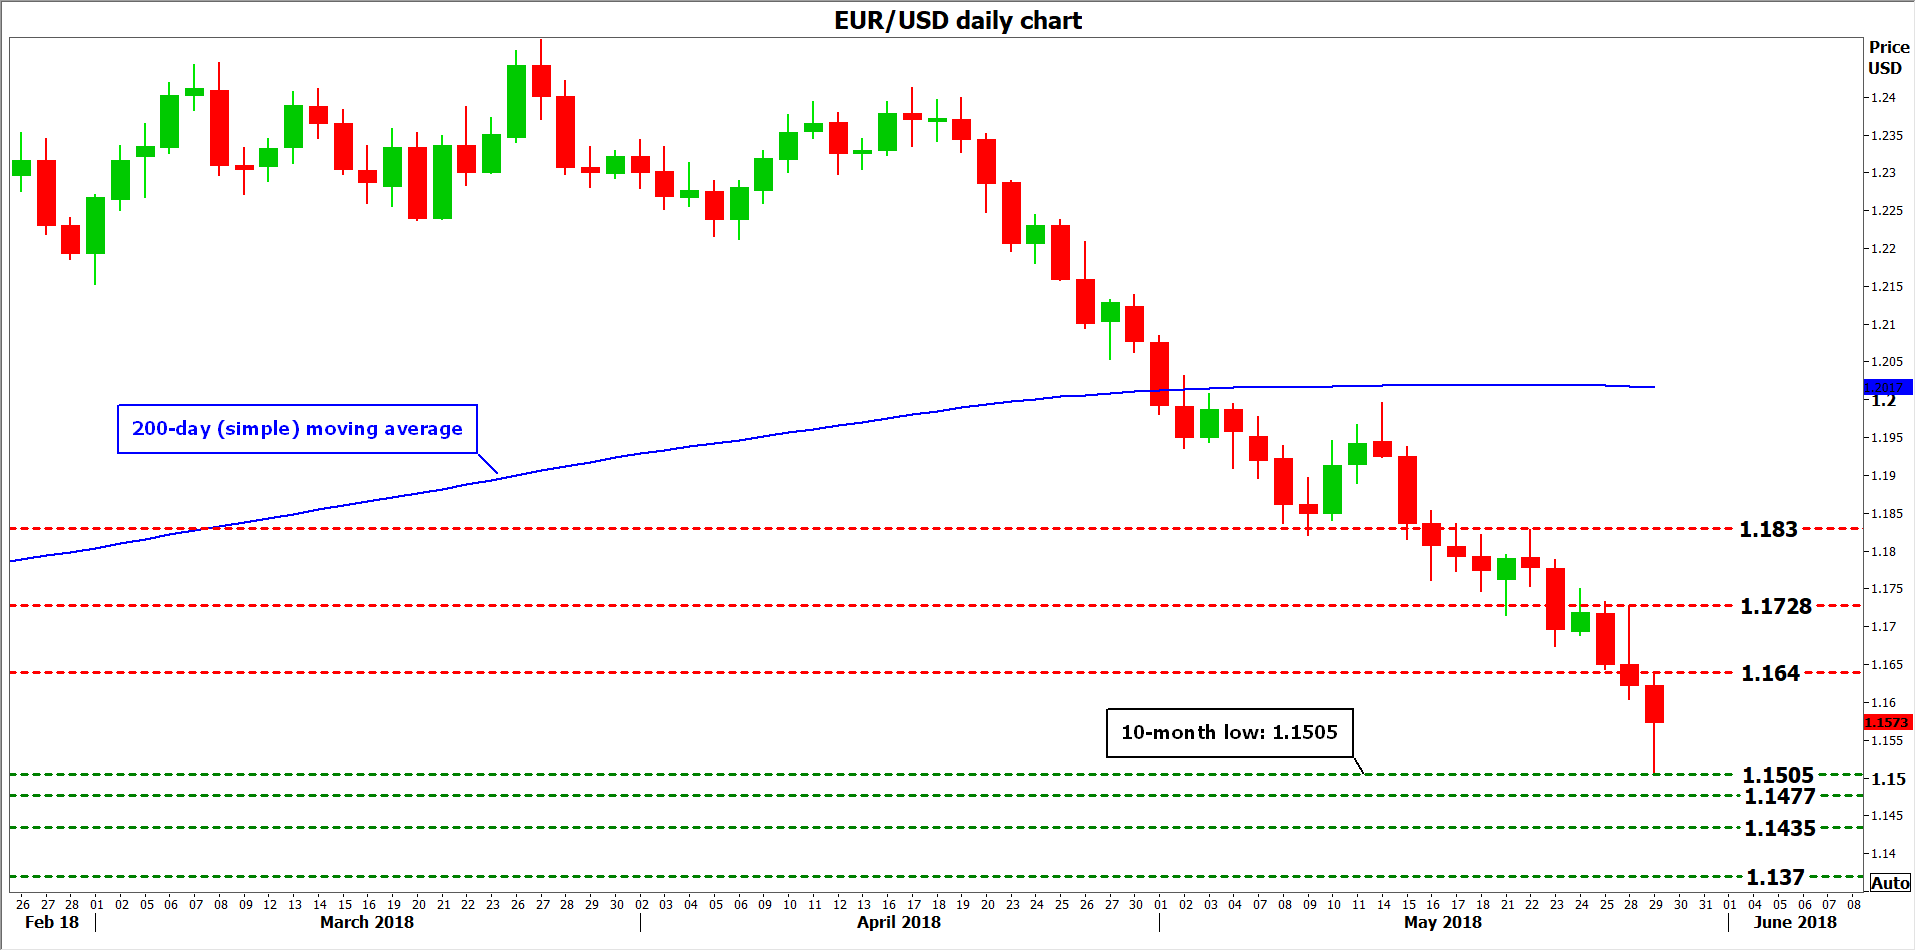
Should the CPIs surprise negatively – particularly the core rate – that could amplify speculation the ECB may delay its normalization plans and hence, push the euro even lower. Looking at euro/dollar, immediate support to declines may be found at 1.1505, the May 29 low. A downside break would mark a lower low on the daily chart, opening the way for 1.1477, the July 20 bottom. Even lower, the pair could challenge 1.1435 initially and 1.1370 thereafter, these being the troughs of July 17 and July 13 respectively.
On the contrary, a positive surprise in these data could prove cause for a rebound in the euro. Resistance to advances in euro/dollar could come around the May 25 low of 1.1640, with potential upside break shifting attention to the May 28 peak of 1.1728. If the bulls overcome that zone too, then sell orders may be found near 1.1830, the top from May 22.
Trade Risks and Debt to Hold BoC Rates Steady
On Wednesday at 1400 GMT, the Bank of Canada will announce its interest rate decision and issue its press release, explaining the factors behind the decision. For the fifth time, though, policymakers are expected to keep borrowing costs unchanged at 1.25% as NAFTA and the US trade agenda remain a source of uncertainty for the Canadian economy, while the overloaded debt overhang continues to weigh despite a strong labor market. No conference or financial projections are scheduled to follow.
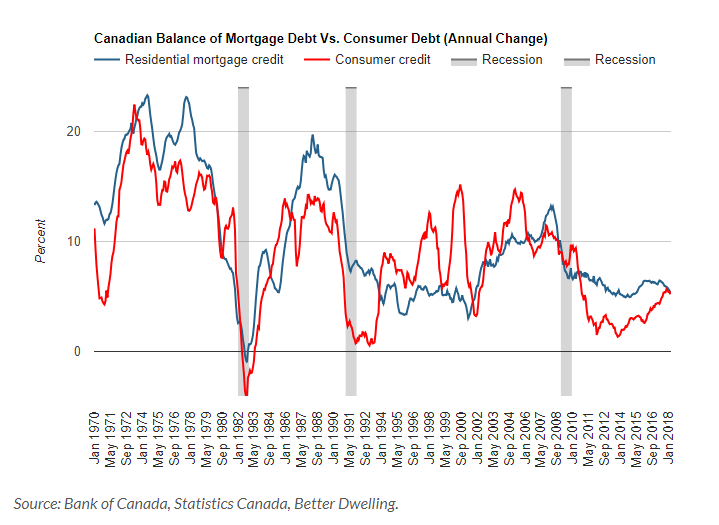
Two weeks ago, CPI readings out of Canada showed that headline inflation in April grew by 2.2%, less than the 2.4% forecast by analysts, though, still above the 2.0% midpoint of the BoC target range of 1-3.0%. Core measures, closely watched by the BoC, remained around 2.0% as well. Yet, wage growth at the same time was rising faster than inflation by 3.6% y/y, recording the highest expansion in six years, while the unemployment rate remained at the lowest in a decade at 5.8% – factors that otherwise could comfortably lead to higher interest rates. Nevertheless, the central bank might choose to lift rates later rather than now when it meets on May 30 as a quicker pace of rate hikes could put high indebted Canadian households and therefore consumption under pressure. However, a slower pace could increase demand for debt, making the country more vulnerable in case negative shocks emerge. Recall that Canadian household debt to disposable income stood near record highs in the fourth quarter of 2017, although the Bank of Canada has raised interest rates three times since July. Regarding mortgage debt, which holds a significant share of the total debt, it touched a new record in April, but the annual growth slowed to the lowest since 2001. In terms of consumption, retail sales – a proxy for household spending – posted the strongest expansion in five months in March. Having said that, the central bank will likely wait for better results as the gains were largely driven by auto sales. Excluding this volatile component, retailers saw their sales declining.
On the trade front, the latest data showed a wider trade deficit, with imports surpassing the rise in exports and jumping to record highs under a steady currency. Precarious NAFTA negotiations could have also kept exporters cautious as the latest round of talks failed once again to secure an agreement and more importantly meet a deadline of May 17 imposed by House speaker, Paul Ryan, in order for the US Congress to review it. Tensions are now intensifying ahead of a new deadline set by the end of May, while the member countries, Canada, the US and Mexico, are rushing to find a common ground before the Mexican elections on July 1 and the US mid-term elections in November take place, potentially prolonging the process under new legal bodies. Moreover, the clock is ticking down for US import tariffs on steel and aluminum which were temporarily exempted for Canada, and Mexico until June 1, while Trump’s recent order to investigate the auto industry – a key outstanding issue in NAFTA talks – added further stress to the markets on fears of new import tariffs. On the other hand, the rally in oil prices last week, brought smiles to Canadian oil exporters, offsetting losses related to trade risks in the commodity-linked loonie. But whether the rally in oil prices is overdone is another question to be considered.
According to overnight indexed swaps, chances for a rate rise on Wednesday are currently standing at 25.53% compared to nearly 31% last week, with analysts widely expecting the central bank to deliver two more rate hikes this year in July and December. Standing pat on rates, though, sounds reasonable for now as policymakers will likely prefer to wait for GDP growth readings due on Thursday to indicate how the economy evolved in the first quarter of the year.
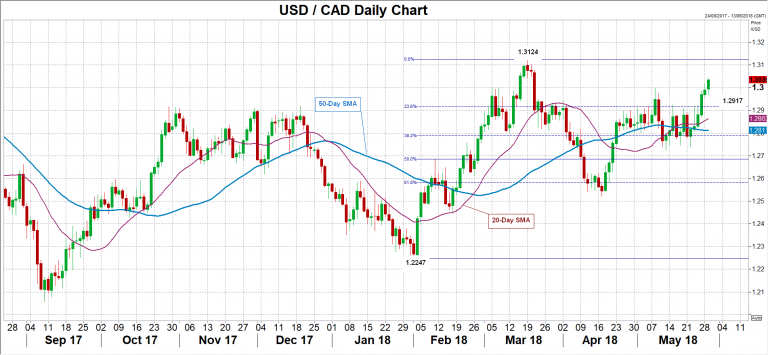
Still, in the forex markets, the loonie could attract gains if the decision statement embraces a positive economic outlook, pushing dollar/loonie down to the 23.6% Fibonacci of 1.2917 of the upleg from 1.2247 to 1.3124. Steeper declines could also target the area between the 20- and the 50-day simple moving averages currently at 1.2862 and 1.2810 respectively. On the other hand, if policymakers emphasize risks related to the US trade strategy, helping the dollar to extend gains, dollar/loonie could crawl towards the March peak of 1.3124, the highest level reached since the end of June.
AUDUSD – Bearish Bias Below Falling 30SMA
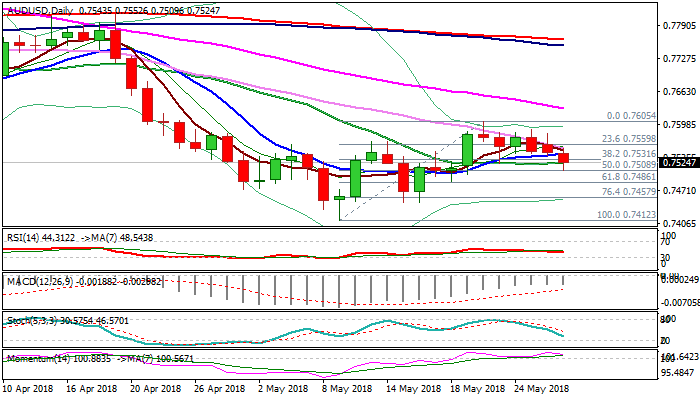
The Aussie dollar remains in red on Tuesday despite bounce from session low (0.7509) also one week low, as the upside was capped by falling 30SMA which limited the action in past few days and maintains pressure.
Daily MA’s returned to bearish configuration and helped by bearish divergence on 21-d momentum, maintaining bearish near-term bias.
Bears need close below cracked Fibo support at 0.7531 (38.2% of 0.7412/0.7605 upleg) to generate fresh bearish signal for extension through psychological 0.7500 support and test of next pivot at 0.7486 (Fibo 61.8% of 0.7412/0.7605).
Stronger upticks should stay below broken 10SMA (0.7543) which turned sideways, while break and close above converged falling 5/30SMA’s (0.7550) would generate bullish signal and sideline existing downside risk.
Res: 0.7543; 0.7550; 0.7590; 0.7605
Sup: 0.7524; 0.7509; 0.7486; 0.7457