

Sample Category Title
GBPJPY Direct Drop After The Bearish SHS
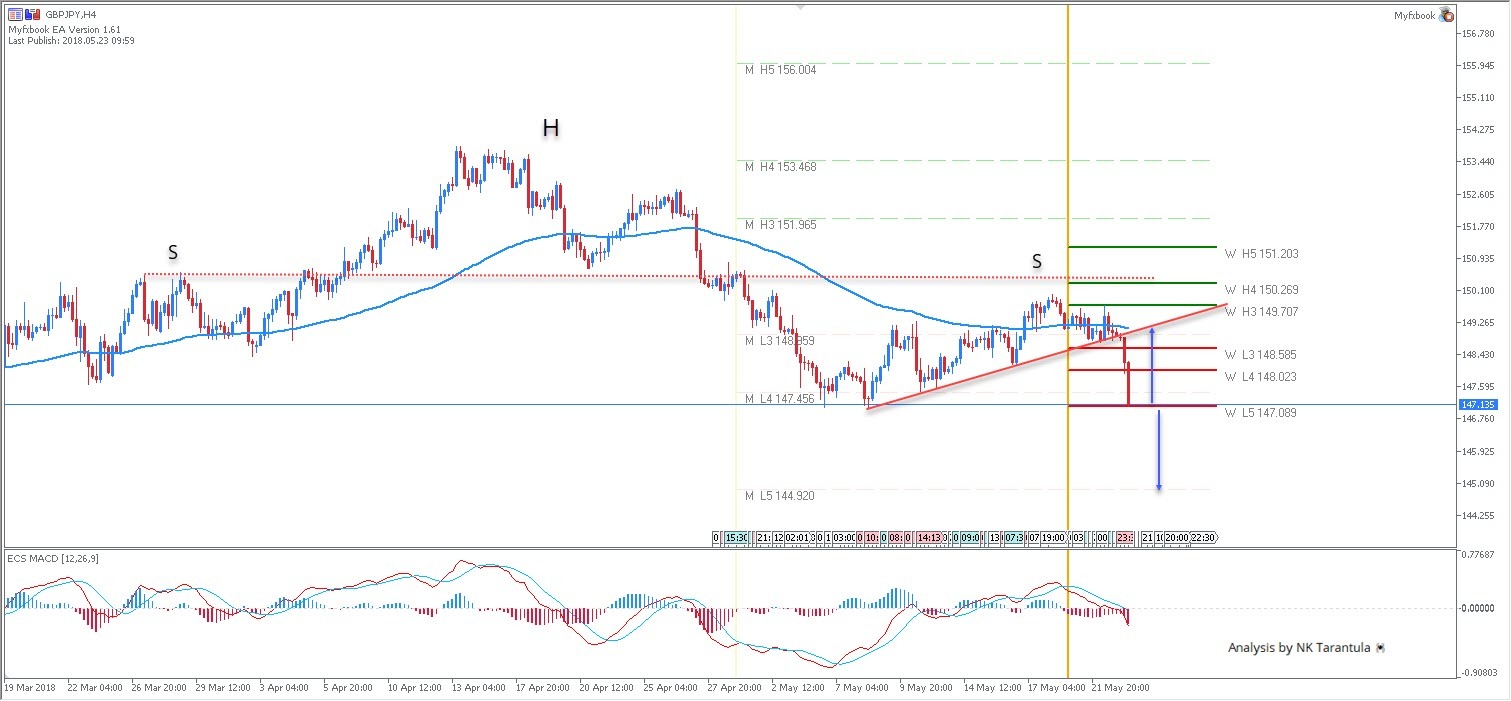
The GBP/JPY has dropped after the bearish SHS variant has been formed in 4h time frame. We can see how the trend line break caused a direct drop to W L5 camarilla pivot. This is the important zone 147.00-15. We might see a spike towards a retest of trend line break or a further drop towards M L5. Watch for either bearish continuation or a bounce.
W L3 - Weekly Camarilla Pivot (Weekly Interim Support)
W H3 - Weekly Camarilla Pivot (Weekly Interim Resistance)
W H4 - Weekly Camarilla Pivot (Strong Weekly Resistance)
D H4 - Daily Camarilla Pivot (Very StrongDaily Resistance)
DL3 – Daily Camarilla Pivot (Daily Support)
DL4 – Daily H4 Camarilla (Very Strong Daily Support)
POC - Point Of Confluence (The zone where we expect price to react aka entry zone)
Pound hammered by UK CPI miss, ONS blamed timing of Easter
Pound was knocked down after another data miss. Headline CPI slowed for the third month in a row to 2.4% yoy in April, down from 2.5% yoy and missed expectation of 2.5% yoy. Core CPI also slowed to 2.1% yoy, down from 2.3% yoy and missed expectation of 2.2.% yoy.
The Office of National Statistics noted that air fares made the largest downward contribution to the change in CPI. It noted that "the timing of Easter in the middle of April 2017 contributed to air fares rising by 18.6% on the month whereas this year, Easter fell at the beginning of April before the price collection period and there was no price rise. Instead, fares fell slightly, by 0.2%, between March and April.
Poor weather was blamed for weak Q1 GDP. Timing of Easter is now blamed for CPI slowdown. But whether they're true or now, the chance of an August BoE hike looks slimmer after the release.
Also from UK, RPI accelerated to 3.4% yoy in April, up from 3.3% yoy, met expectation. PPI input rose to 5.3% Yoy, PPI output was unchanged at 2.7% yoy, PPI output core slowed to 2.4% Yoy. House price index was unchanged at 4.2% yoy in March.
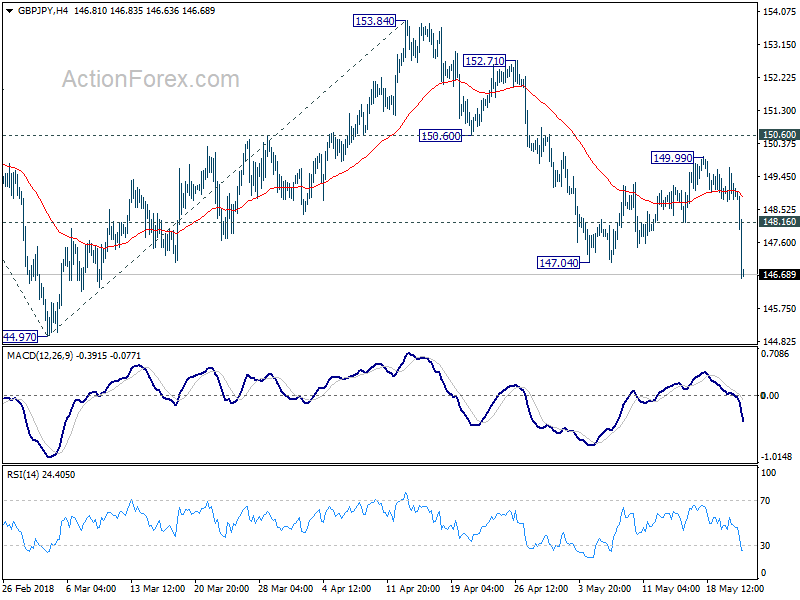
GBP/JPY responds to the release by diving through 147.04 support, confirming resumption of recent decline from 153.84. 144.97 is the next target.
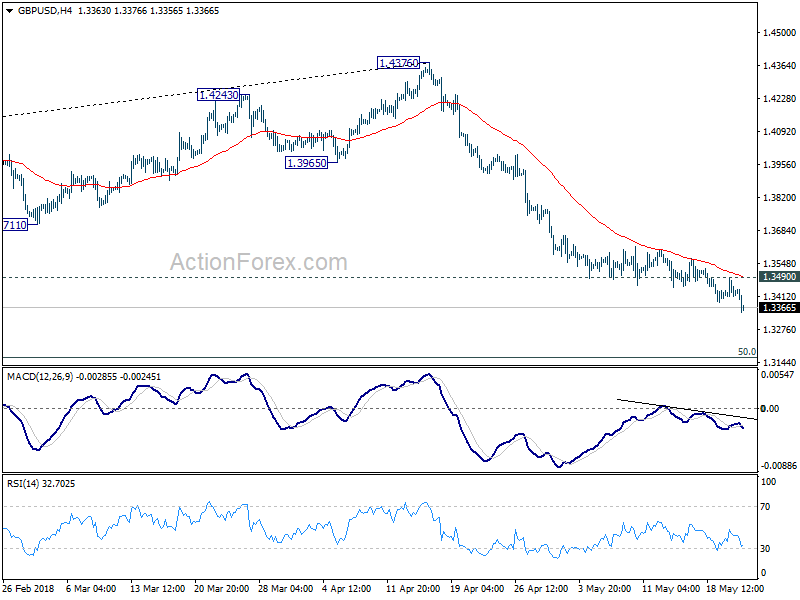
GBP/USD drops to further to 1.3345 and is on course for 1.3161 fibonacci level.
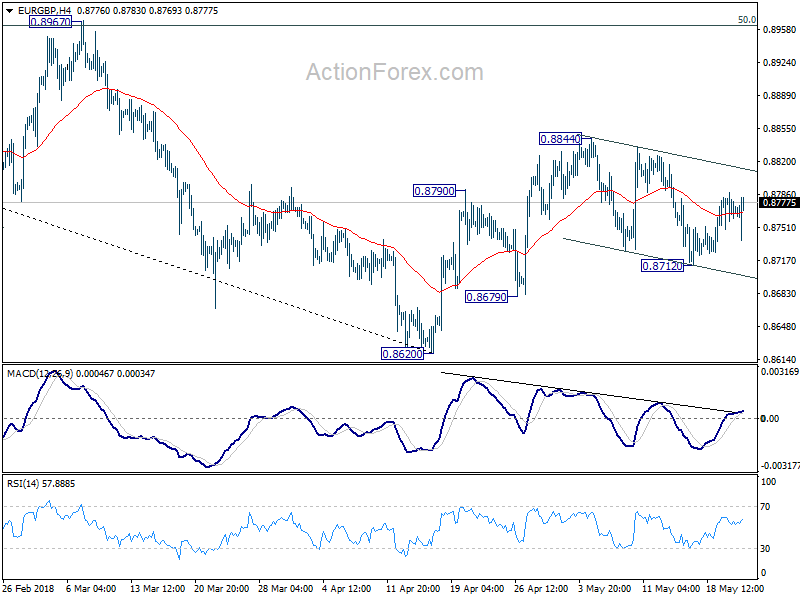
EUR/GBP is stay in range, because Euro is weighed down by its own weaker than expected PMI data.
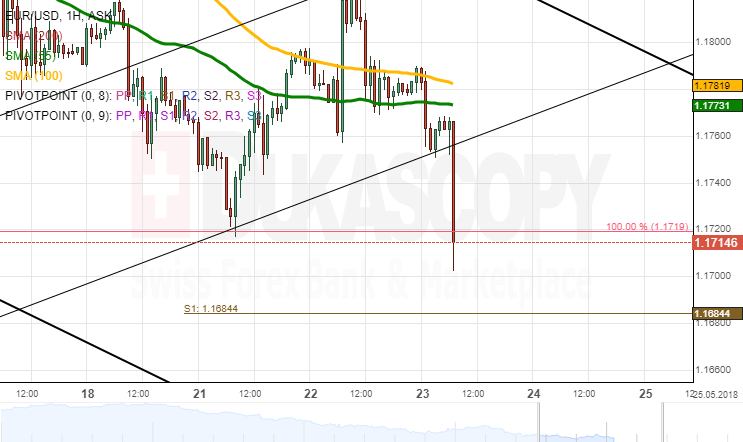
EURUSD Analysis: Returns Below SMAs
Even though the Euro managed to surpass the 100-hour SMA on Tuesday morning, further advance did not follow, thus leading the rate back in the narrow range between the 100– and 55-hour moving averages. A breakout of the former occurred early in the Asian session.
It is apparent that the pair's movement during the previous two days has been tended towards the more senior channel and the 200-hour SMA at 1.1825. This mark is the most probable upside target for today if the 1.1785 area is breached within the nearest hours.
However, technical indicators flash bearish signals in line with which the Euro should approach the six-month low of 1.1719 and edge even lower down to the weekly S1 at 1.1685. FOMC Meeting Minutes are published later in the day at 1800GMT.
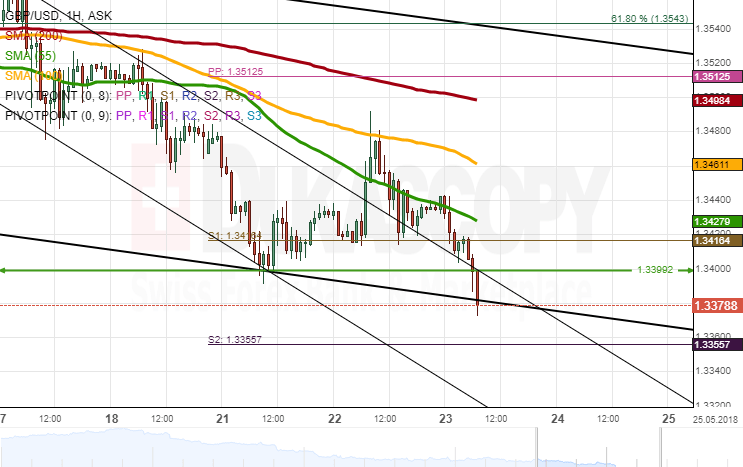
GBPUSD Analysis: Returns To 1.34
The movement of GBP/USD was dominated primarily by the 55– and 100-hour SMAs during the previous session. The Sterling managed to appreciate mid-session but was nevertheless pressured lower by above moving averages.
By Wednesday morning, the pair was located near the 2018 low of 1.34. It is likely that the 55-hour SMA continues to provide bearish pressure for the pair during the following hours, as well. However, the weekly S2 at 1.3350 should remain intact.
In the event of solid British CPI data, the Pound is likely to surge past the 1.3460 area to test the 200-hour SMA and the weekly PP at 1.3510. Additional volatility should be added by the FOMC Meeting Minutes published at 1800GMT.
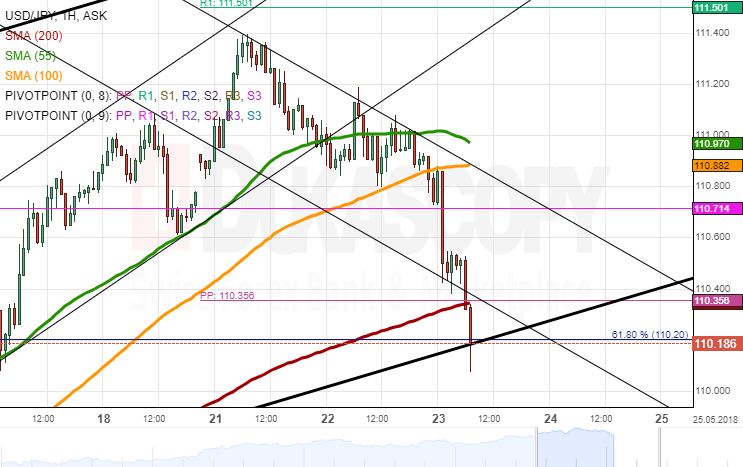
USDJPY Analysis: Points To Bullish Reversal
The US Dollar remained steady against the Yen on Tuesday, as it was pressured from both sides by the 100– and 55-hour SMAs. Downside risks prevailed during the Asian session today due to reduced optimism about US-China trade talks. As a result, the pair plunged 36 pips and stopped slightly above the 200-hour SMA near 110.40.
This area is restricted by other important resistance levels, such as the 55-day and 200-period (4H) SMAs, which might hinder bears from making further advances south. Technical indicators are also located in the oversold area.
The upside target should be the combined resistance of the 55– and 100-hour SMAs at 111.00 in case FOMC Meeting Minutes at 1800GMT do not provide additional upside momentum; the ultimate low—110.00 if the 200-hour SMA is breached.
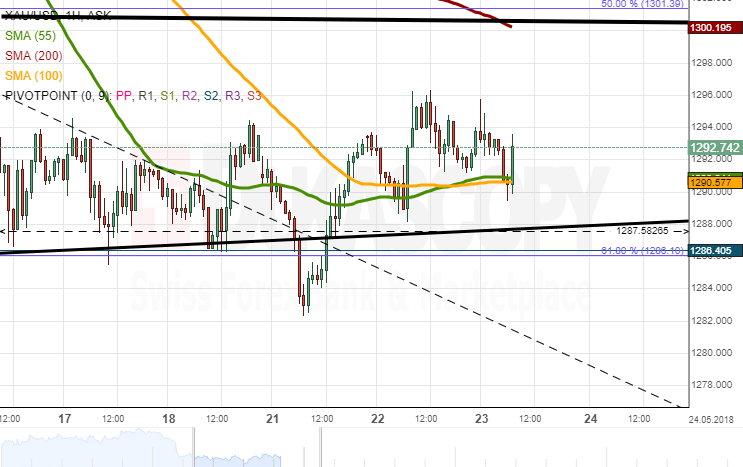
Gold Analysis: Remains In Narrow Range
Tuesday's trading session introduced no changes to Gold's movement against the US Dollar. The main reason was the strong support/resistance barriers formed by the monthly S1 from above and the 55– and 100-hour SMAs from below. This narrow trading range should soon surrender.
Given that the pair was starting to breach the moving averages at the time of this analysis, it seems that the overall direction should be south today. Technical indicators are likewise bearish. The nearest support level is the senior channel and the 61.80% Fibonacci retracement at 1,285.00, while this fall could still continue until 1,280.00.
Conversely, a strong resistance level is set by the 200-hour SMA at 1,300.00. Even if bulls prevail, this level should not be surpassed today.
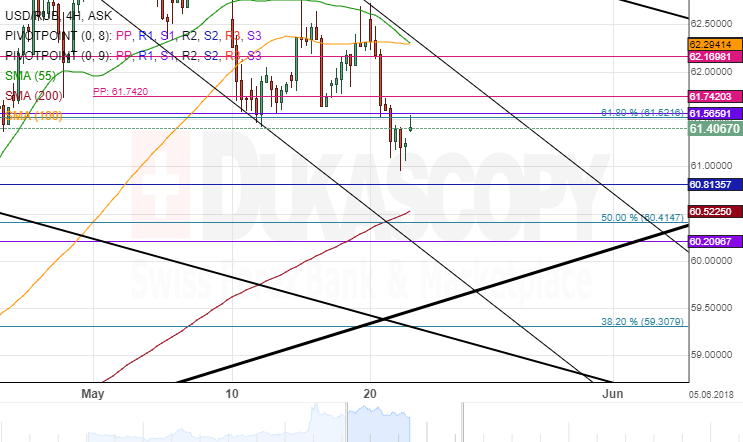
USD/RUB 4H Chart: Going Downwards Until June
The USD/RUB pair has been more following simple channel trend lines than pivot points SMAs or Fibonacci retracement levels. Moreover, recently the 61.00 mark has been acting as a lone psychological level of significance.
In May the US Dollar began to lose value against the Russian Ruble. The decline has been occurring in a medium term descending channel pattern. This pattern is set to guide the rate down to the 60.00 level until June. However, on its way the rate will face various support levels, which can be observed on the chart.
Meanwhile, on Wednesday the pair was attempting to break past the major resistance levels near 61.50 level. If the rate fails to pass them, it is set to approach the 60.80 mark, where the closest support was located at.
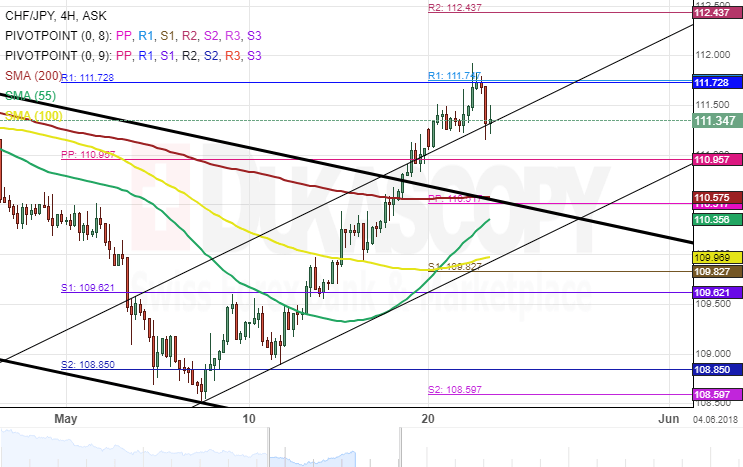
CHF/JPY 4H Chart: Gains More Than Expected
The last review of the Swiss Franc against the Japanese Yen pair concentrated on the fact that the pair had reached a dominant resistance line just above the 110.50 mark. Since than that level has been broken. Moreover, the pair has extended its gains up to the 111.70 mark.
During the move the two previously drawn patterns were broken. However, if one looks at the previous resistance line of the medium term ascending pattern, it can be noticed that the previous resistance has become a support on Wednesday.
In regards to the near future, the pair is either going to fall down to the 111.00 mark where the monthly PP is located at, or the rate will make another attempt to pass the 111.70 resistance cluster.
Turkish Lira Crisis Continues To Deepen With Currency In Freefall
Matters just continue to go from bad to worse for the Turkish Lira.
The currency is in complete freefall and the outlook is still that there is an increased risk of further losses ahead. This is despite the Lira being crippled by meeting new historic lows on a near-daily basis as of late, a consequence of investors having an extreme lack of confidence in Turkish assets.
There is no disputing that the comments Turkish President Recep Tayyip Erdogan made last week regarding him having more influence in economic matters and monetary policy has been the catalyst behind the depression the Lira currently finds itself in. The issue is that it has scared investors away to such an extent, that it is difficult to imagine what buyers there are out there for the Turkish Lira. Erdogan effectively eliminated buyers from the market, and despite the currency on headline looking extremely oversold, the threat of central bank independence being under scrutiny is so high that it is preventing traders from wanting to even take a risk on buying the Lira at its current depressed levels.
The latest headline from yesterday is that Japanese investors turned their backs on Turkish assets, which is seen as the reason for the Lira plunging in excess of another 3% on Tuesday. The exodus is likely to continue, and it does appear to be only a matter of time before the Turkish Lira jumps towards 5 against the Dollar. With the acceleration in selling momentum for the Turkish Lira over the past week, it can’t be ruled out that the Lira could weaken to 5 against the Dollar before the end of the month.
We are still a month away from the upcoming June 24th elections in Turkey, but I do think that traders will be encouraged to price in as much negative news into Turkey as they can before the event. If Erdogan wins, as he is likely to do so, and does indicate that he will imminently instruct interest rates in Turkey to move lower as it is also suggested, there is a threat that there won’t be a ceiling to Turkish Lira weakness.
Although the events in markets like Turkey and Argentina might be looked at as idiosyncratic matters, we should also not underestimate the impact these could have on the general emerging market sentiment. I do not think it is a coincidence that the moves seen in the Turkish Lira on Tuesday have been mirrored by the majority of emerging market currencies, that are trading lower against the USD in the early hours of Wednesday trading.
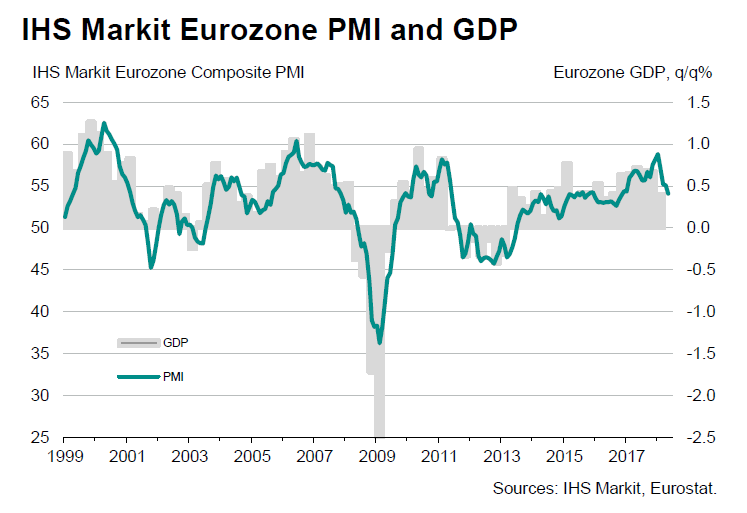
Eurozone PMI hit 18-month low, but still point to 0.4% GDP growth in Q2
Eurozone PMI manufacturing dropped to 55.5 in May, down from 56.2, missed expectation of 56.0, hitting 15-month low.
PMI services dropped to 53.9, down from 54.7, missed expectation of 54.7, hitting, 16-month low.
PMI composite dropped to 54.1, down from 55.1, hitting 18-month low.
Comments from Chris Williamson, Chief Business Economist at IHS Markit:
"The May PMI brought yet another set of disappointing survey results, though once again a note of caution is required when interpreting the findings. While prior months have seen various factors such as extreme weather, strikes, illness and the timing of Easter dampen growth, May saw reports of business being adversely affected by an unusually high number of public holidays.
"Furthermore, despite the headline PMI dropping to an 18-month low, the survey remains at a level consistent with the eurozone economy growing at a reasonably solid rate of just over 0.4% in the second quarter.
"Job creation is also continuing to run at an encouragingly robust rate and optimism about the business outlook remains above its long-run average.
"However, it's also becoming increasingly evident that underlying growth momentum has slowed compared to late last year, especially in relation to exports. Hiring has consequently shown signs of being reined-in. More expensive oil and rising wages are meanwhile continuing to push companies' costs higher, but weak final demand means firms are struggling to pass these higher costs onto customers.
"Some of the fog will hopefully lift with the June PMI data, providing a clearer signal of the underlying growth momentum. Until then, however, it's likely that the disappointing May survey results will rekindle some concerns regarding downside risks facing the euro area economy."