Sample Category Title
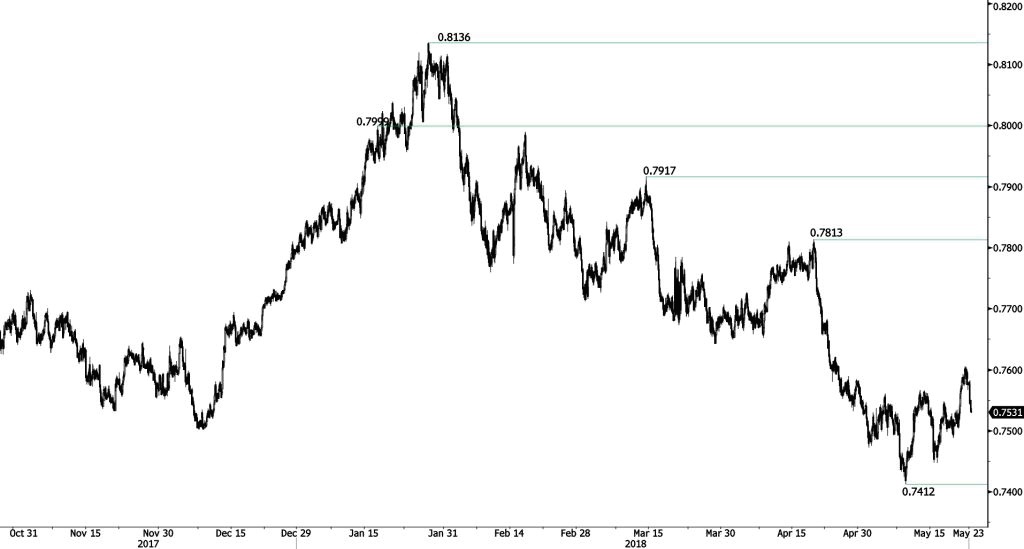
AUD/USD Sharp Bearish Reversal
AUD/USD reversed temporary bullish momentum indicating further downside risk. Hourly support and resistance remain at 0.7412 (09/05/2018 low) and 0.7813 (19/04/2018 high). The technical structure suggests short-term increase.
In the long-term, the upward trend slows down after failing to reach key resistance at 0.8164 (14/05/2015 low). Key support stands at 0.6009 (31/10/2008 low). A break of the key resistance at 0.8164 (14/05/2015 high) is needed to invalidate our long-term bearish view.
USD/CAD Choppy Trading
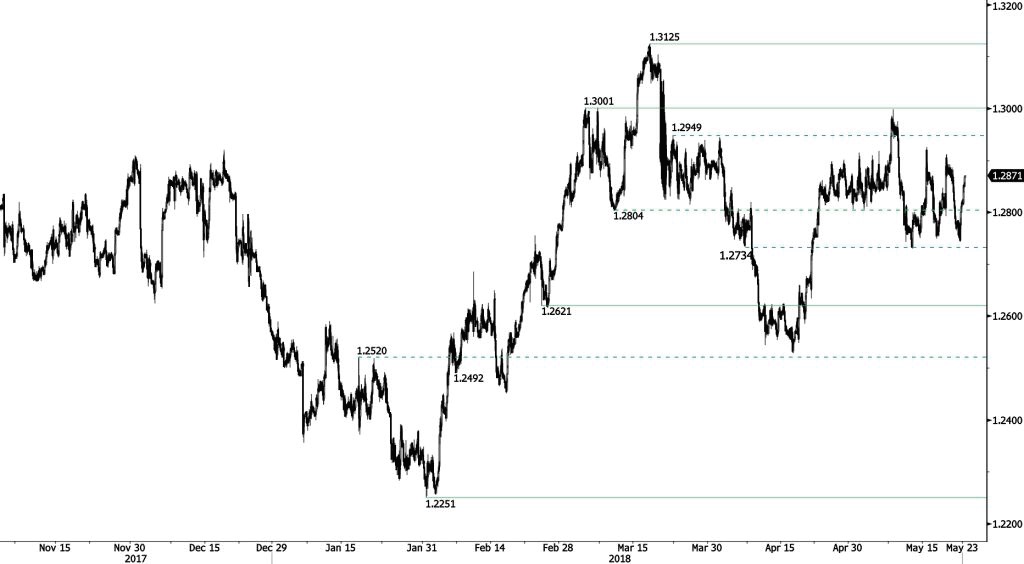
USD/CAD is still swinging. Hourly support and resistance are given at 1.2621 (23/02/2018 low) and 1.3001 (05/03/2018 high). The technical structure suggests short-term upward moves.
In the longer term, the pair is trading between resistance point at 1.3805 (05/05/2017 high) and support at 1.2128 (18/06/2015 low). Strong resistance is given at 1.4690 (22/01/2016 high). The pair is likely to head lower. The pair is trading above its 200 DMA.
USD/CHF Reversal
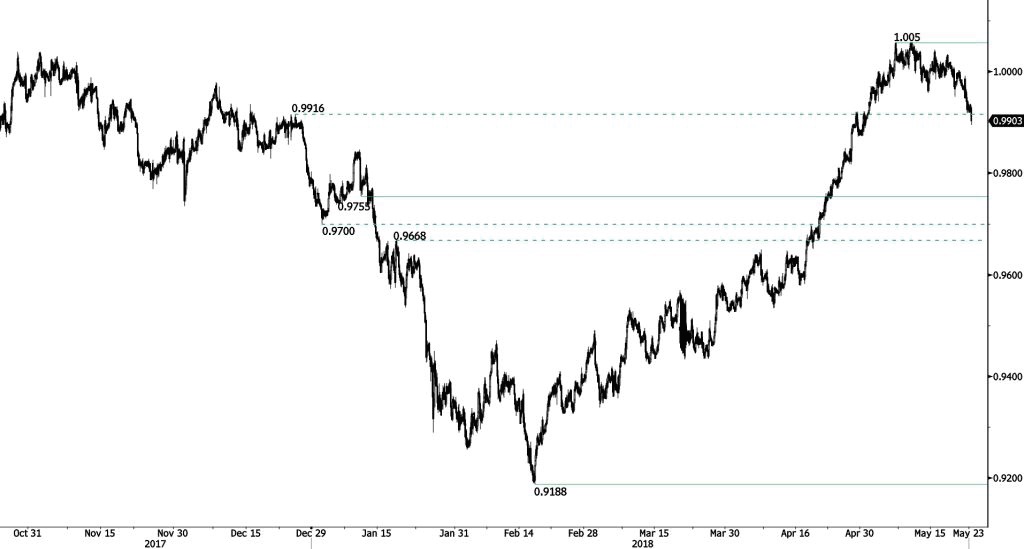
USD/CHF's fall below support suggest further downside. Key support and resistance given at 0.9755 (10/01/2018 low) and 1.0091 (09/05/2017 high) are maintained. The technical structure suggests short-term sideways trading moves.
In the long-term, the pair is still trading in range since 2011 despite some turmoil when the SNB unpegged the CHF. Key support lies at 0.9072 (07/05/2015 low) while resistance at 1.0344 (15/12/2016 high) is distanced. The technical structure favours a long term bullish bias since the unpeg in January 2015
USD/JPY Challenging Uptrend
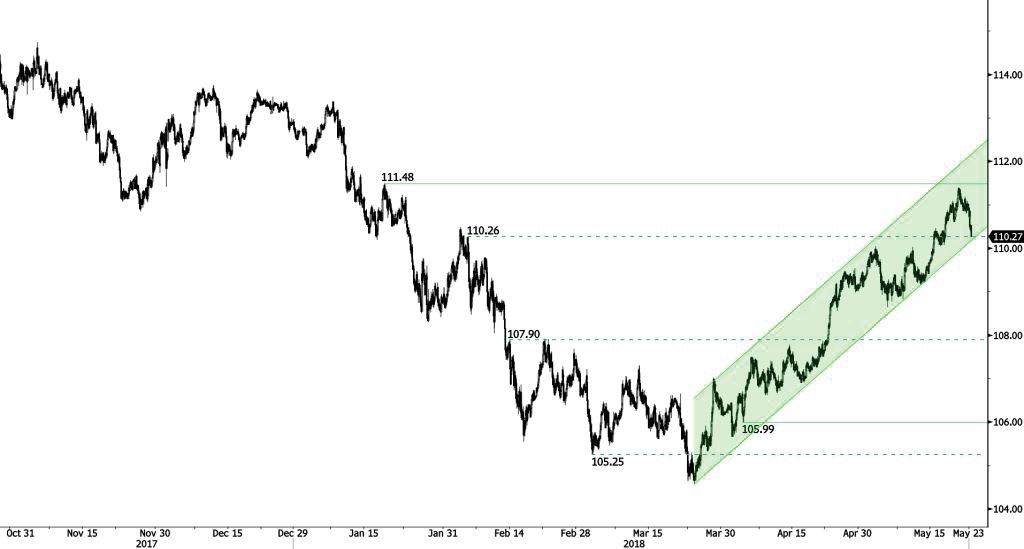
USD/JPY reversal continues. Test of uptrend support at 110.15 is critical for further extension of bullish bias. Hourly support and resistance are located at 108.74 (25/01/2018 low) and 111.48 (18/01/2018 high). The technical structure suggests short-term sideways trading moves.
We favor a long-term bearish bias. Support remains at 101.20 (09/11/2016 low). A gradual rise toward the major resistance at 125.86 (05/06/2015 high) seems unlikely. Expected to decline further support at 101.20 (09/11/2016 low). The pair trades slightly above its 200 DMA.
GBP/USD Moves Lower
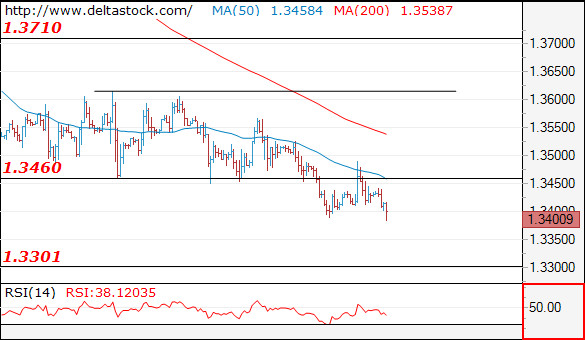
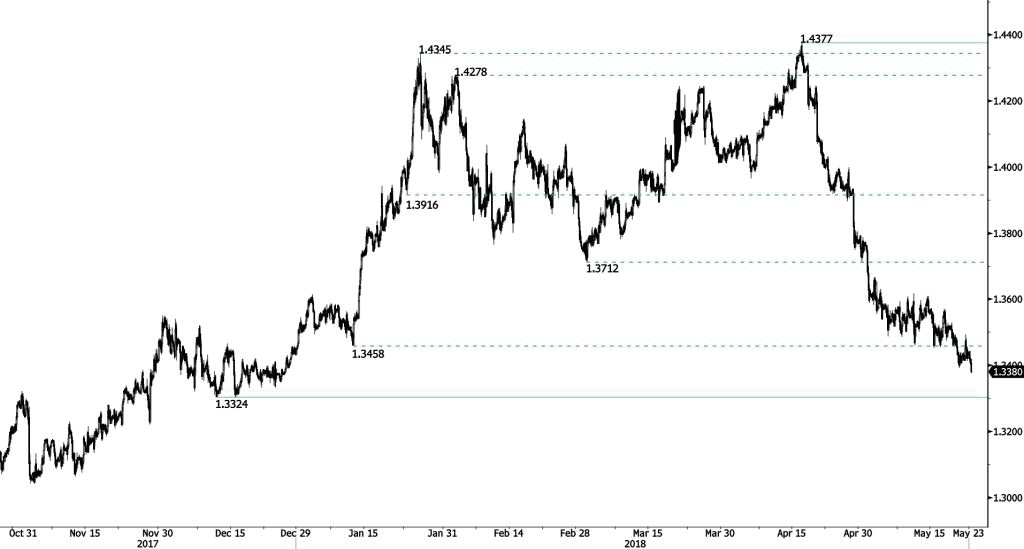
GBP/USD continues to weaken targeting key support. Key support and resistance are given at 1.3331 (19/12/2017 low) and 1.4097 (29/01/2018 high). The technical structure suggests further downside.
The long-term technical pattern is reversing. The Brexit vote had paved the way for further decline but the pair is moving to 2016 highs. Long-term support and resistance are given at 1.1841 (07/10/2017 low) and 1.5018 (24/06/2016 high).
EUR/USD Weak Bounce
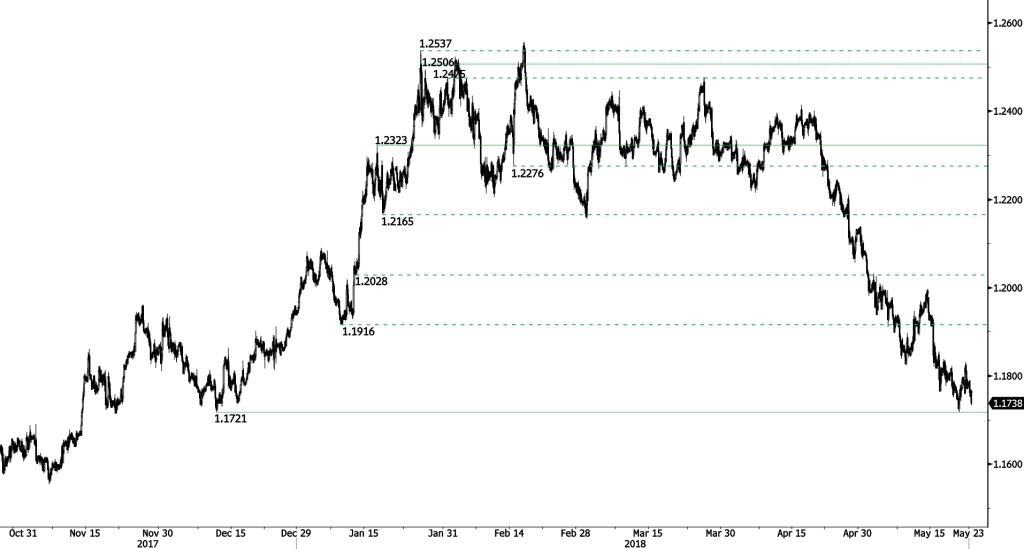
EUR/USD is bouncing off from 1.1720 low but losing momentum below 1.1812 (25/12/2018). The pair is currently at mid-December 2017 levels. Hourly support and resistance are now given at 1.1720 (21/05/2017 low) and 1.2323 (17/01/2018 high). The technical structure suggests short-term increase.
In the longer term, the momentum is turning largely negative. We favor a continued bearish bias. Key resistance is holding at 1.2886 (15/10/2014 high) while strong support lies at 1.1554 (08/11/2017 low).
Yen crosses in downside acceleration as US, German and UK treasury yields tumble
Yen crosses continue to trade lower in European session and accelerate after weaker than expected Eurozone and UK data.
EUR/JPY broke 109.22 support and then 128.94 support without hesitation. GBP/JPY also broke 147.04 support. Both confirm near term down trend resumption.
USD/JPY also takes our near term channel which should now bring deeper corrective fall to 108.82 support.
Falling treasury yield is seen as the main factor driving the moves.
US 10 year yield reaches as low as 3.011, comparing to yesterday's close at 3.063.
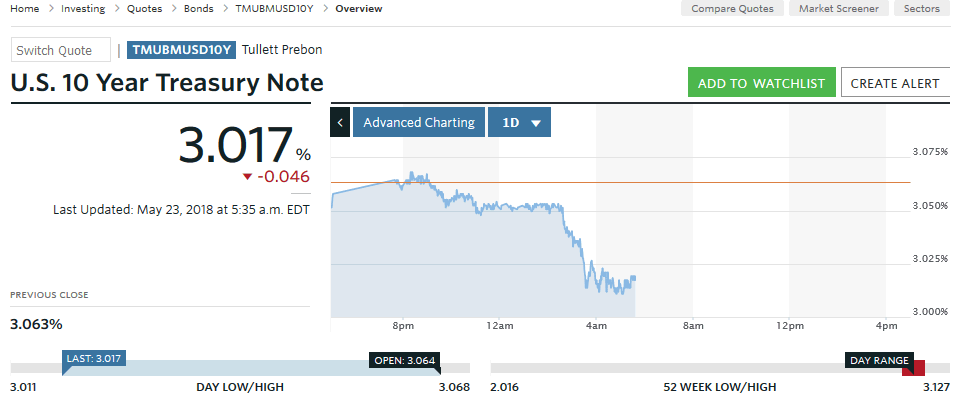
German 10 year bund yield reaches as low as 0.497, comparing to yesterday's 0.559.
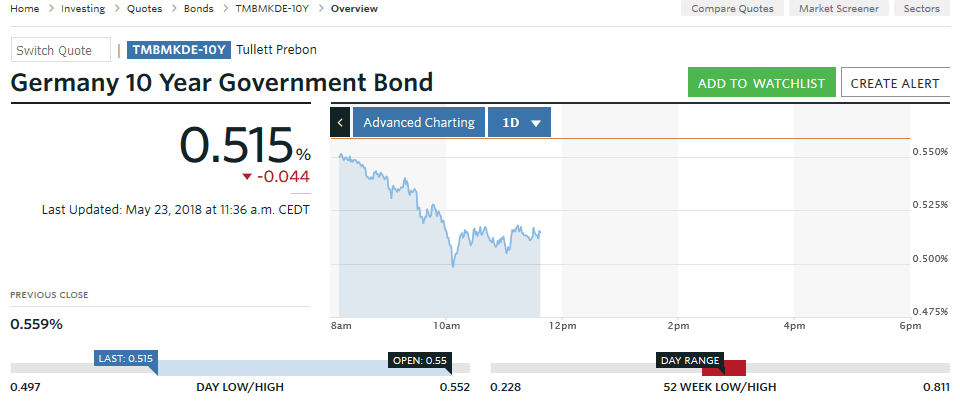
UK 10 year gilt yield dips to as low as 1.449, comparing to yesterday's 1.523.
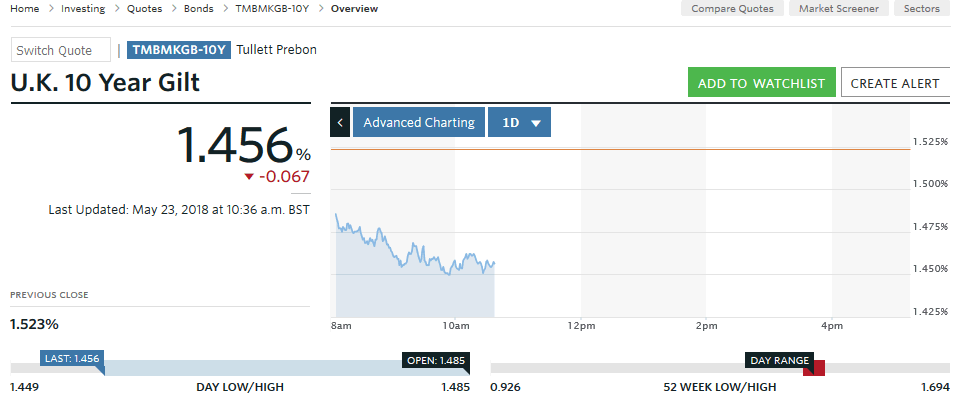
Chart screenshots from MarketWatch.
EURJPY Plummets To 9-Month Low Near 128.46, Loses More Than 200 Pips
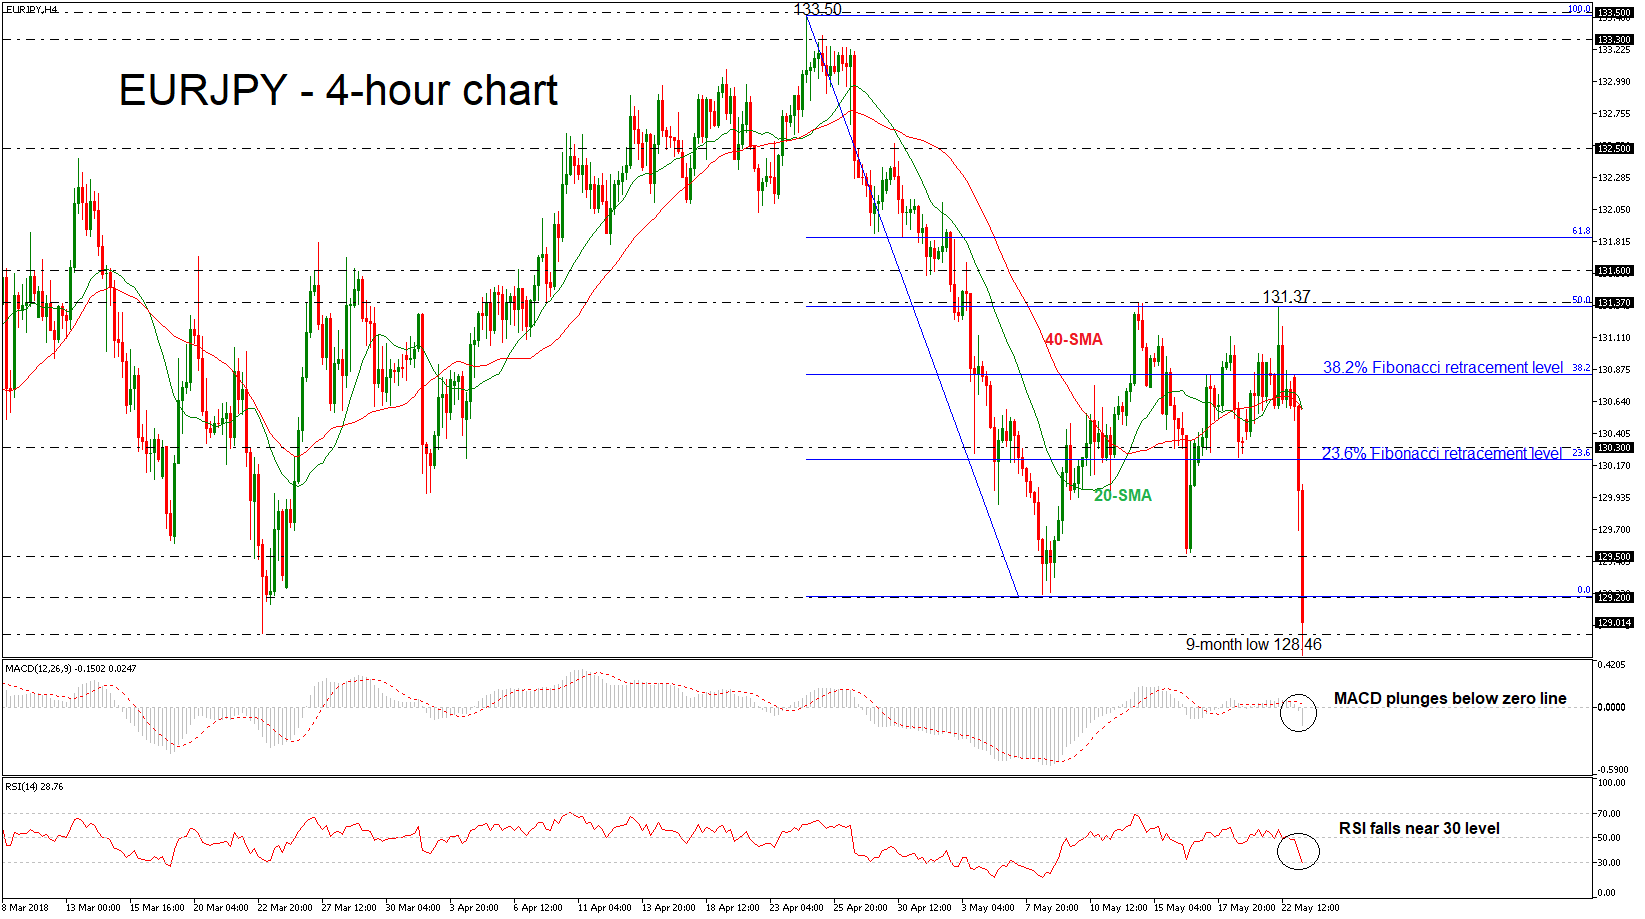
EURJPY plummeted over today's early European session, losing more than 200 pips after finding resistance at the 38.2% Fibonacci retracement level of the downleg from 133.50 to 129.2, near 130.85. This week, the pair is on the backfoot, creating a new nine-month low at 128.46 and the technical indicators in the 4-hour chart suggest that the market could ease more in the short-term.
Technically, in the 4-hour chart, the RSI is currently increasing negative momentum towards its oversold zone after the rebound on the neutral threshold, while the MACD oscillator is strengthening its bearish momentum plunging below the zero line.
Should prices decline, immediate support could be found around the 128.00 psychological level, an area which has provided support to price action on August 11, 2017. Then a leg below that level, the pair could meet the 127.55, the lowest level reached since August 18, 2017.
However, if the market manages to pick up speed, the 129.50 barrier, could offer nearby resistance ahead of the 23.6% Fibonacci near the 130.30 resistance level. A significant close above the later level could touch the 20- and 40-simple moving averages (SMAs) around 130.60.
EURJPY continues the aggressive sell-off that started a month ago and the outlook remains strongly negative since prices hold below all the moving averages and the bearish cross between 20- and 40- SMAs stays in place.
Italian Jitters Deteriorates Risk Sentiment
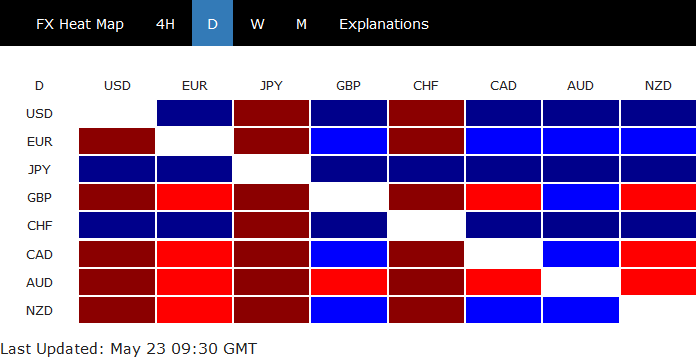
USD buoyed as risk sentiment deteriorates
The greenback rose across the board on Wednesday morning amid general increase in nervousness to Italy’s future government. The dollar index surged to 93.975, up 0.35% on the day, as the euro dipped to 1.1711 (-0.57%), the pound sterling slid to 1.3385 (-0.35%), while the loonie gave up 0.50% with USD/CAD increasing to 1.2882. On the other hand, safe haven currencies were better bid this morning as both the Japanese yen and the Swiss franc extended gains. USD/CHF slid as low as 0.9895, while USD/JPY returned towards 110.
Market participants are still waiting for Italian President Sergio Mattarella to approve Giuseppe Conte as prime minister. The Italian President still hasn’t taken his decision suggests that he is not entirely convinced Conte would fit the job. It may sound as a good thing for investors as one may assume that if Mattarella refuses to appoint Conte, the 5-Star Movement and the League would have to propose someone with an actual political base and a stronger political background. Indeed, Conte is mostly unknown, has no political experience and is therefore unpredictable – and as you know markets like predictability.
We remain cautious regarding a potential pull back of the market against such a backdrop. Indeed, the 5-Star and the League won’t give up their program should Conte be turned aside. This period of uncertainty could last more than a few, especially if they want to get their hands dirty as soon as possible, starting with their campaign promises: slashing taxes, boost spending, roll back pension control immigration and ask for a debt write-off.
Strong yen
JPY continues to gain on risk aversion trading. UISDJPY has fallen sharply to 109.90 from 110.95 on persistence selling pressure. Outside of the obviously macro environment risk which are generally “media-cycle” led suggesting short-term volatility and swings, there is the weak Japan economic fundamentals. Recent inflation slowdown is clearly disappointing for the BoJ and continues to present a significant challenge for the central bank. Japanese core inflation is well below 1% which is the lowest in the G10. Even the weaker JPY is unlikely to generate meaningful inflation forcing the BoJ to lowers is inflations forecast again. Barring a momentous economic acceleration or positive inflation shock, it’s unlikely that the BoJ will meet its 2% target. We continue to see the BoJ moving away from stick adherence to monetary policy steering within Abenomics. The BoJ appears to surrendered on reaching its inflation target. The closer we move toward the BoJ end-game the more market will be pricing in a strong JPY. Deceleration of BoJ focus on normalizations and lagging EUR suggest a constructive trade on long EURJPY.
Forex Technical Analysis: EUR/USD, USD/JPY, GBP/USD
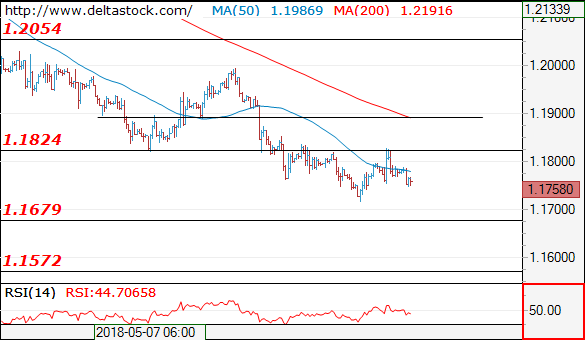
EUR/USD
Current level - 1.1758
The recent rise to 1.1830 should be considered corrective and my outlook is bearish, for a slide towards 1.1680, en route to 1.1570 area.
| Resistance | Support | ||
| intraday | intraweek | intraday | intraweek |
| 1.1820 | 1.2000 | 1.1680 | 1.1680 |
| 1.1890 | 1.2160 | 1.1480 | 1.1480 |
 USD/JPY
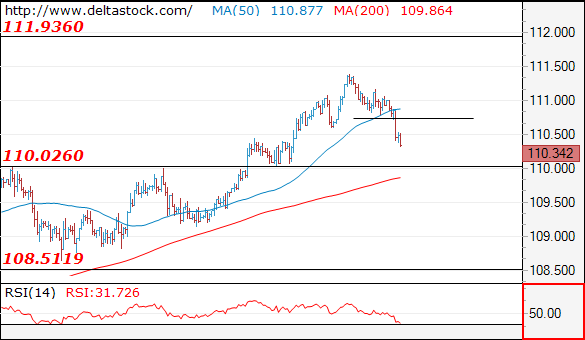
Current level - 110.34
The intraday bias is bearish below 110.70, for a tight test of 110.00 area. The latter should provoke a rebound towards 110.70.
| Resistance | Support | ||
| intraday | intraweek | intraday | intraweek |
| 110.70 | 111.90 | 110.00 | 110.00 |
| 111.90 | 114.40 | 109.15 | 108.50 |
GBP/USD
Current level - 1.3400
Yesterday's rebound to 1.3490 was simply a corrective one and the overall bias remains bearish, for a slide towards 1.3300 area.
| Resistance | Support | ||
| intraday | intraweek | intraday | intraweek |
| 1.3460 | 1.3990 | 1.3390 | 1.3310 |
| 1.3570 | 1.4100 | 1.3310 | 1.3310 |