Sample Category Title
Japanese Inflation To Further Ease, BoJ Normalization Cycle Not Yet Visible
Japan's inflation figures for the month of April are due on Thursday at 2330 GMT. The numbers are expected to show an easing in core CPI, this being the measure targeted by the Bank of Japan in its policymaking, and point towards the direction of further monetary policy divergence between the Japanese and US central banks moving forward. This of course has implications for currency markets as well.
Core CPI, the measure that excludes volatile fresh food items but includes oil products, is projected to grow by 0.8% y/y in April, down from March's 0.9%. This would mark the reading's second straight decline, even in the face of rising oil prices. For perspective, the BoJ's annual target for the measure stands at 2%. Meanwhile, headline CPI, which has considerably slowed down in March, falling to 1.1% on a yearly basis from February's 1.5%, is again estimated to notably decline, with analysts expecting it at 0.7%.
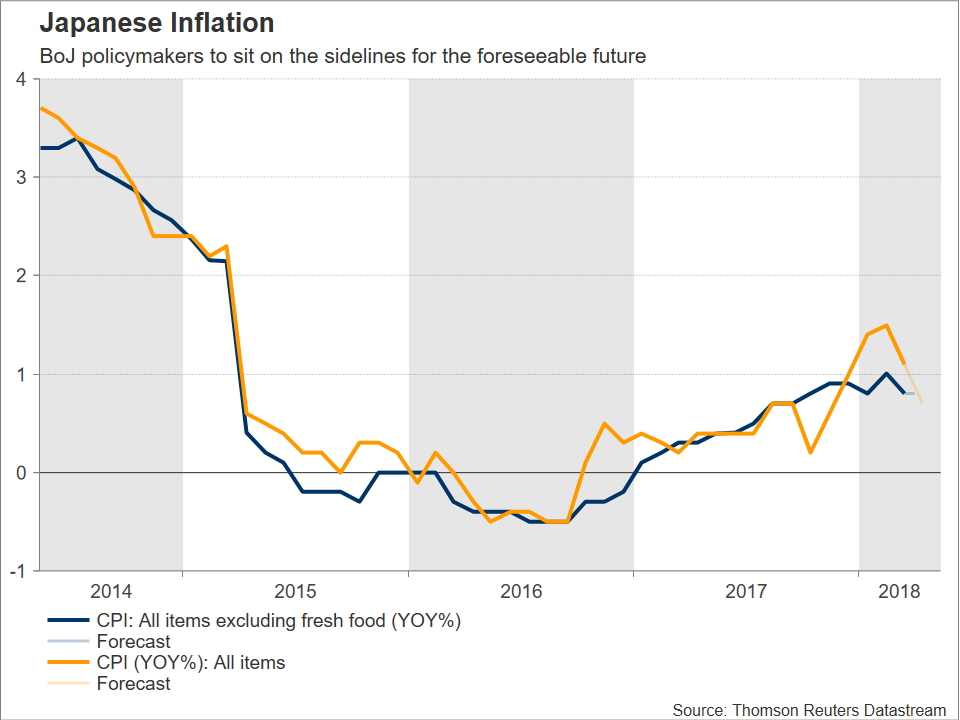
Should expectations materialize, and in conjunction with GDP figures from earlier in the week which showed economic activity contracting in Q1 after eight consecutive quarters of positive growth, then the BoJ still seems far from entering a policy normalization cycle. This is in stark contrast to the Federal Reserve: market participants currently debate the number of hikes the Bank will deliver in 2018 rather than any factors that could derail in a significant manner its plans for tighter policy. For the record, the US central bank has already delivered six quarter percentage point interest rate increases, while it has also started shrinking its balance sheet since it started normalizing its policies back in 2015.
Overall, the abovementioned are clearly pointing towards further policy divergence between the two central banks, a factor supportive of a stronger dollar/yen pair – other things equal – by virtue of higher yield differentials. In this respect, the positive relationship between rising yield differentials and an appreciating dollar/yen seems to have been reestablished over the last few weeks, after “falling apart” in previous months.
Turning to the FX markets and focusing on Thursday's release, stronger-than-projected prints are anticipated to generate buying interest for the Japanese currency, pushing dollar/yen lower. Support to declines could come from the area around the current level of the 200-day moving average at 110.18, including the 110 round figure. A steeper fall would shift the focus to the region around the 50% Fibonacci retracement level of the November 6 to March 26 downleg at 109.63. Conversely, weaker-than-forecasted numbers are likely to exert pressure on the yen, boosting USDJPY. The range around the 61.8% Fibonacci mark at 110.84, which also encapsulates the 111 handle, may be acting as immediate resistance. A break above would increasingly turn the attention to the 112 level.
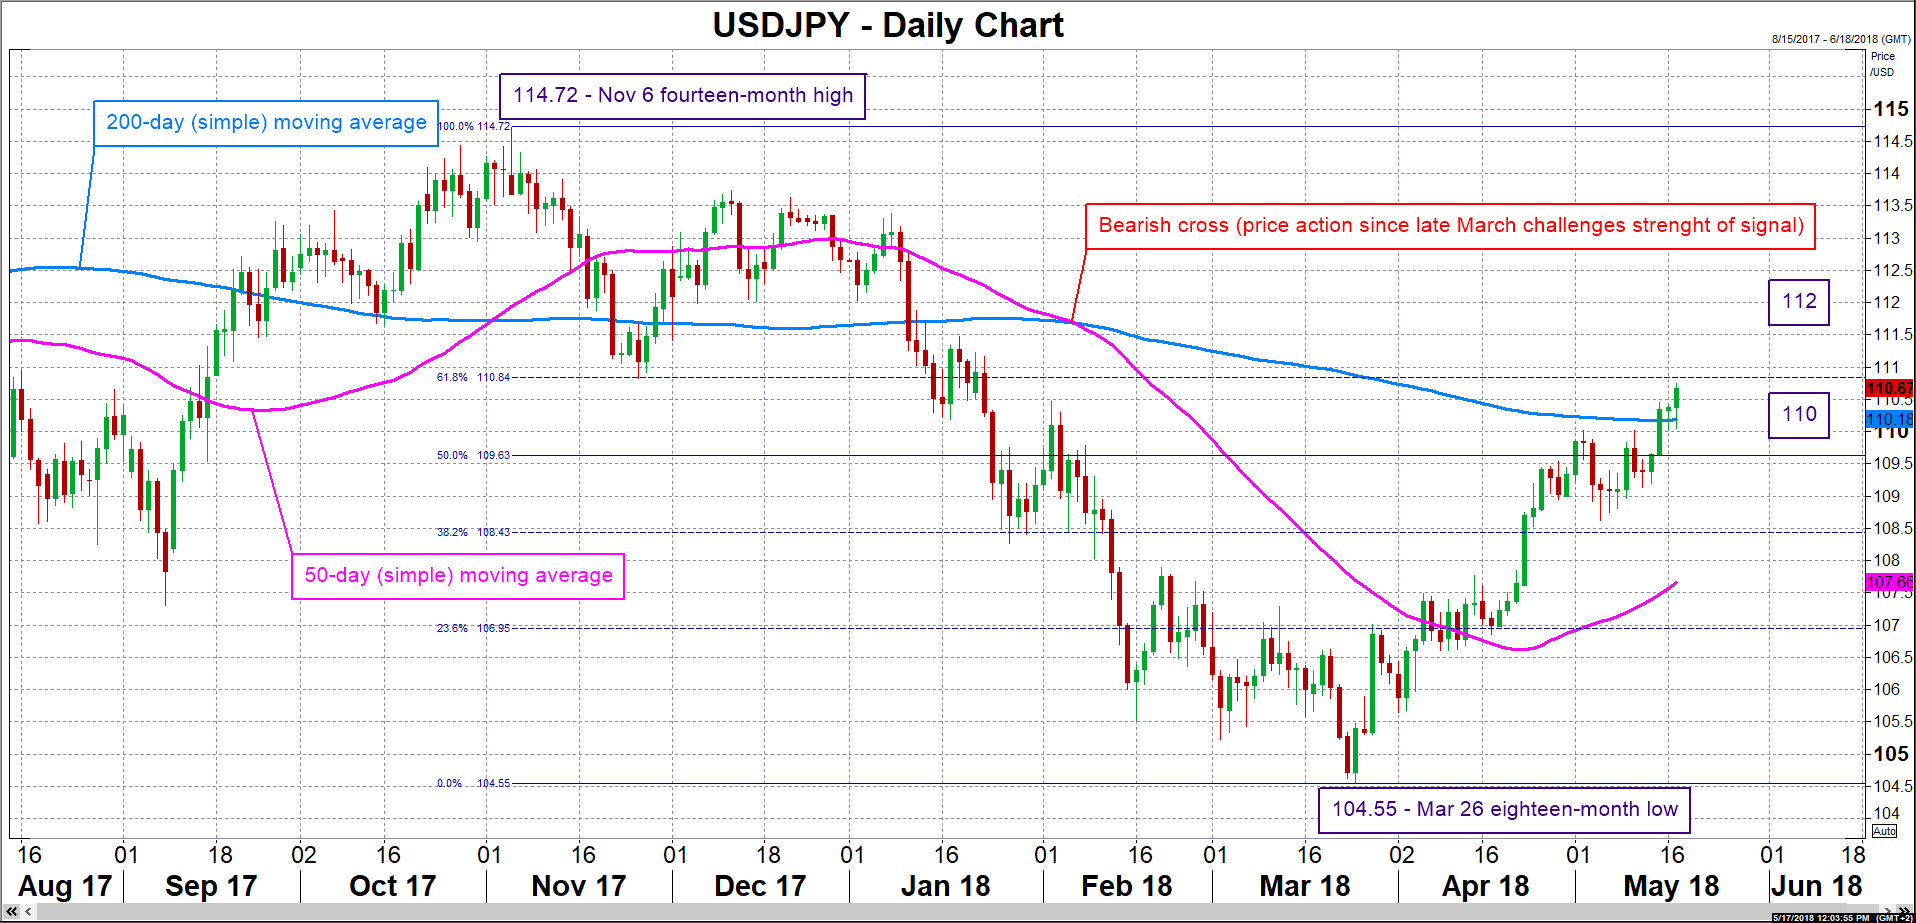
In the wider picture, the dollar has advanced versus the yen for seven straight weeks, while it is on track for another weekly gain. Should the region around 111 yen be broken as well, then this might pave the way for stronger bullish movement which might allow the greenback to erase its year-to-date losses against one of only two major currencies which is still in the green so far in 2018 against the US currency; the other one is the Norwegian krone, while pound/dollar is practically flat at the moment.
With monetary policies supporting a stronger USDJPY, the yen will need fresh drivers to gain ground. Those could come in the form of data releases or uncertainty in international markets – the yen holds a safe-haven status in investors' eyes and tends to gain in a risk-off environment. With respect to the latter, the trade narrative as of late is one of a more conciliatory tone between the US and China. If positive momentum is maintained on this front, then it is again adding to the view for a depreciating Japanese currency.
NZDUSD Finds Resistance Near 40-SMA In 4-Hour Chart, Bearish Mode Is In Progress
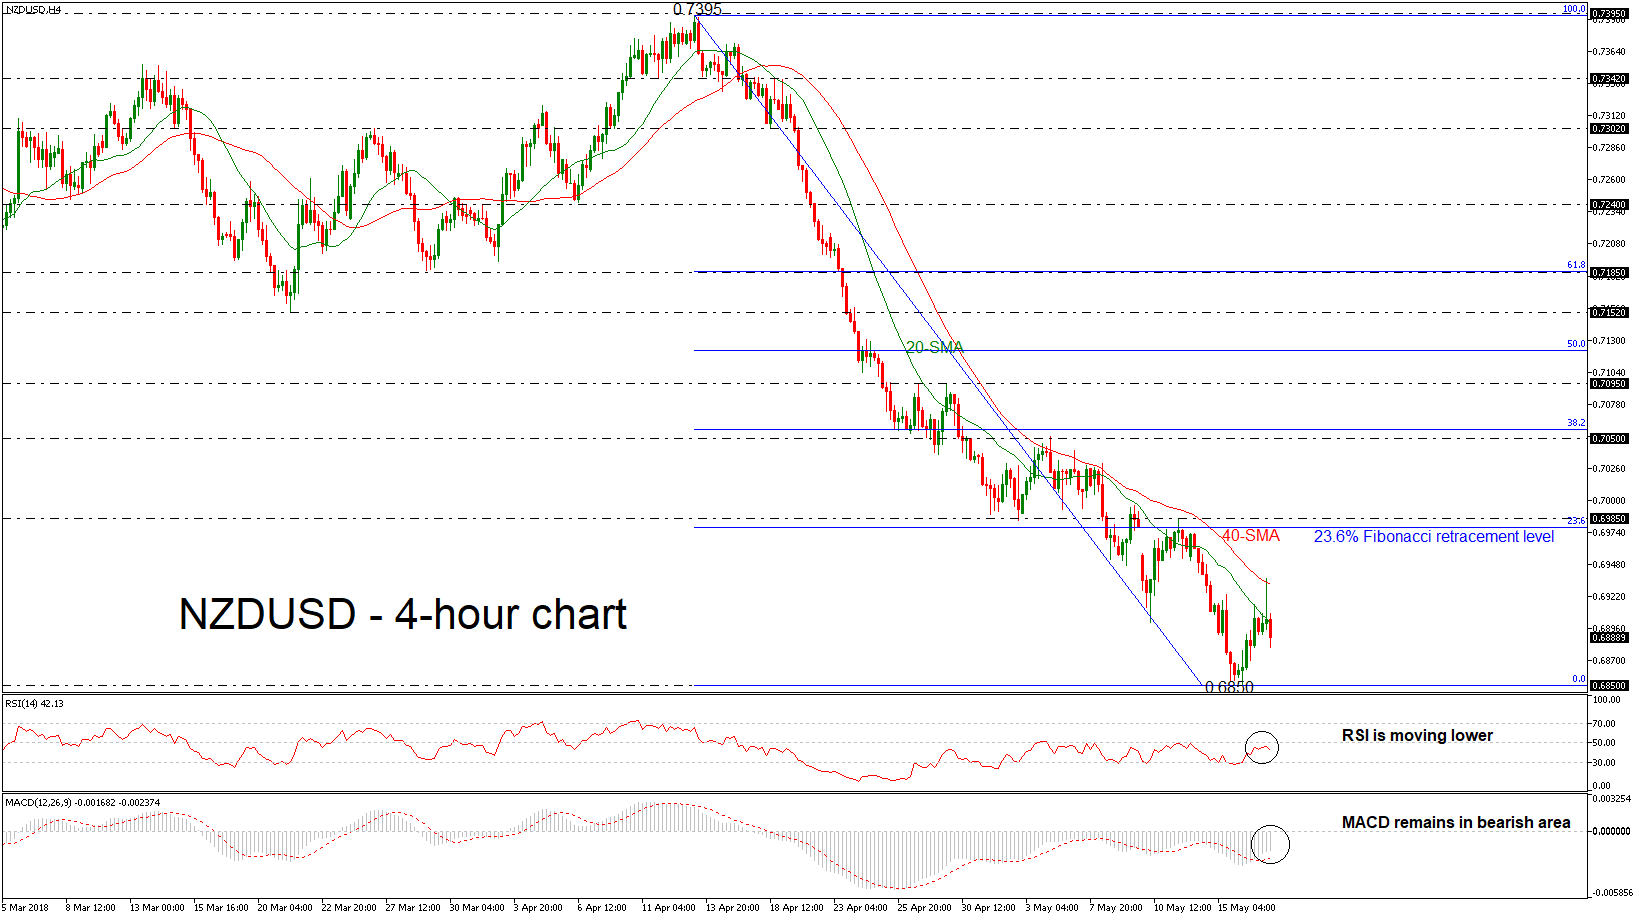
NZDUSD has come under renewed selling pressure, falling below its 20-simple moving average (SMA) after the pullback on the 40-SMA in the 4-hour chart. Despite the latest bounce off, the pair has not posted a fresh lower low, yet, but the technical indicators are endorsing the negative pressure.
Looking at momentum indicators, in the short-term timeframe, they suggest further decline may be on the cards. The RSI indicator is sloping down in the negative area, while the MACD oscillator holds above its trigger line but remains in the bearish threshold.
In case of further declines, the next hurdle to watch is the five-month low of 0.6850, achieved during yesterday’s daily session. If sellers manage to push below that barrier, that would mark a new lower low for this year, increasing the probability for further bearish extensions. Support may be found near the 0.6820, identified by the bottom on December 2017.
Conversely, if the bulls retake control, price advances may stall initially, near the latest highs at 0.6985, which stands near the 23.6% Fibonacci retracement level of the downleg from 0.7395 to 0.6850. A potential upside violation of this level would drive the pair towards the 0.7050 resistance barrier.
To sum up, NZDUSD has been posting steeper losses since April 13 with no significant upside correction so far.
Forex Analysis: GBPJPY And GBPAUD
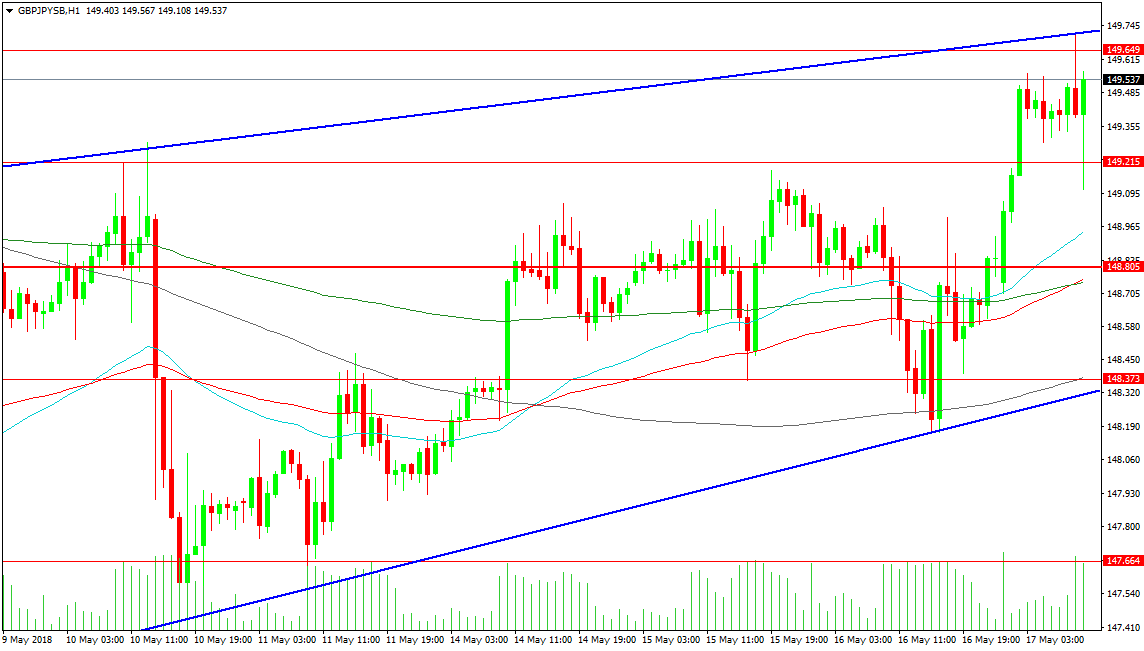
The GBPJPY pair has rallied to the resistance trend line at 149.710, only to rebound lower and test Tuesday’s high at 149.182. The rally was the result of reports that the British Government is to maintain the Customs Union with the EU past 2021. While this is positive news, it does lead to questions about the unity of the cabinet and the future of PM May’s Government. The uptrend seen here on the 1-Hour chart is still intact and long traders will hope to breach the 150.000 level soon, with targets at 150.655 and 151.280.
Support has been established around the 149.000 area, with rising 1-Hour moving averages centred on 148.800. The rising trend line support is at 148.370, with a breach of 148.000 painting a bearish picture for the pair. This would target initial support at the 147.500 area, followed by 147.000 and 146.450 in extension.
GBPAUD
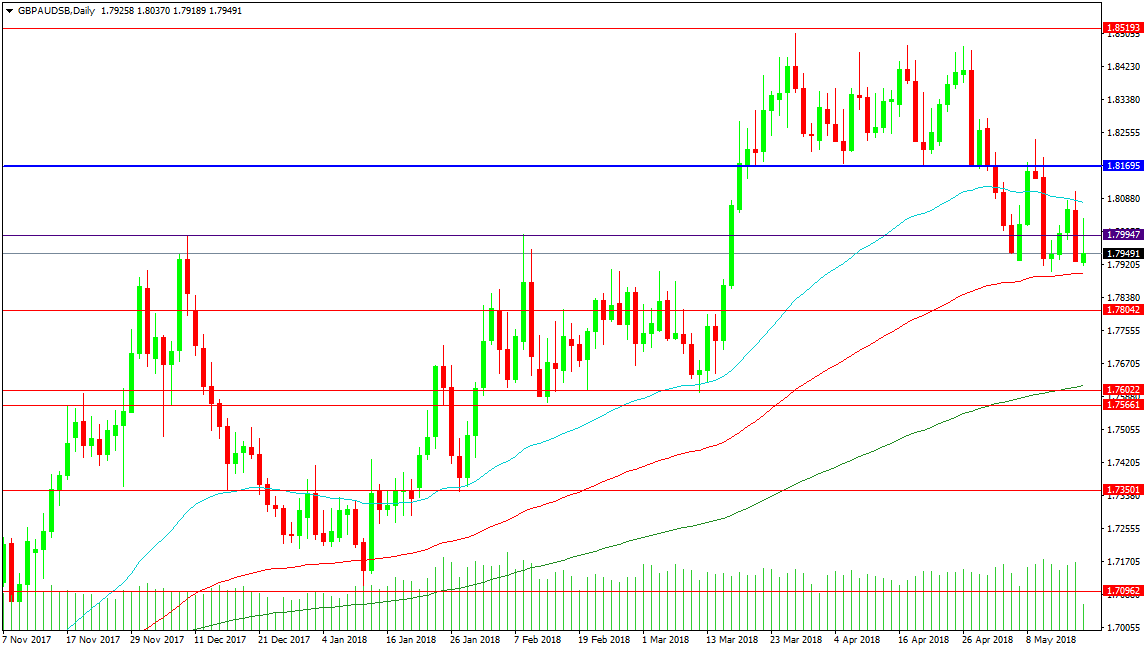
This pair has slipped under previous support at 1.81695 and is trading in a range, with a floor at 1.79000. This floor corresponds with some of the highs achieved in late February and early March. The 100 DMA is also supporting price at 1.78994. While price consolidates here, support and resistance are building up, with the next supportive zone at 1.76000, strengthened by the 200 DMA. A loss of that area would target the 1.73500 level, followed by the 1.71000 area in extension.
Resistance at the 50 DMA comes in at 1.80780 and this needs to be overcome to target the ceiling of the range at 1.81695. A break higher would be strengthened by a move above 1.83000, which would enable traders to reach for the highs at 1.85000.
EM Rout: Bye-Bye TRY, BCB On Hold
End of CBT independace … bye bye TRY
Turkish Lira was swinging in a precarious position after losing over 21% against the USD since the start of the year. Geopolitical and domestic uncertainties, real interest rates are negative and heavy USD current account have markets yelling for deeper devaluation. Yet there was a thin hope that the CBT would regains control of the destabilizing TRY sell-off by raising interest rates. However that was killed as President Erdogan’s in a Bloomberg interview clearly indicated that new executive powers give him the right to drive monetary policy. At that moment effectively killing the CBT perceived independence and any hope that TRY sell would stop over the mid and long term.
I went on to confirm hat he wanted lower interest rates. This declarations that the CBT should listen to the guidance of the executive head of state significantly lowers the probably of an “emergence” interest rate hike. Move in interbank rate indicate that 175bp of rate hike are price in yet in the broader capital flight environment the exact implications are less certain. Heading into the June 24th elections is not a given that interest rates would be immediately chopped by 300 -400bp however this result cant not be ruled out. In the current environment our base scenario for TRY is further weakness and despite short term development that long game for Turkey and CBT remains severely negative.
BCB forced to hold rate amid EM rout
The Brazilian central bank held interest rate steady yesterday at odds with market expectations. Indeed, market participants expected that the BCB would keep going with its easing cycle by cutting the Selic rate by 25bps to 6.25%. Instead, the bank maintained the Selic at 6.50%. This surprise decision signalled that the institution has realised that the global outlook has become more uncertain, especially for emerging market.
Indeed, the Brazilian real had a rough month so far as it lost around 10% against the greenback, with USD/BRL hitting 3.6944 (the highest level since April 4th 2016) yesterday. Despite sound levels of inflation - 2.76%y/y in April - the currency weakness is casting a shadow on the price outlook as Brazil could start to import massively inflation (through its imports). Therefore, we think that the central will rather wait for the dust to settle before resuming its easing cycle. Regarding the Brazilian real, the current global environment – the Fed’s tightening cycle together with the geopolitical situation – does not allow for excess optimism.
Central Bank of Mexico to maintain rate unchanged
At today’s monetary policy meeting, Mexico’s central bank is expected to hold its overnight rate at 7.50%, maintaining a hawkish stance though. Currently given at 9-year high, Mexican key rate steep rise in the last two years continued amid increasing concerns with regard to swelling inflation and North American Free Trade Agreement (NAFTA) reconsiderations. Indeed, starting from 2016, consumer prices rose from 2.61% to 4.55% on year-to-year basis, putting Bank of Mexico’s 3% inflation target far off the mark.
Looking at the broader picture however, inflation eased quite significantly, decreasing from 6.80% (y/y) in December 2017 (16 years high) to 4.55% in April, a rather encouraging trend for the Mexican monetary authority who’s been struggling for a long time to stabilize this situation.
Accordingly, despite an inflation rate above the target, we would rather favor an unchanged interest rates scenario due to current interest rate levels and higher-than-expected slowdown in inflation rate since the beginning of the year, though continued weakness on the peso could be a hurdle if the greenback would be gaining ground.
As NAFTA talks seem to converge toward an encouraging outcome, we would expect the Mexican peso to regain strength in the near term. Strongly depreciating since mid-April 2018 (+8.25%) and almost flat since the beginning of the year (-0.69%), USD/MXN is currently weakening as May monetary policy meeting approaches. We suspect however tonight’s decision to have a rather subdued impact on the FX market in the short-term. Currently trading at 19.52, the pair is expected to decline further, heading along the 19.50 range in the short-term.
Forex Technical Analysis: EUR/USD, USD/JPY, GBP/USD
EUR/USD
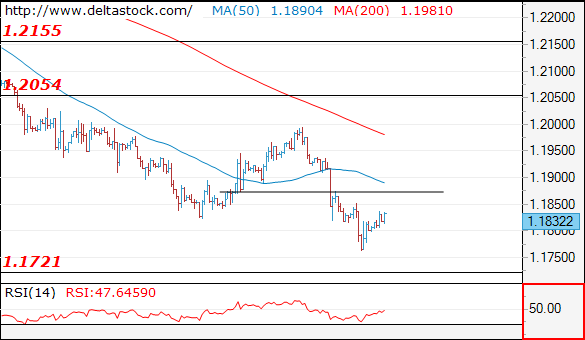
Current level - 1.1832
Current rebound after 1.1760 should be considered corrective, preceding another slide towards 1.1720, en route to 1.1480. Initial intraday resistance lies at 1.1870.
| Resistance | Support | ||
| intraday | intraweek | intraday | intraweek |
| 1.1870 | 1.2060 | 1.1760 | 1.1720 |
| 1.1910 | 1.2160 | 1.1720 | 1.1480 |
 USD/JPY
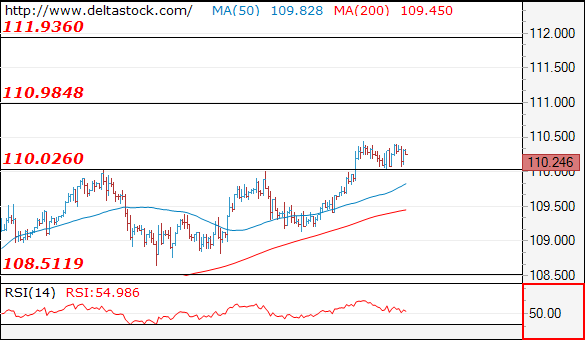
Current level - 110.24
My outlook remains bullish after the recent corrective pattern above 110.00, for a rise towards 111.00, en route to 111.90.
| Resistance | Support | ||
| intraday | intraweek | intraday | intraweek |
| 111.00 | 111.90 | 110.00 | 108.50 |
| 111.90 | 114.40 | 109.15 | 107.90 |
GBP/USD
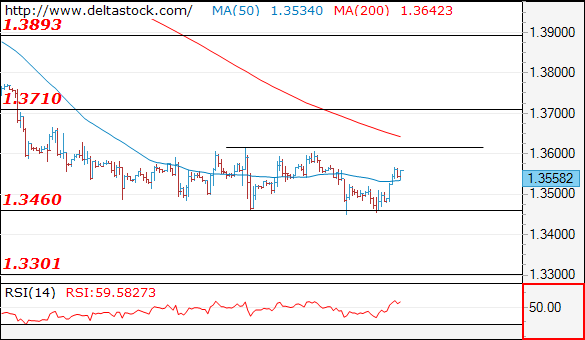
Current level - 1.3558
Despite the positive intraday bias, my outlook is bearish below 1.3615 crucial high, for a renewal of the downtrend through 1.3160, towards 1.3300.
| Resistance | Support | ||
| intraday | intraweek | intraday | intraweek |
| 1.3615 | 1.3990 | 1.3450 | 1.3460 |
| 1.3710 | 1.4100 | 1.3310 | 1.3310 |
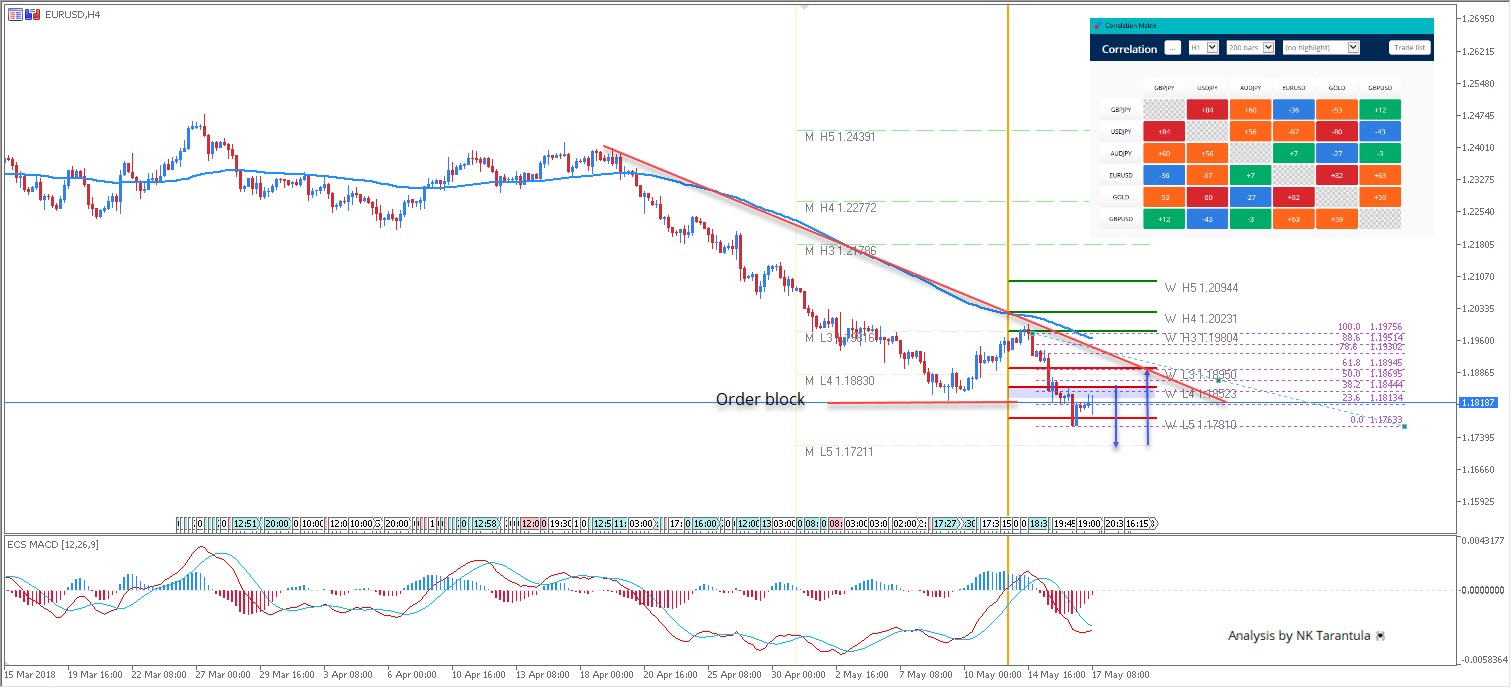
EUR/USD Close To The Strongest Monthly Support
The EUR/USD has been in a steady downtrend after it broke from consolidation mode. The pair went below 1.1780 yesterday, but 1.1720 is still a big hurdle for bears. The price is rejecting the W L5 level, and we could see 1.1850. However, 1.1835-50 could provide a rejection towards 1.1763 retest and 1.1720 zone. If the price hots 1.1720, we could see a bounce towards a more significant correction – 1.1895.
W L3 - Weekly Camarilla Pivot (Weekly Interim Support)
W H3 - Weekly Camarilla Pivot (Weekly Interim Resistance)
W H4 - Weekly Camarilla Pivot (Strong Weekly Resistance)
M H4 - Monthly Camarilla Pivot (Very Strong Monthly Resistance)
M L3 – Monthly Camarilla Pivot (Monthly Support)
M L4 – Monthly H4 Camarilla (Very Strong Monthly Support)
POC - Point Of Confluence (The zone where we expect price to react aka entry zone)
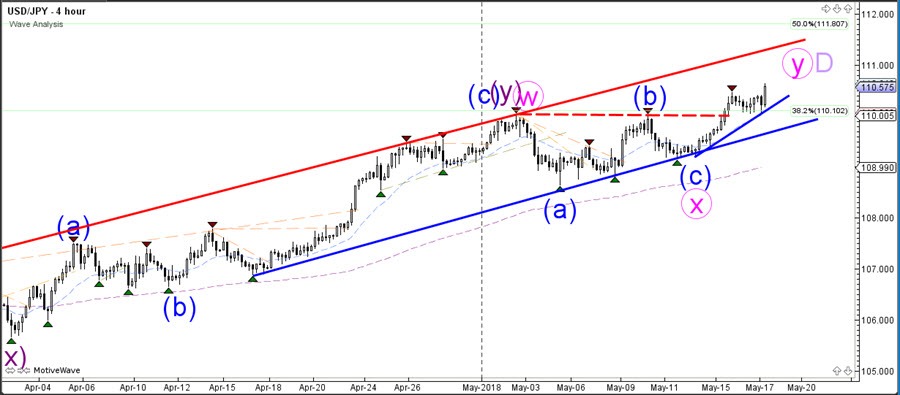
USDJPY Retraces And Bounces At Broken 110 Round Level
The USD/JPY retraced back to the broken resistance level of 110 and used it as a support area for a bullish bounce and uptrend continuation. Price now has plenty of space for another bullish impulse within the uptrend. Price seems ready to move higher towards the 50% Fibonacci level and the top of the uptrend channel.
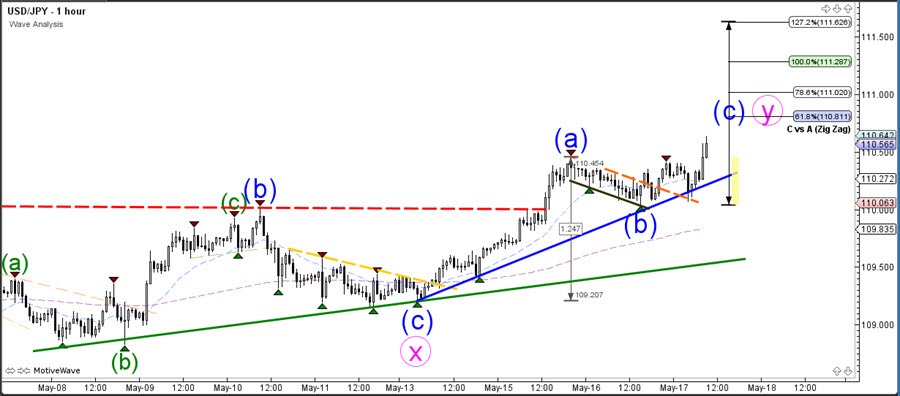
The USD/JPY broke above the resistance of the bull flag chart pattern and used the broken resistance as a bouncing spot for further upside. This breakout indicates a bullish continuation towards the Fibonacci targets of wave Y (pink).
GBP/USD Downtrend Losing Steam After Bullish Breakout
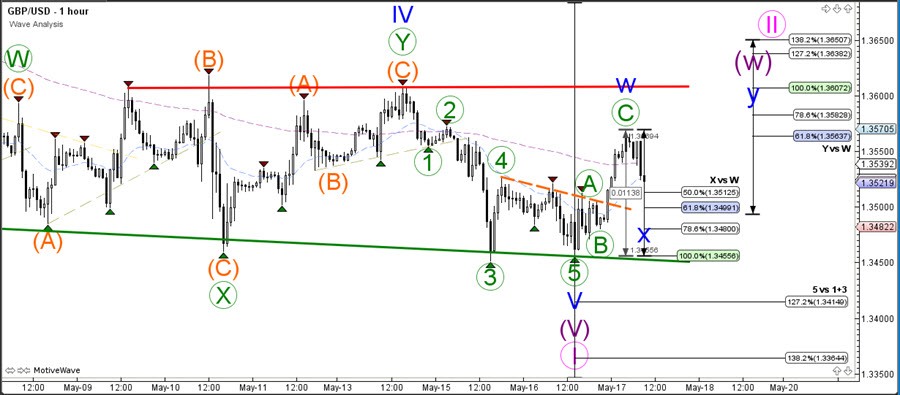
The GBP/USD could continue with the downtrend but price will need to break below the key support zone before a bearish continuation is likely. Otherwise a bullish corrective reversal could take place and price could break above the consolidation zone. Price will need to break either the resistance (red) or support trend line (green) before it becomes clear whether price is still in the wave 5 (purple) of wave 1 (pink) or whether the wave 2 (pink) correction has finally started.
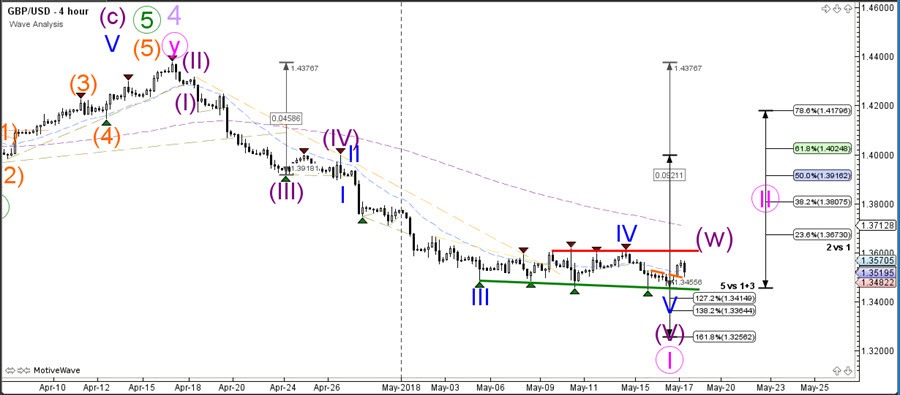
A bearish breakout below the 61.8% Fib could see price fall towards the support trend line (green) and a break below that support line could see price continue with the downtrend and towards the Fibonacci targets.
EUR/USD Analysis: Needs To Gain Bullish Momentum
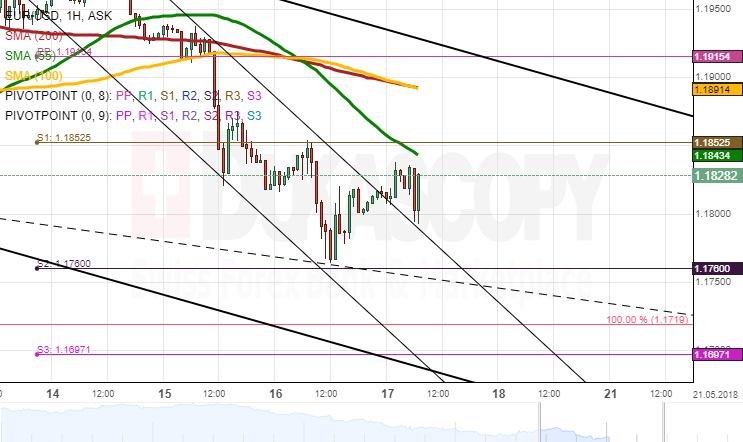
EUR/USD remained trading between the weekly S1 and S2 on Wednesday. It reversed near the 1.1760 mark mid-session and edged higher just to breach the prevailing junior channel and approach the 55-hour SMA near 1.1850.
It is expected that the pair tries to maintain its upward movement during most of the day. However, it does face two strong resistance clusters that could hinder or event halt the Euro's further advance, namely, the weekly S1 and the 55-hour SMA or the 100– and 200-hour SMAs at 1.1850 and 1.1900, respectively. It is unlikely that the latter is breached today, thus setting this level as the daily high.
On the other hand, technical indicators flash bearish signals. In the worst-case scenario, the Euro could fall down to its 2018 low of 1.1720 but it should nevertheless remain above it.
GBPUSD Analysis: Moves Above Major Resistance
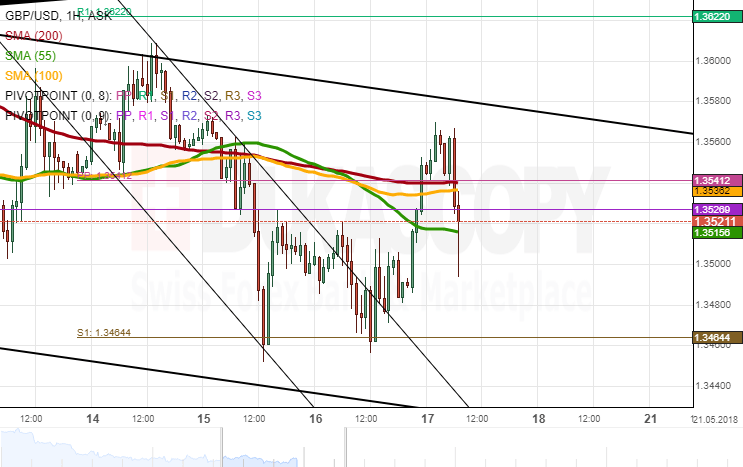
GBP/USD stood at a standstill on Wednesday, as no significant price changes occurred throughout the day. Instead, the pair was fluctuating in a range between 1.3460 and 1.3520. The former is a major support level which has worked effectively at halting a fall below it during the last five months.
This lack of direction shifted late in the session when the Pound dashed through the strong resistance of the 55-, 100– and 200-hour SMAs near 1.3530. It is likely that this cluster provides a good stepping stone for further appreciation.
Technical indicators demonstrate that there is still some upside potential, so the rate is expected to move past the two-week descending channel and towards the senior pattern circa 1.3650.
In terms of the daily low, the Sterling is unlikely to breach the 1.3450 mark.