

Sample Category Title
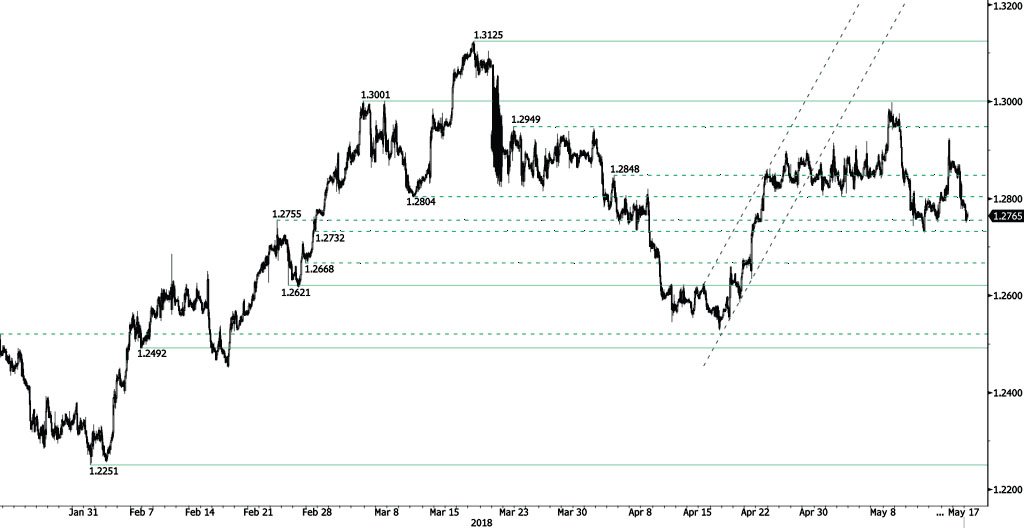
USD/CAD Trading Below 1.28
USD/CAD bearish pattern continues after reaching 1.2925 (15/05/2018 high), heading along 1.2750. Hourly support and resistance are given at 1.2621 (23/02/2018 low) and 1.3001 (05/03/2018 high). The technical structure suggests further short-term downward moves.
In the longer term, the pair is trading between resistance point at 1.3805 (05/05/2017 high) and support at 1.2128 (18/06/2015 low). Strong resistance is given at 1.4690 (22/01/2016 high). The pair is likely to head lower. The pair is trading above its 200 DMA.
USD/CHF Slight Decrease
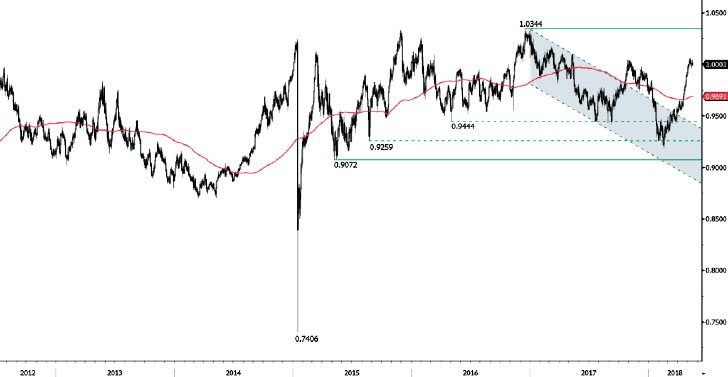
USD/CHF is slightly decreasing after reaching 1.0019 high, trading at 1.0007 and heading along 1. Hourly support and resistance given at 0.9755 (10/01/2018 low) and 1.0091 (09/05/2017 high) are maintained. The technical structure suggests short-term downward moves.
In the long-term, the pair is still trading in range since 2011 despite some turmoil when the SNB unpegged the CHF. Key support lies at 0.9072 (07/05/2015 low) while resistance at 1.0344 (15/12/2016 high) is distanced. The technical structure favours a long term bullish bias since the unpeg in January 2015.
Gold Trading Below 1290
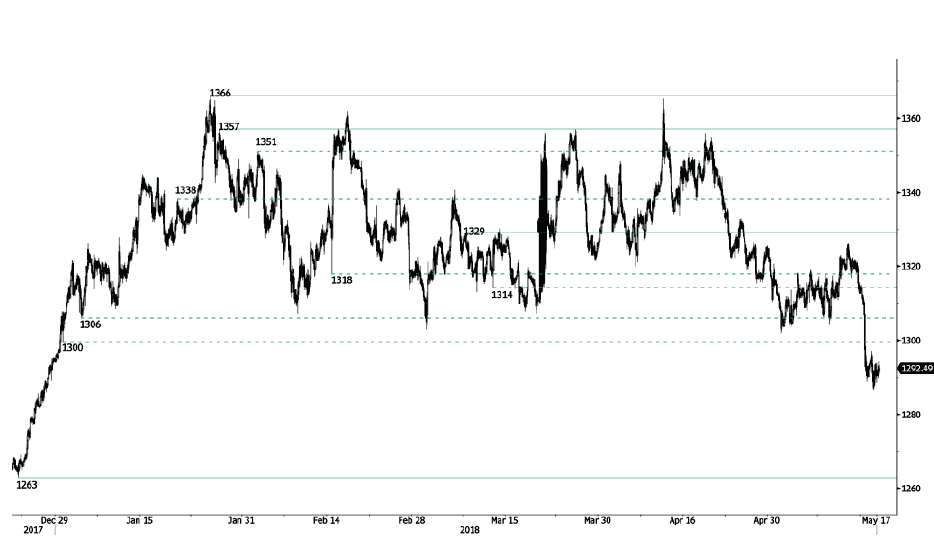
Gold bearish pressures continue, trading below 1290 and heading along 1286. Hourly support at 1300 (29/12/2017) is now broken. The pair is heading along the 1300 range. Hourly support and resistance are given at 1263 (21/12/2017 low) and 1329 (08/03/2018 high). The technical structure suggests short-term downward moves.
In the long-term, the technical structure suggests that there is a growing upside momentum. A break of 1'392 (17/03/2014) is required to confirm it. A major support can be found at 1'045 (05/02/2010 low). The pair is trading below its 200 DMA
Silver Decreasing
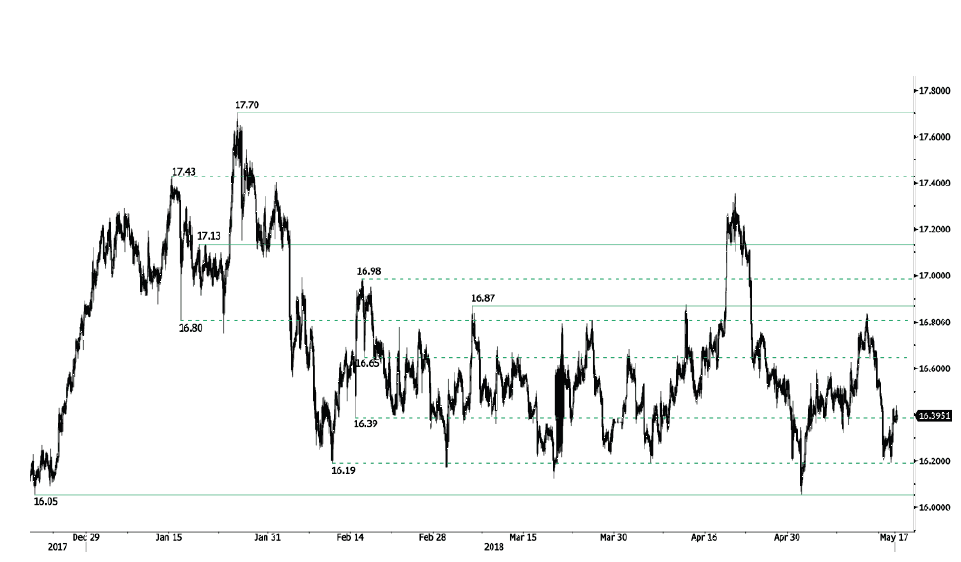
Silver is decreasing following recent rise at 16.44, trading at 16.35 and heading along 16.33. Hourly support and resistance are given at 16.05 (19/12/2017 low) and 16.87 (06/03/2018 high). The technical structure suggests short-term decrease.
In the long-term, the trend remains negative/ sideways. Further downside is very likely. Resistance is located at 21.58 (10/07/2014 high). Strong support can be found at 11.75 (20/04/2009). The pair is trading below its 200 DMA.
Crude Oil Heading Higher
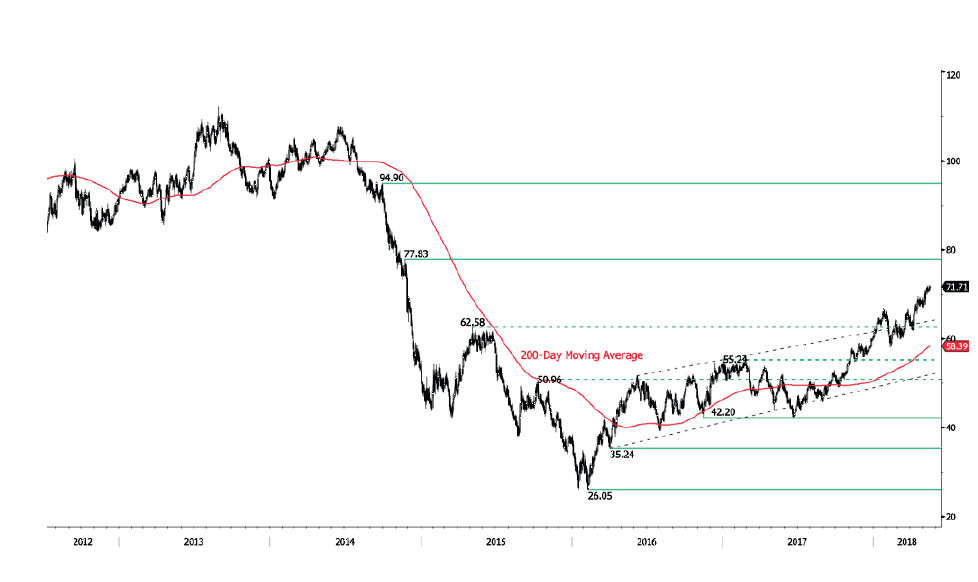
Crude oil is increasing further, trading above 71 and heading along the 71.90 range. Crude Oil is currently trading at November 2014 levels. The bullish pattern started in mid-February 2018 is maintained. Hourly support and resistance are given at 65.56 (17/04/2018 low) and 73.56 (28/11/2014 high). The technical structure suggests short-term upward moves.
In the long-term, crude oil has recovered after its sharp decline last year. However, we consider that further weakness is very likely. For the time being, the pair lies in an upside trend since June 2017. Support lies at 42.20 (16/11/2016) while resistance is located at 77.83 (20/11/2014). Crude oil is trading largely above its 200 DMA
Bitcoin Pushing Higher
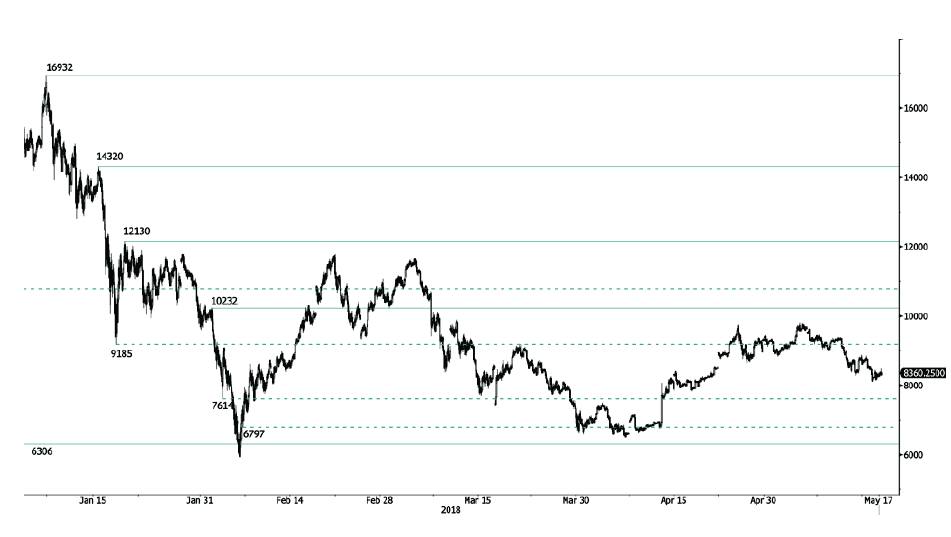
Bitcoin rise started in mid-April pauses, the pair is bouncing off from 8102 low and heading along the 8450 range. Bitcoin bearish pattern started in March 2018 is maintained. The pair is contained between hourly support and resistance given at 6306 (13/11/2017 low) and 10232 (01/02/2018 high). The technical structure suggests short-term increase.
In the long-term, the digital currency has had an exponential growth but also presented important downturns. There is decent likelihood that the currency could stabilize between 7'000 - 12'000 in 2018. Bitcoin is trading below its 200 DMA (8500 range).
USD/JPY Pausing Above 110
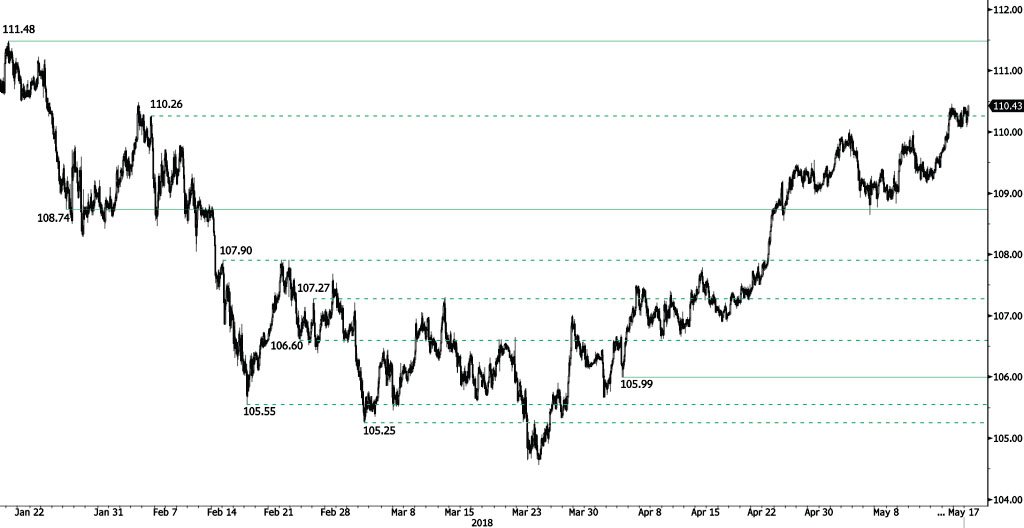
USD/JPY sideways price action started in May 15 continues, trading above 110. The bullish pattern started from 104.56 (25/03/2018 low) is maintained. Hourly support and resistance are located at 108.74 (25/01/2018 low) and 111.48 (18/01/2018 high). The technical structure suggests short-term sideways trading moves.
We favor a long-term bearish bias. Support remains at 101.20 (09/11/2016 low). A gradual rise toward the major resistance at 125.86 (05/06/2015 high) seems unlikely. Expected to decline further support at 101.20 (09/11/2016 low). The pair trades slightly above its 200 DMA.
GBP/USD Strong Bullish Pressures
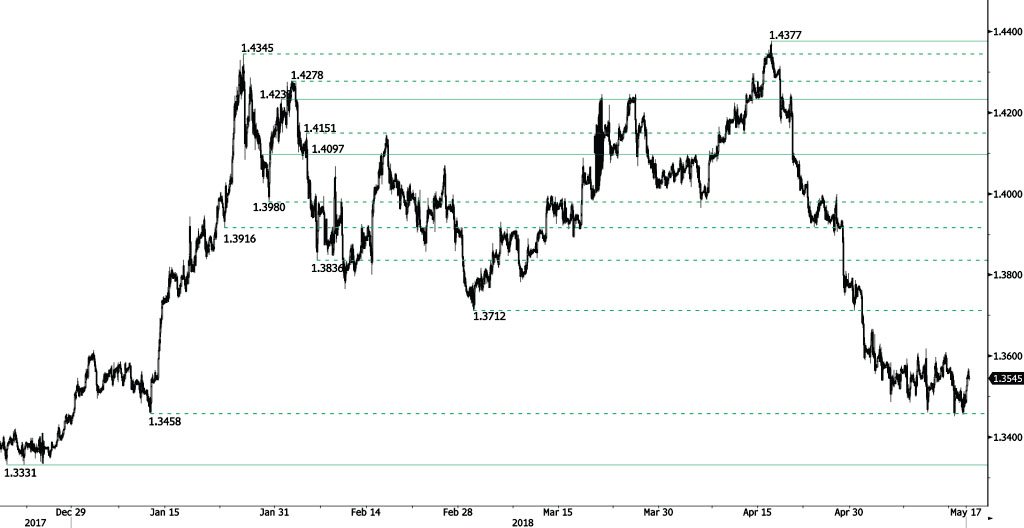
GBP/USD is bouncing off from 1.3456, trading above 1.35 and heading along 1.3585. Hourly support and resistance are given at 1.3331 (19/12/2017 low) and 1.4097 (29/01/2018 high). The technical structure suggests short-term increase.
The long-term technical pattern is reversing. The Brexit vote had paved the way for further decline but the pair is moving to 2016 highs. Long-term support and resistance are given at 1.1841 (07/10/2017 low) and 1.5018 (24/06/2016 high).
EUR/USD Edging Higher
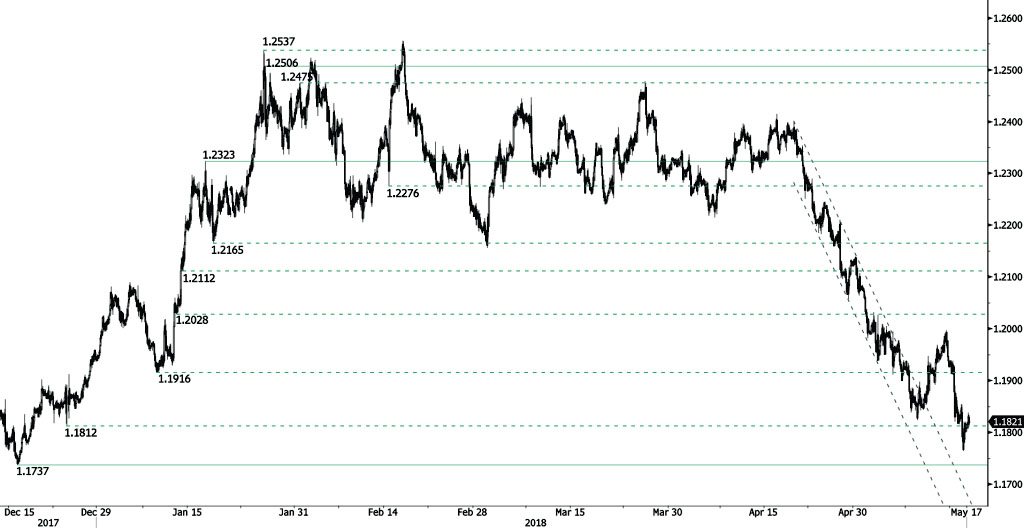
EUR/USD is bouncing off from 1.1764 low and broke hourly support at 1.1812 (25/12/2018). The pair is currently trading at 1.1830, heading along the 1.1840 range. The pair is currently at mid- December 2017 levels. Hourly support and resistance are now given at 1.1737 (17/12/2017 low) and 1.2323 (17/01/2018 high). The technical structure suggests short-term increase.
In the longer term, the momentum is turning largely positive. We favor a continued bullish bias. Key resistance is holding at 1.2886 (15/10/2014 high) while strong support lies at 1.1554 (08/11/2017 low).
GBP pares gains as PM office dismissed staying in customs union
GBP was knocked down by a Reuters report that the Prime Minister's office dismissed the news the UK is ready to stay in the EU customs union beyond 2021.
An unnamed source was quoted saying that “we agreed in December and in March to a backstop but the proposal put forward by the EU is completely unacceptable.”
“It would mean a border down the Irish sea and we could never agree to that. Negotiations are taking place on what a workable backstop might be."
“The PM and the government are absolutely clear once the implementation period is over in December 2020 we will be able to not only negotiate and sign trade deals with the rest of the world but also implement them.”
For now GBP/USD is holding above 1.3450 temporary low, GBP/JPY well above 148.16 minor support. No panic selling in GBP yet. Hopefulling the UK government will come out and say something to answer the question, to stay or not to stay.!