Sample Category Title
Elliott Wave Analysis: DAX Wave 3 Remains In Progress
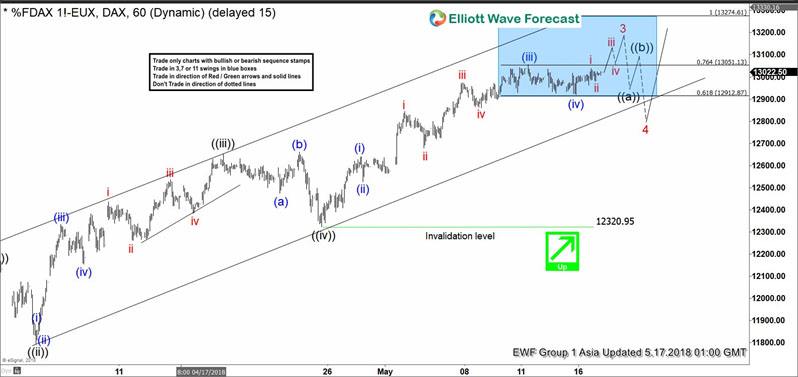
DAX short-term Elliott Wave view suggests that the rally from March 26.2018 low (11704) is unfolding as Impulse Elliott Wave structure. As an impulse, the internals of Minor degree wave 1, 3 & 5 should have subdivision of 5 waves impulse of lesser degree. In the case of DAX, Minute wave ((i)), ((iii)) & ((v)) are all impulsive.
Up from 11704, Minor wave 1 ended at 12047 and Minor wave 2 ended at 11771.5. Minor wave 3 is in progress where rally to 12168 ended Minute wave ((i)) of 3 in 5 waves structure. Minute wave ((ii)) of 3 ended at 11793 low. Then the rally to 12650 high ended Minute wave ((iii)) of 3 in 5 waves. Afterwards, pullback to 12322 low ended Minute wave ((iv)) of 3 as a Flat Elliottwave structure. Up from there, the rally is unfolding in another 5 waves structure in Minute wave ((v)) of 3 with lesser degree cycles showing 5 waves sub-division.
Near-term, the index has already reached the minimum target and swing to end Minor degree wave 3. However, while pullback stays above 12320.95 low, Index has scope to see a marginal push higher towards 13051.13-13274.61 area approximately. Afterwards, the index should pullback in Minor wave 4 in 3, 7 or 11 swings before further upside is seen. We don’t like selling the index.
DAX 1 Hour Elliott Wave Chart
USDJPY Trades Near 3-Month Peak, Further Positive Bias Is Expected In Near Term
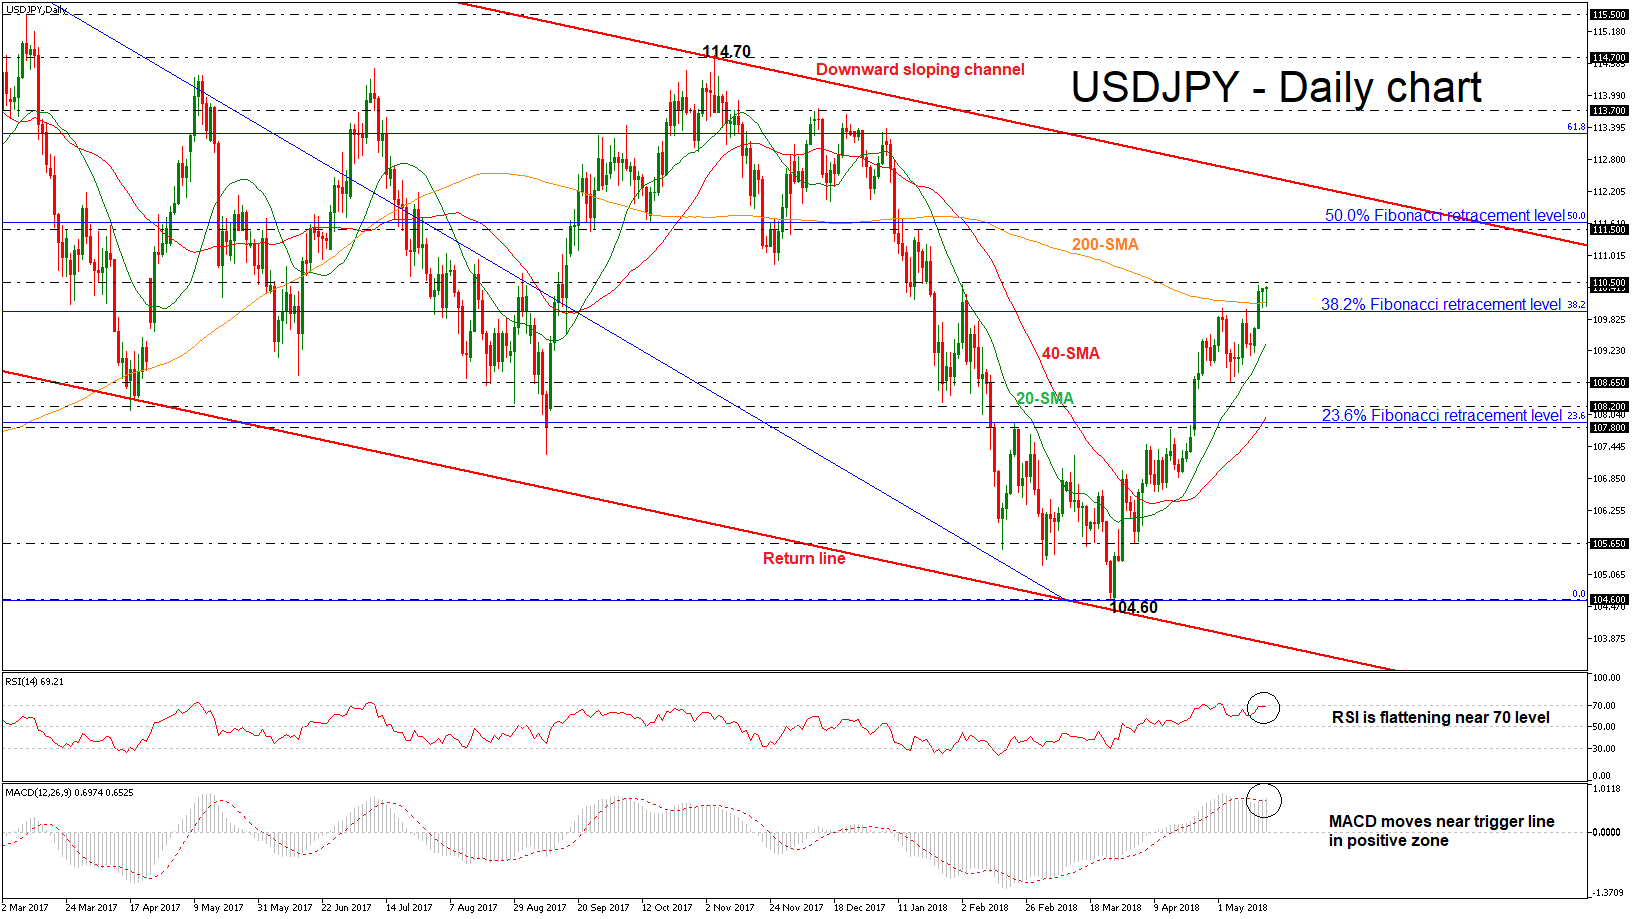
USDJPY is moving near its opening level during today’s early European session following the aggressive buying interest of the previous three days. The pair has challenged a fresh more than three-month high of 110.44 and successfully surpassed the 200-day simple moving average (SMA). The price remains above the aforementioned obstacle however, technical indicators suggest that the market could ease a little bit in the short-term.
From the technical point of view, in the daily timeframe, the RSI indicator is flattening after reaching overbought levels, while the MACD oscillator is holding near its trigger line in the positive territory, both hinting that the next potential move in prices could be weaker than before.
If the price extends its bullish bias and climbs above the 110.50 barrier, immediate resistance could be met at the 111.50 hurdle, which stands near the 50.0% Fibonacci mark. A jump above this significant zone could send prices towards the descending trend line of the downward sloping channel near 112.00.
On the flip side, should the market create a bearish correction of the sharp bullish rally, immediate support could be found near the 38.2% Fibonacci retracement level around the 110.00 handle of the downleg from 118.60 to 104.60. A significant leg below this area could drive prices towards the 20-day SMA which currently fluctuates near 109.35 before the market retests the 108.65 support.
In the bigger picture, the pair has been developing within a channel tilted slightly to the downside since December 2016 and is now turning its focus to the upside, trying to hit the upper boundary.
Further EURUSD Losses Expected Below 1.1800
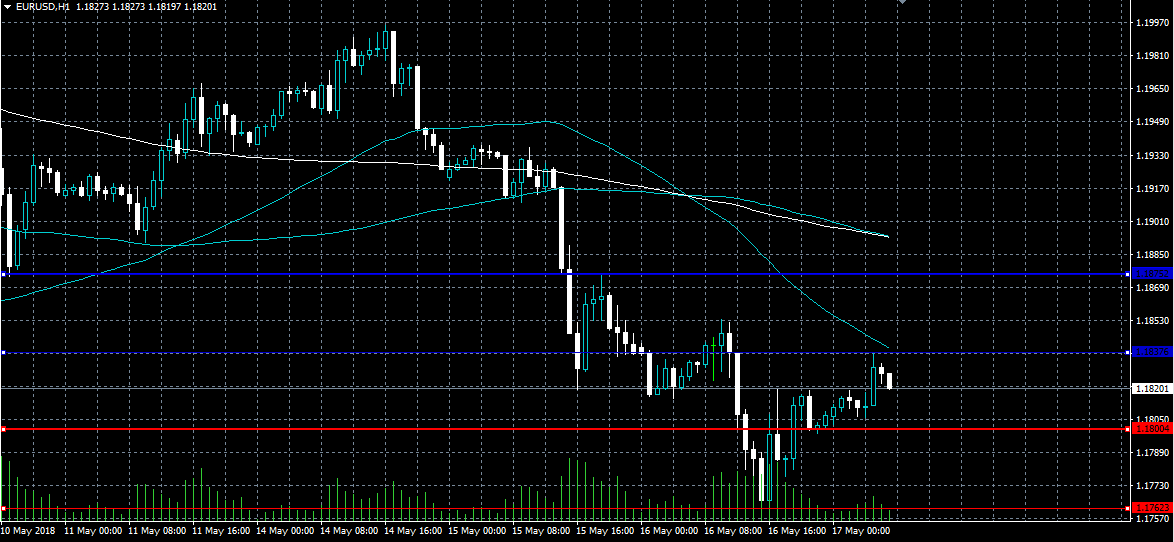
The euro has moved to its lowest trading level against the US dollar since December 2017, hitting 1.1762, as fears over Italian politics caused the single currency to weaken. The EURUSD pair currently trades around the 1.1820 level, after finding technical resistance from the 1.1837 level earlier today. Traders continue to watch the latest developments coming out of Italy, while also looking for further technical selling below the 1.1800 level.
The EURUSD pair is strongly bearish while trading below the 1.1800 level, further downside towards the 1.1762 and 1.1711 levels seems possible.
If the EURUSD pair moves above the 1.1837 level, we may see a technical correction back towards the 1.1875 resistance level.
GBPUSD Now Intraday Bullish Above 1.3500 Level
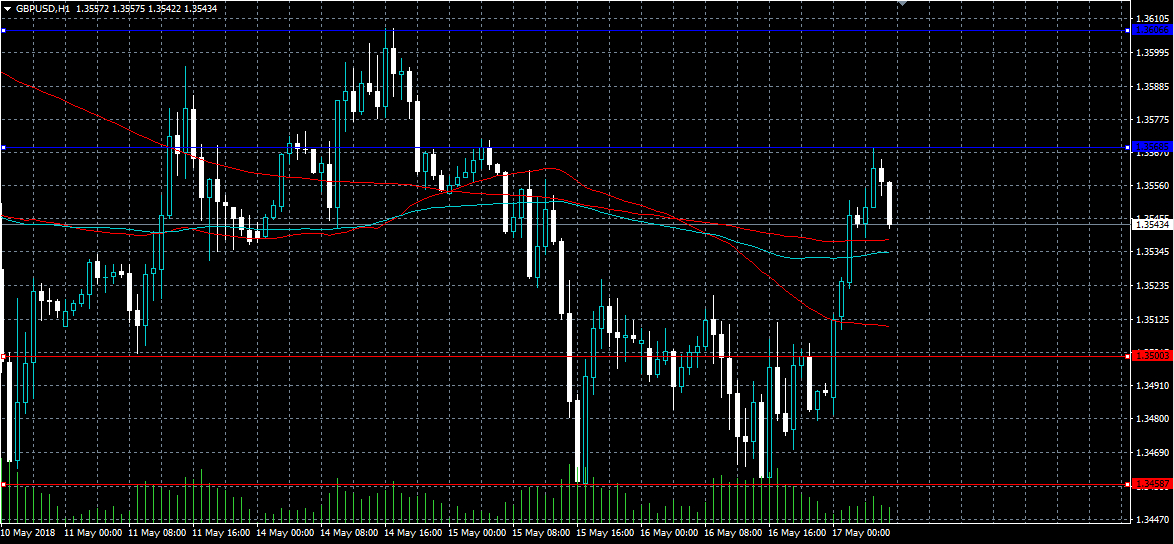
The British pound is attempting to move towards the top-end of its recent short-term trading-range against the US dollar, after sellers failed to hold price below the 1.3500 level. The GBPUSD pair currently trades around the 1.3540 level, after again finding strong dip-buying demand below the key 1.3500 level. Sterling traders continue to look for gains towards the 1.3600 resistance level, while watching the intraday direction of the US dollar index.
The GBPUSD pair is only intraday bearish while trading below the 1.3500 level. Key support remains at the 1.3458 and 1.3425 levels.
If the GBPUSD pair continues to hold above the 1.3500 level, buyers will again test towards the 1.3568 and 1.3606 resistance levels.
Bitcoin Struggles To Find Direction As Criticism And Competition Mounts
In December last year, the price of bitcoin reached almost $20,000. This capped a year when the cryptocurrency rose by more than a thousand percent. So far in 2018, the digital currency has faced multiple challenges that have seen its price drop below $6,000. The challenges have ranged from complex regulatory issues, to a sell-off right before the US tax season.
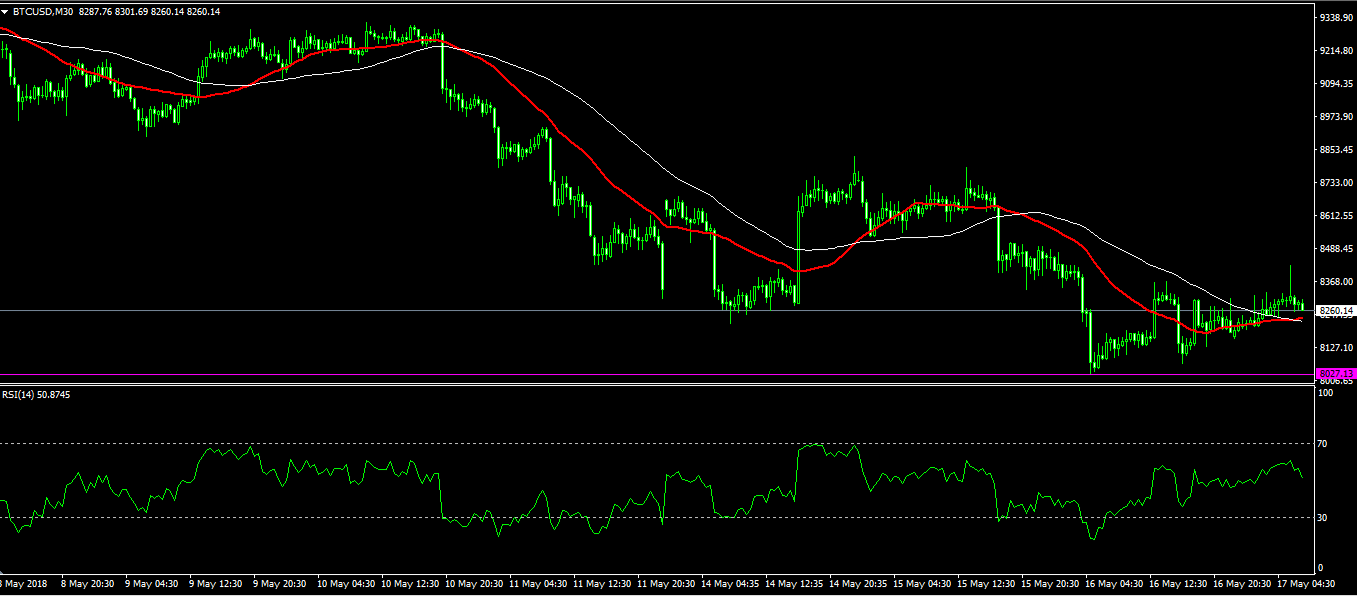
Yesterday, the price of bitcoin fell to $8027, the lowest level since mid-April. It is now trading at $8290. Comments made at the Consensus 2018 event contributed to this week’s decline.
Yesterday, Roger Ver – one of the earliest bitcoin investors often referred to as Bitcoin Jesus – said that users and developers around the world are turning to bitcoin cash rather than bitcoin core. He argued that bitcoin core was becoming slow, expensive and unreliable. Following his comments, bitcoin cash rose by more than 5% reaching $1,300.
Further crypto analysis came from Twitter CEO Jack Dorsey. The social media entrepreneur believes digital currencies to be the future of transactions with volatility being the only bottleneck. To solve this problem, Circle announced that it would be launching a cryptocurrency pegged on the dollar. This will remove the volatility that exists in bitcoin and other common cryptos.
Bitcoin started to drop on Monday last week when it reached a high of $9270. Since then, the BTC/USD has finished the downward Elliot Wave as shown below. There is a likelihood that the pair will make some gains and possibly test the important $8,500 level.
Policymakers In The Headlines On Thursday
A parade of central bank speeches will make headlines Thursday, giving investors the latest clues on the evolution of monetary policy. Economic data will also influence investor sentiment, with headline reports from the United States set to generate the most attention.
Action begins at 08:00 GMT with the release of Italian trade data. Rome's trade surplus is forecast to rise to €3.7 billion in March from €3.1 billion the month before.
One hour later, the European Union's statistical agency will report on Eurozone construction output for the month of March. The headline reading is forecast to show a 0.1% decline from February.
On the monetary policy front, European Central Bank (ECB) Vice President, Vitor Constancio, will deliver a speech at 10:30 GMT and 12:00 GMT.
Shifting gears to North America, the US Department of Labor will report on initial jobless claims at 12:30 GMT. The number of Americans filing for first-time unemployment benefits is projected to rise by 4,000 to 215,000 for the week ended 12 May.
Separately, the Federal Reserve Bank of Philadelphia will release its latest manufacturing survey. The May print is projected to show a slight cooldown to 21.0 from 23.2 in April.
North of the border, private payrolls data for Canada are also scheduled for release at 12:30 GMT. Later in the session, the Bank of Canada (BOC) will deliver its quarterly review, which provides a snapshot of important developments impacting the domestic economy.
Federal Open Market Committee (FOMC) members Neel Kashkari and Richard Kaplan are scheduled to deliver remarks Thursday afternoon. The Bank of England's Andrew Haldane is also expected to speak publicly, rounding out an active session for central bankers.
EUR/USD
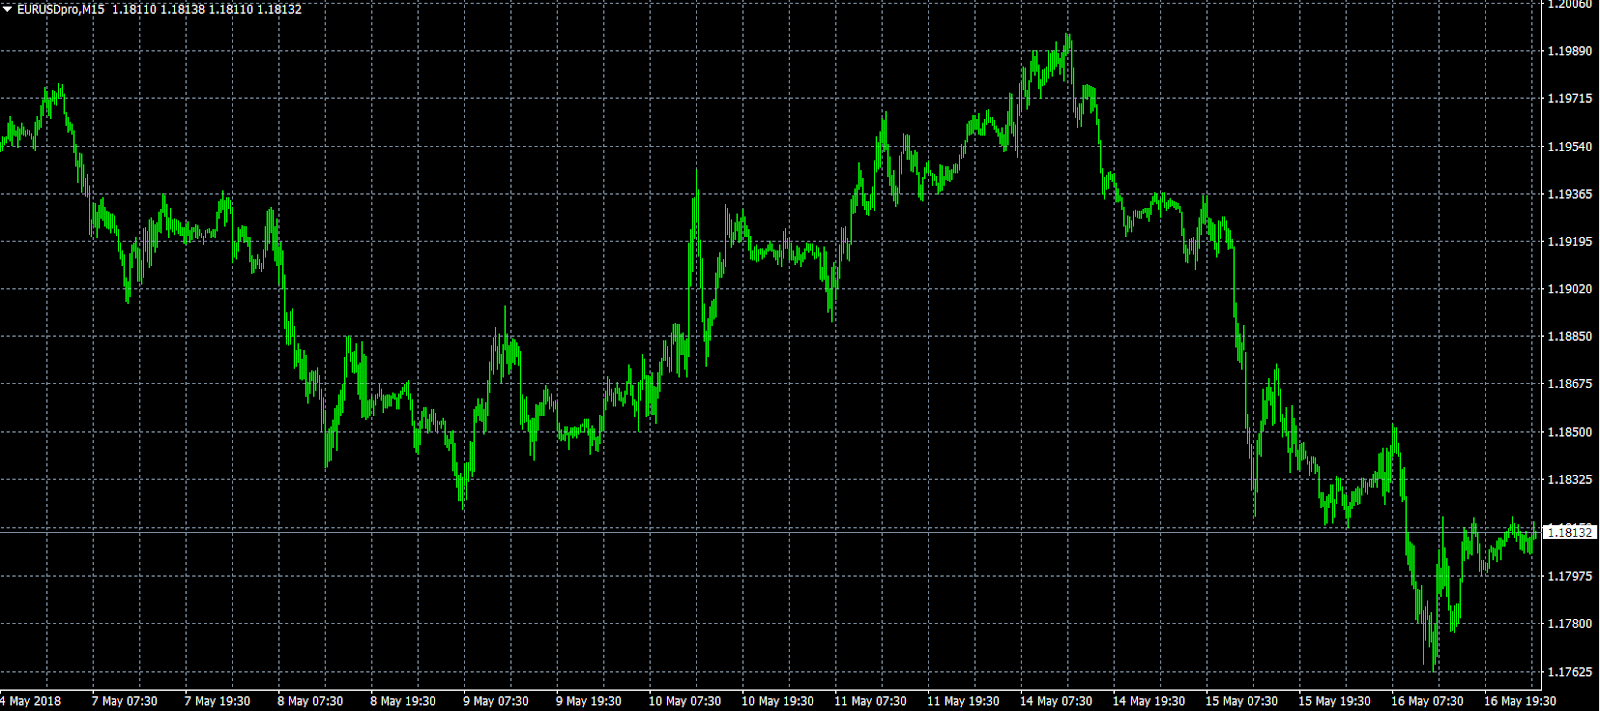
Europe's common currency bounced off its most recent swing low on Wednesday, with prices climbing back above 1.1800. At press time, EUR/USD was trading at 1.1813, where it was little changed from the previous close. The pair is likely to meet resistance at 1.1850. A breach above this level would likely expose the 1.1900 handle as the next target for the bulls.
AUD/USD
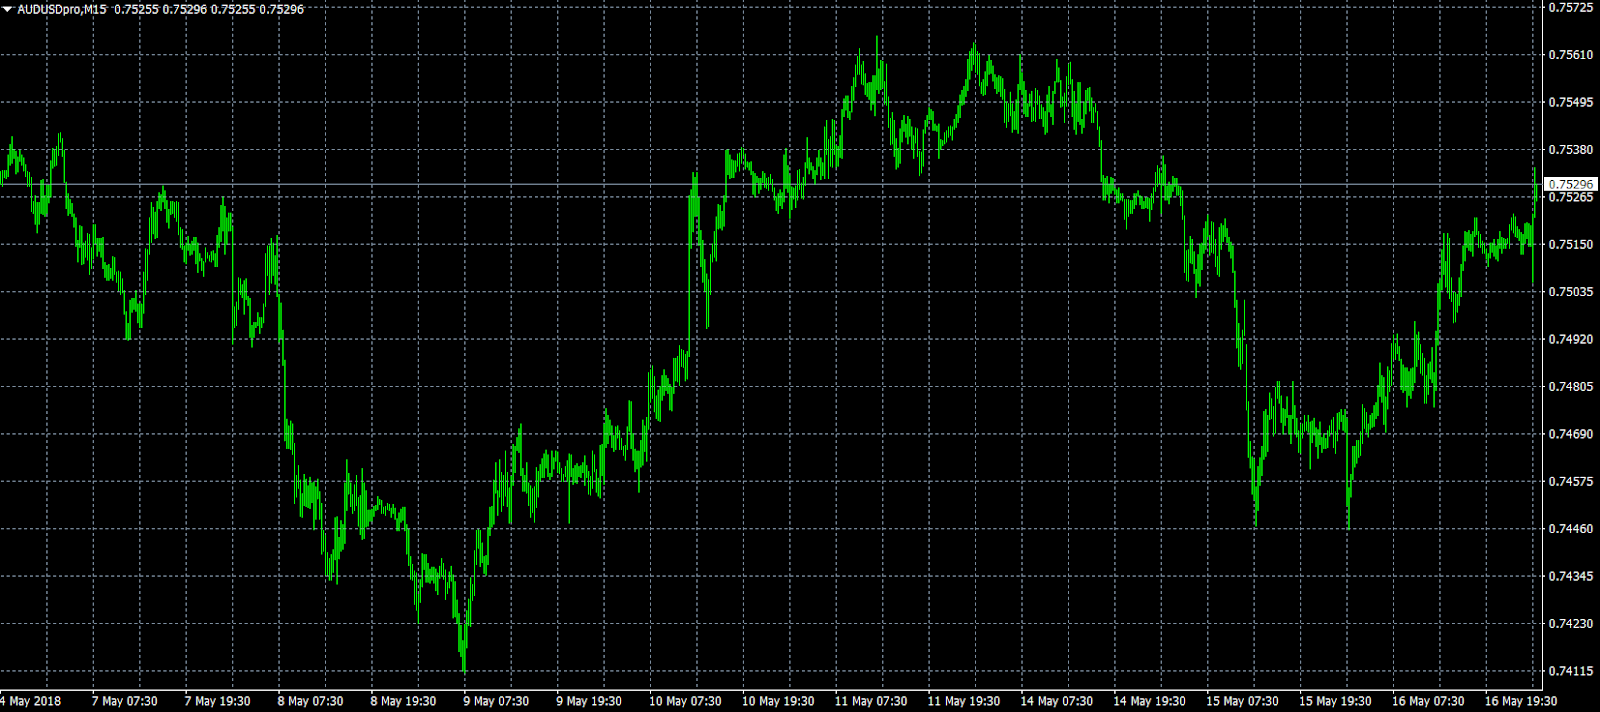
The Australian dollar traded higher on Thursday in the wake of better than expected employment data. Australian employers added 22,600 workers to payrolls in April, as workforce participation increased and unemployment ticked slightly higher. AUD/USD advanced 0.2% to 0.7529. The pair faces fierce resistance at 0.7565, which corresponds with the 38.2% Fibonacci retracement of the most recent decline.
USD/CAD
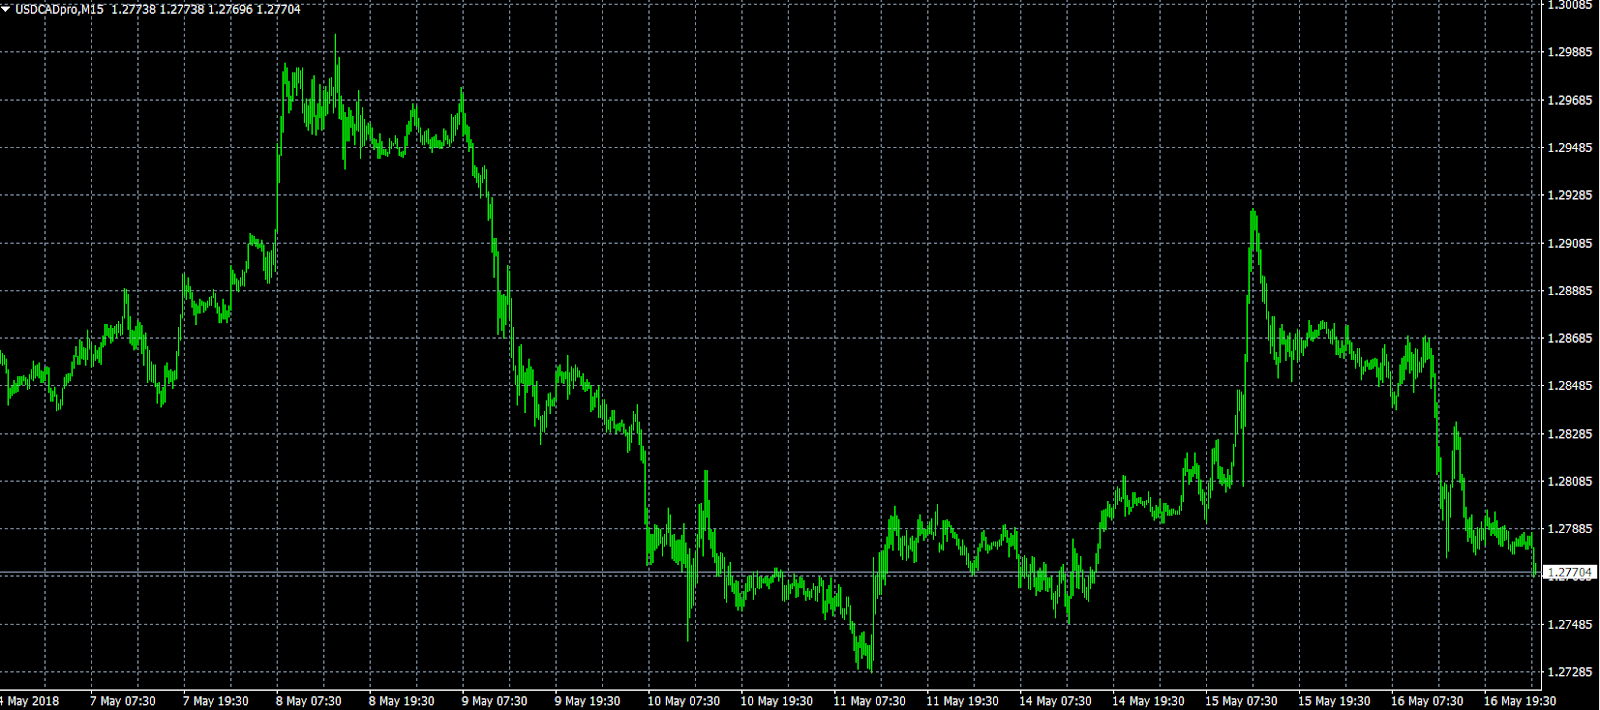
The Canadian dollar strengthened against its US counterpart on Wednesday, with the USD/CAD returning to familiar territory. The pair peaked near 1.3000 earlier this month and made another attempt at that level on Tuesday. Prices have since fallen back to the 1.2770 region with investors turning to economic data for direction.
USD/CAD Daily Outlook
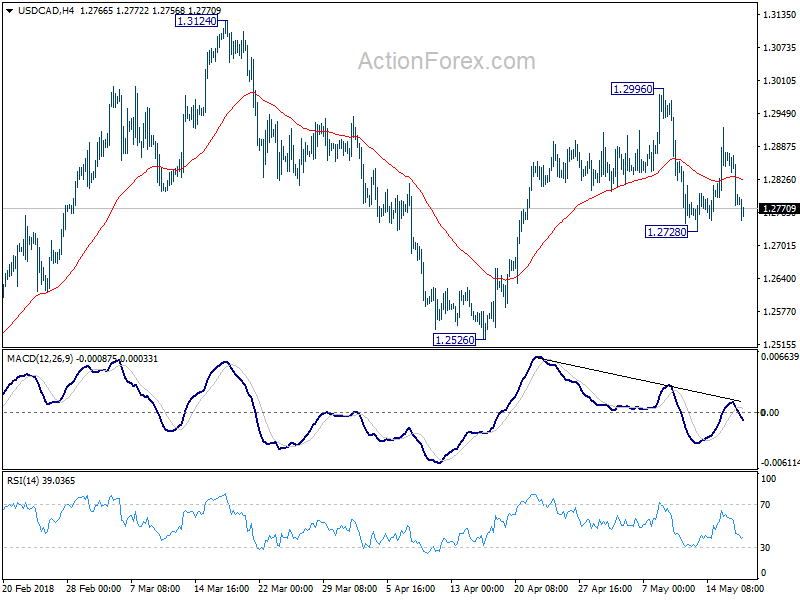
Daily Pivots: (S1) 1.2747; (P) 1.2816; (R1) 1.2861; More....
Intraday bias in USD/CAD is turned neutral again as rebound from 1.2728 failed well below 1.2996 resistance. For now, we're still favoring the bullish case that rise from 1.2061 is still in progress. However, above 1.2996 will affirm this year and target 1.3124 and above. However, break of 1.2728 will now dampen our bullish view and turn focus back to 1.2526 support instead.
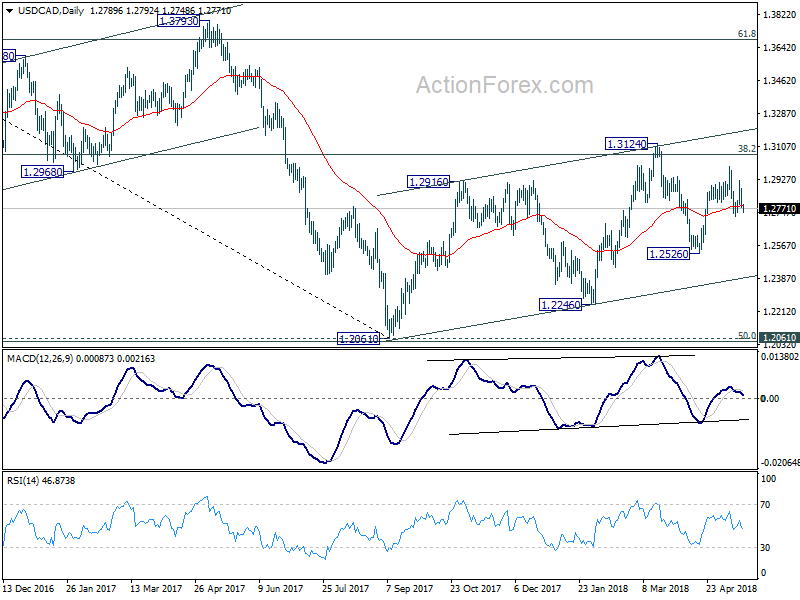
In the bigger picture, current development suggests that rebound from 1.2061 has not completed yet. Focus is back on 38.2% retracement of 1.4689 to 1.2061 at 1.3065. Sustained trading above there will confirm medium term bullish reversal. That is, down trend from 1.4689 has completed at 1.2061 already. In that case, next target will be 61.8% retracement at 1.3685. However, break of 1.2526 support will dampen this bullish view again. And, focus will be back on 1.2061 key support level, which is close to 50% retracement of 0.9406 (2011 low) to 1.4689 (2015 high) at 1.2048
US Treasuries Saw A Sell-Off As The 10Y Yield Climbed Some 2Bp
Market movers today
A very quiet day on the data front . The US initial jobless claims and Philadelphia Fed survey are the only data of interest . It will be interesting to see if the Philadelphia Fed mirrors the Empire index earlier this week and stays at solid levels.
Geopolitics continue to be in focus as US-China negotiations continue and some uncertainty has arisen over the meeting between North Korean leader Kim Jong-un and US President Donald Trump.
Norway is out for Constitution Day today.
Selected market news
Italy's 10Y government bond yields have been on the rise as markets see new political risk is rising in the country and the probability of a populist government is increasing. A flight to quality boosted demand for bunds, causing the biggest intraday widening in 10Y bond spread in a year and weighing further on the EUR.
The sentiment has dented both European and US assets on news that EUR250bn of Italian debt could be writ ten off. However, the speculations were denied by one of the parties, which is in process to establish a coalition. US Treasuries saw a sell-off as the 10Y yield climbed some 2bp.
North Korea threatened to cancel the upcoming summit between President Trump and Kim Jong-un planned for 12 June in Singapore. North Korea suspended talks with South Korea because of a joint military drill by South Korea and the US. Trump's reaction has been muted so far.
The EM FX two-day plunge stopped on the USD retreating from its highest levels YTD. The USD/TRY retreated from its record high yesterday after the Turkish central bank announced it could take necessary steps. Markets started expecting an emergency rate hike.
Scandi markets
In Sweden, Q1 housing starts and permits data are due to be published. We expect another negative quarter. Incorporated in our GDP estimate for Q1 (released on 30 May) is a 5% drop in residential investments between Q4 and Q1.
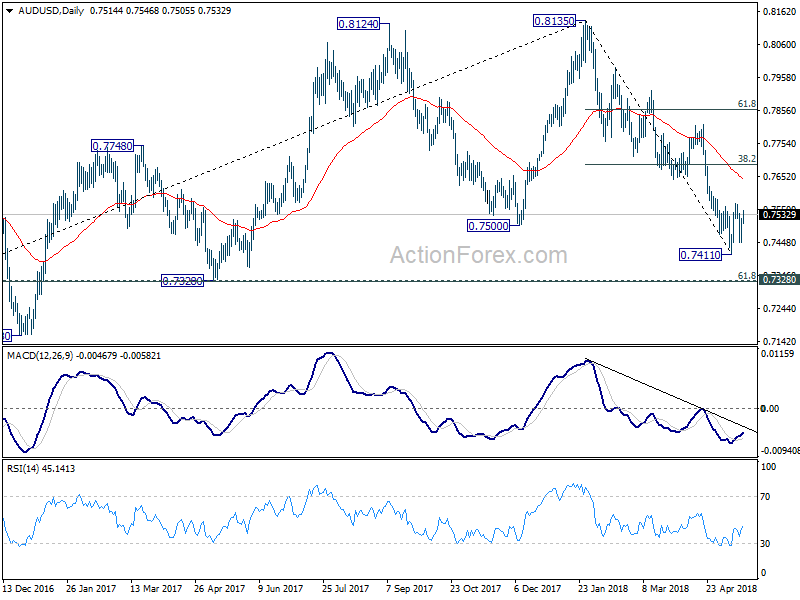
AUD/USD Daily Outlook
Daily Pivots: (S1) 0.7468; (P) 0.7495; (R1) 0.7543; More...
Intraday bias in AUD/USD remains neutral as consolidation from 0.7411 is extending. Above 0.7566 will bring stronger recovery. But upside should be limited by 38.2% retracement of 0.8135 to 0.7144 at 0.7688 to bring decline resumption. On the downside, break of 0.7411 will resume the fall from 0.8135 and target cluster support at 0.7328 (61.8% retracement of 0.6826 to 0.8135 at 0.7326).
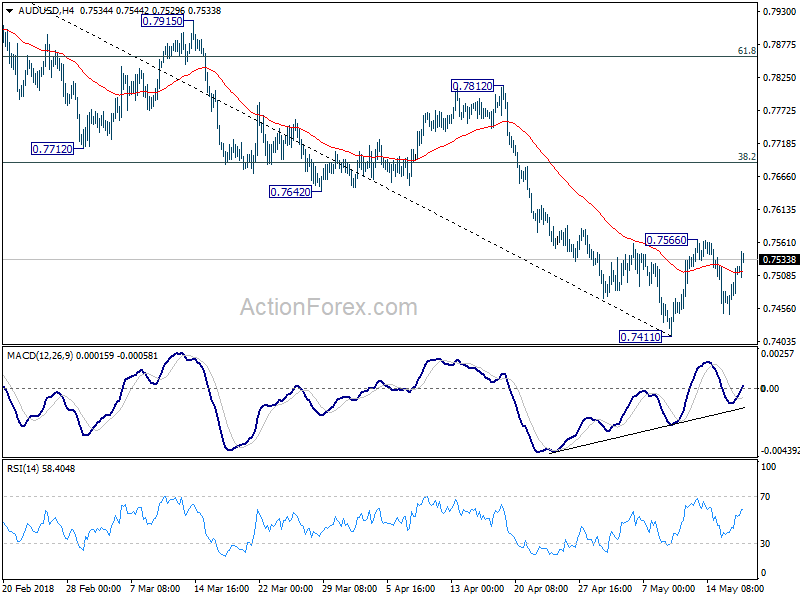
In the bigger picture, medium term rebound from 0.6826 is seen as a corrective move. Decisive break of 0.7500 key support suggests that such correction is completed at 0.8135. Deeper decline would be seen back to retest 0.6826 low. In case of another rise, we'd expect strong resistance from 38.2% retracement of 1.1079 to 0.6826 at 0.8451 to limit upside to bring long term down trend resumption eventually.
USD/JPY Daily Outlook
Daily Pivots: (S1) 110.16; (P) 110.28; (R1) 110.54; More...
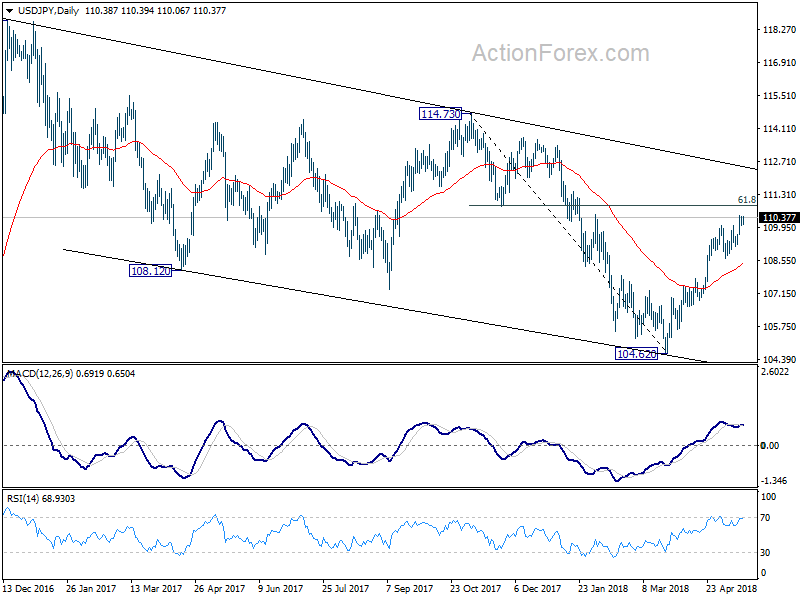
Intraday bias in USD/JPY remains on the upside at this point. Current rally from 104.62 is still in progress and should target 61.8% retracement of 114.73 to 104.62 at 110.86 next. Firm break there will target medium term trend line resistance at 112.43. On the downside, below 109.14 support is needed to indicate short term topping. Otherwise, outlook will remain bullish in case of retreat.
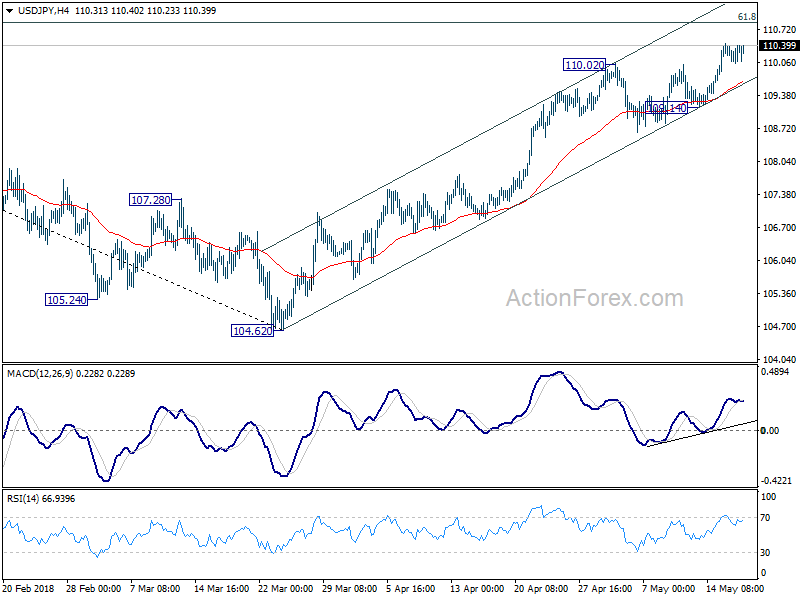
In the bigger picture, corrective decline from 118.65 (2016 high) has completed with three waves down to 104.62. Rise from 104.62 is possibly resuming the up trend from 98.97 (2016 low). This will be the preferred case as long as 55 day EMA (now at 108.30) holds. Decisive break of 114.73 resistance will confirm our view and target 118.65 and above.