Sample Category Title
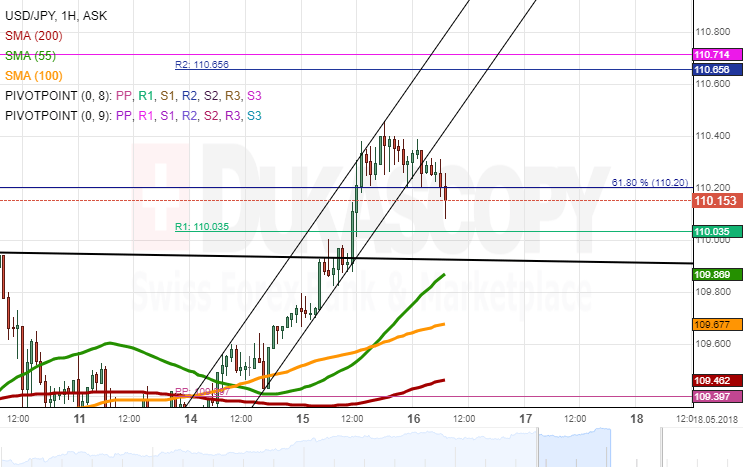
USD/JPY Analysis: Consolidates Near 110.40
The US Dollar managed to maintain its upside momentum on Tuesday, thus gaining 0.55% against the Japanese Yen. As a result, the pair was trading near the 110.40 mark on Wednesday morning where the 61.80% Fibonacci retracement is located.
Technical indicators are gradually starting to edge lower; thus, it is likely that the price follows soon. The nearest support is set by the upper boundary of the breached wedge pattern at 109.90, while a more important support area is 109.60/40 due to the 100– and 200-hour SMAs.
Meanwhile, a significant resistance barrier is the weekly R2 and the monthly R1 at 110.70. Even if the pair still manages to appreciate during the first part of the day, this level is unlikely to be surpassed.
GBP/USD Analysis: Faces Strong Resistance At 1.3550
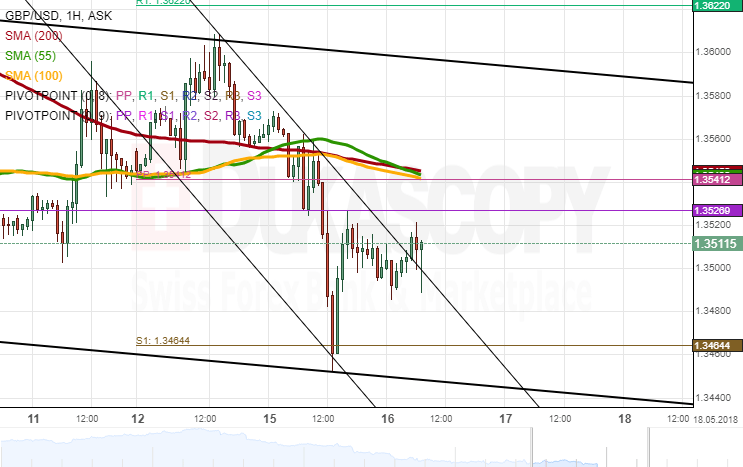
Bearish momentum prevailed during the first part of Tuesday, thus sending the Sterling 112 pips lower against the Greenback. The pair subsequently recovered some lost positions but nevertheless had failed to surpass the 1.3517 mark by Wednesday morning.
It seems that GBP/USD should continue moving higher in this session. However, large gains are unlikely to occur, as traders might be reluctant to push the pair above the strong resistance of the 55-, 100– and 200-hour SMAs at 1.3550. The 55-period SMA (on 4H time-frame) is likewise located at this level.
This factors is likely to activate bears for another decline. Technical indicators are also flashing bearish signals. The nearest support is set by the weekly S1 and a channel line at 1.3465 and 1.3450, respectively.
EUR/USD Analysis: Could Still Approach 2018 Low
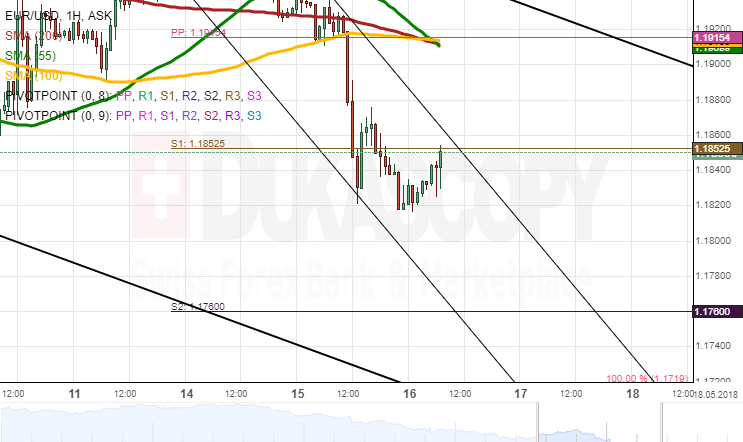
Following a breakout of the 55-, 100– and 200-hour SMAs early on Tuesday, downside risks prevailed and thus pushed the EUR/USD exchange rate down to the weekly S1 at 1.1840. Its subsequent movement was sideways.
The pair is gradually moving towards the bottom boundary of a five-week channel down. This line is likewise located near the 2018 low of 1.1720. It is likely that the pair still edges lower in this session, possibly down to the weekly S2 at 1.1760; however, the aforementioned yearly low should not be surpassed.
By and large, the rate's movement should nevertheless be tended northwards during the following week. In case this bullish reversal occurs today, the pair should remain below the 1.19 mark, as it is guarded by all three SMAs.
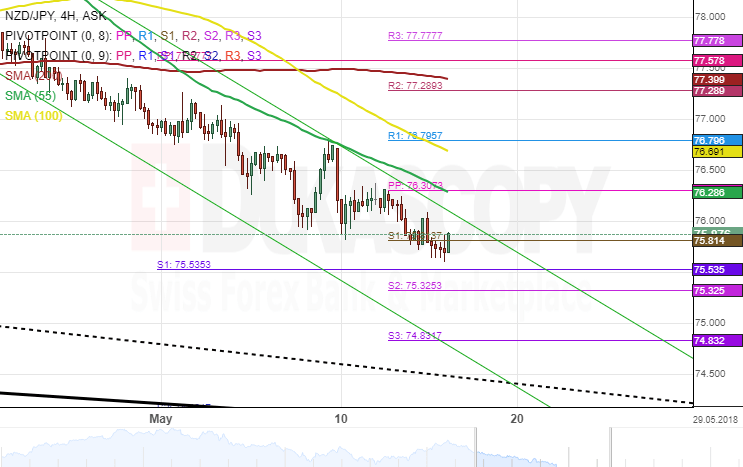
NZD/JPY 4H Chart: Junior Pattern Prevails
The Pound Sterling has been constrained by several descending channels against the Japanese Yen. The most important of which is the junior pattern which was formed on April 13.
During the past few weeks, the exchange rate has been pressurized south by the 55– hour simple moving average. Furthermore, the weekly pivot point at 76.30 was restricting the pair from making an upward move.
Technical indicators demonstrate that the currency exchange rate could continue to decline during the following trading session. However, a brief corrective move north is likely to take place in the short-term.
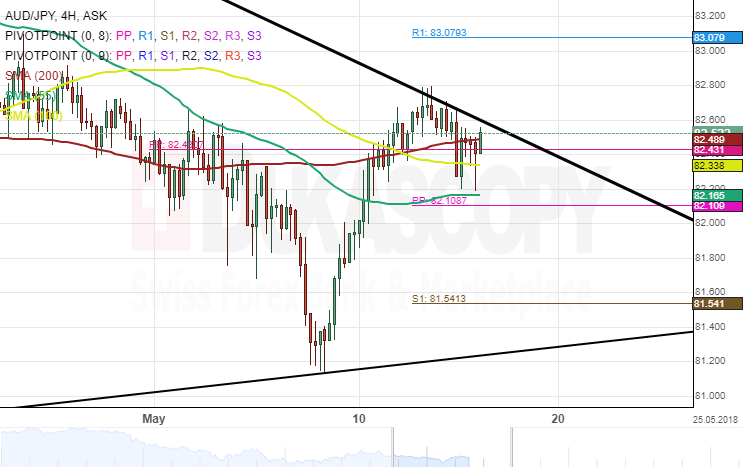
AUD/JPY 4H Chart: Stranded Between SMAs
The Australian Dollar has been trading in a triangle-like formation during the past months. The currency pair tested the upper boundary of the aforementioned triangle pattern on May 14.
The exchange rate has moved closer to the up border of the downtrend line and a breakout could be expected within this session. Meanwhile, the rate was stranded between SMAs at the time of this analysis.
Everything being equal, the AUD/JPY currency exchange rate is likely to continue to gain strength during the following trading sessions. Nevertheless, technical indicators suggest a different scenario. On the weekly time-frame, it flashes strong sell signals.
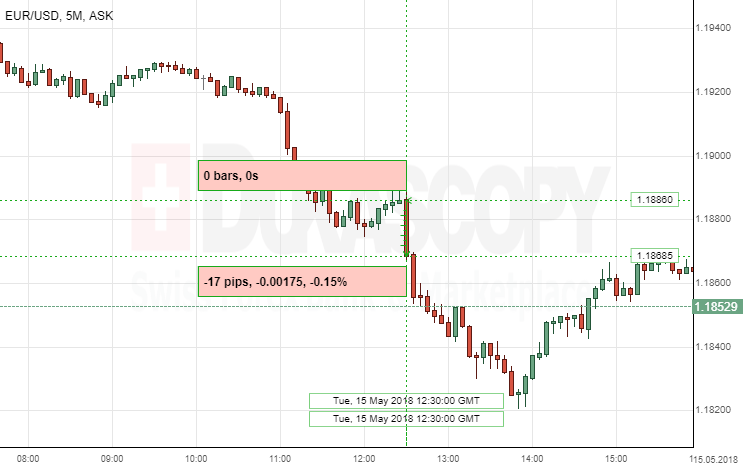
EUR/USD: US Retail Sales
The Greenback strengthened against the Eurozone's single currency, following controversial US Retail Sales data release on Tuesday. The EUR/USD currency pair lost 17 pips, or 0.15%, and continued to go downwards, thus strengthening US dollar even more.
The Census Bureau released two datasets simultaneously, where Advance Retail Sales for the month of April came out lower-than-expected of 0.3%, compared to 0.6% in the previous period. Moreover, Core Retail Sales too came out to be short of expectations of 0.3%, compared to 0.2% in the previous month.
"Looking ahead, the consumer faces the added burden of higher gasoline prices," said Michael Feroli, an economist at JPMorgan in New York.
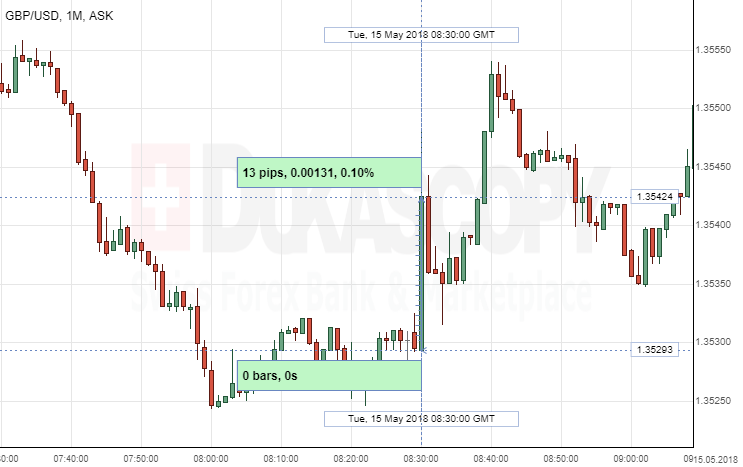
GBP/USD: UK Claimant Count Change
The British Pound strengthened against the Greenback, following controversial UK Claimant Count Change data release on Tuesday. The GBP/USD currency pair gained 13 pips, or 0.10%, to continue going up to the 1.3555 level.
The Office for National Statistics released three datasets simultaneously, where Jobless Claims trippled from the forecast of 31.2K, compared to the 11.6K in the previous period.
Average Earnings Index came out lower-than-expected of 2.6%, compared to 2.8% in the previous period however, Unemployment Rate stayed in line with a forecast of 4.2%.
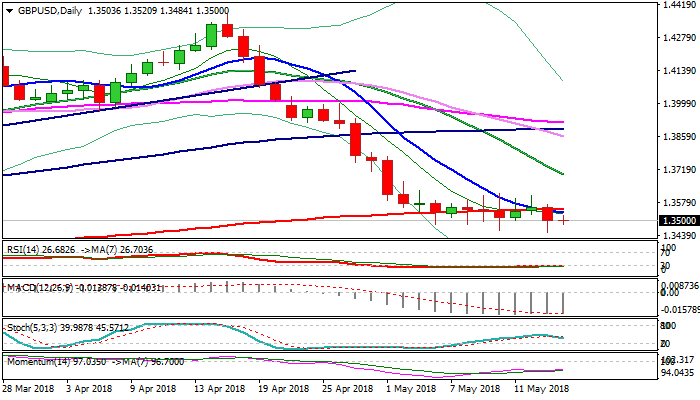
GBPUSD Stands At The Back Foot But Clear Break Through Key 1.3460 Support Needed For Stronger Bearish Signal
Cable holds within narrow range in early Wednesday's trading with near-term structure being negatively aligned following Tuesday's close in red and brief probe through key support at 1.3460. Overall weak UK jobs data released on Tuesday, weighed on sterling along with formation of 10/200SMA death-cross, but firm break below 1.3460 (congestion floor) is needed to signal bearish continuation and expose next pivotal support at 1.3442 (Fibo 38.2% of 1.1930/1.4376 post-Brexit recovery). Strong barriers at 1.3450 zone (base of thick 4-hr cloud / 200SMA) are expected to cap and maintain bearish bias.
Res: 1.3520, 1.3545, 1.3550, 1.3571
Sup: 1.3484, 1.3460, 1.3442, 1.3400
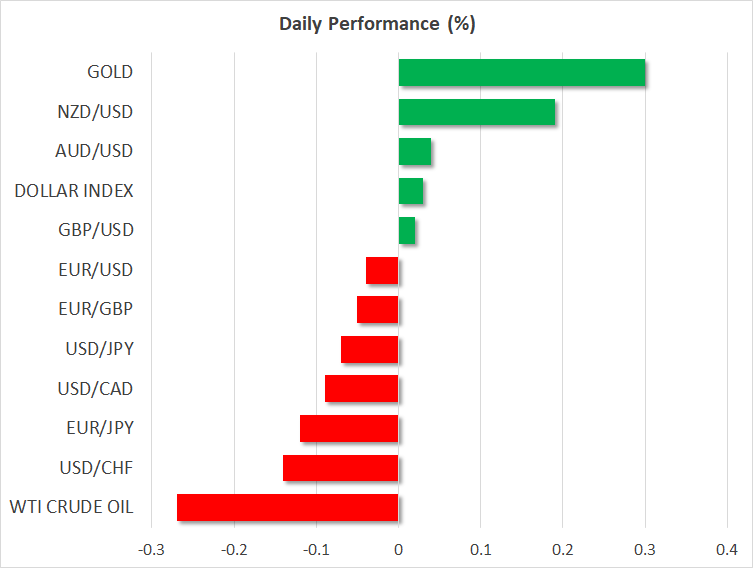
Dollar Rally Gets A Second Wind, Buoyed By Rising Treasury Yields
Here are the latest developments in global markets:
FOREX: The US dollar index is higher on Wednesday but by less than 0.1%, extending the notable gains it posted yesterday, when it advanced against all major currencies. Solid US retail sales data pushed the yields of longer-term US bonds to fresh multi-year highs, breathing a second wind into the dollar's latest rally.
STOCKS: Major US indices tumbled yesterday, as the renewed rise in US yields sapped demand for stocks. Rising borrowing costs could hinder the ability of some of these companies to buy back their own stocks and refinance their old debt, thereby squeezing profits. The Nasdaq Composite led the way down, declining by 0.81%, while the Dow Jones and the S&P 500 followed in its tracks, closing lower by 0.78% and 0.68% respectively. Futures tracking the Dow, S&P, and Nasdaq 100 are currently in positive territory, albeit only marginally so. Asia did not escape unscathed either, with most indices being in the red today. Japan's Nikkei 225 and Topix fell by 0.44% and 0.27% correspondingly, while the Hang Seng in Hong Kong declined 0.36%. In Europe, futures following most major benchmarks are close to neutral territory, with the exception being the Italian FTSE MIB, which is expected to open around 0.6% lower.
COMMODITIES: Oil prices are lower today, with WTI and Brent falling by nearly 0.3% each. Both benchmarks touched fresh multi-year highs yesterday, before the surge in the US dollar curbed demand for the dollar-denominated liquid, leading to a pullback in prices. Today, attention will turn to the official EIA crude inventory figures at 1430 GMT, with any major moves in the dollar also having the capacity to impact the precious liquid. In precious metals, gold prices are 0.3% higher today, recovering some of the remarkable losses they recorded yesterday on the back of an appreciating US currency. The yellow metal broke below both its 200-day moving average and the psychological $1,300 zone, recording a fresh low for 2018 and turning the short-term technical outlook to negative.
Major movers: Dollar marches higher after retail sales, supported by rising yields
The US dollar index got its cue from the bond market yesterday, and surged in tandem with US Treasury yields, to reach a fresh five-month high. Yields on 10-year US bonds climbed to 3.09% – a high last seen in 2011 – before pulling back to 3.06%, increasing the appeal of the US currency. Interestingly, while the relationship between the dollar and longer-term US yields had faded in late-2017 and early-2018, that correlation seems to have returned in the second quarter of 2018.
Most of the dollar's gains came after US retail sales for April were released. Although the core figure was a touch softer than expected, last month's prints were revised higher, painting an overall upbeat picture for consumer spending. Euro/dollar and pound/dollar touched fresh five-month lows, while dollar/yen managed to power through the elusive 110.00 territory, recording a near four-month high.
On another interesting note, markets are becoming slightly more confident in the Fed delivering three more rate increases this year. Two more 25bps rate hikes are already fully priced in, and the probability for a third one climbed to 36% according to the Fed funds futures, up from roughly 20% last week.
In Japan, GDP data released overnight showed the economy surprisingly contracted in Q1, ending a two-year streak of positive growth readings. Nonetheless, the yen barely noticed, and is even higher against the dollar and euro today.
In emerging markets, the Turkish lira continued to plummet yesterday, touching fresh all-time lows against both the dollar and euro. The latest leg lower came after Turkish President Erdogan suggested he would take greater control of monetary policy should he win the upcoming election. His remarks cast fresh doubts on the central bank's independence, as well as on its ability to raise interest rates as much as needed in order to rein in double-digit inflation.
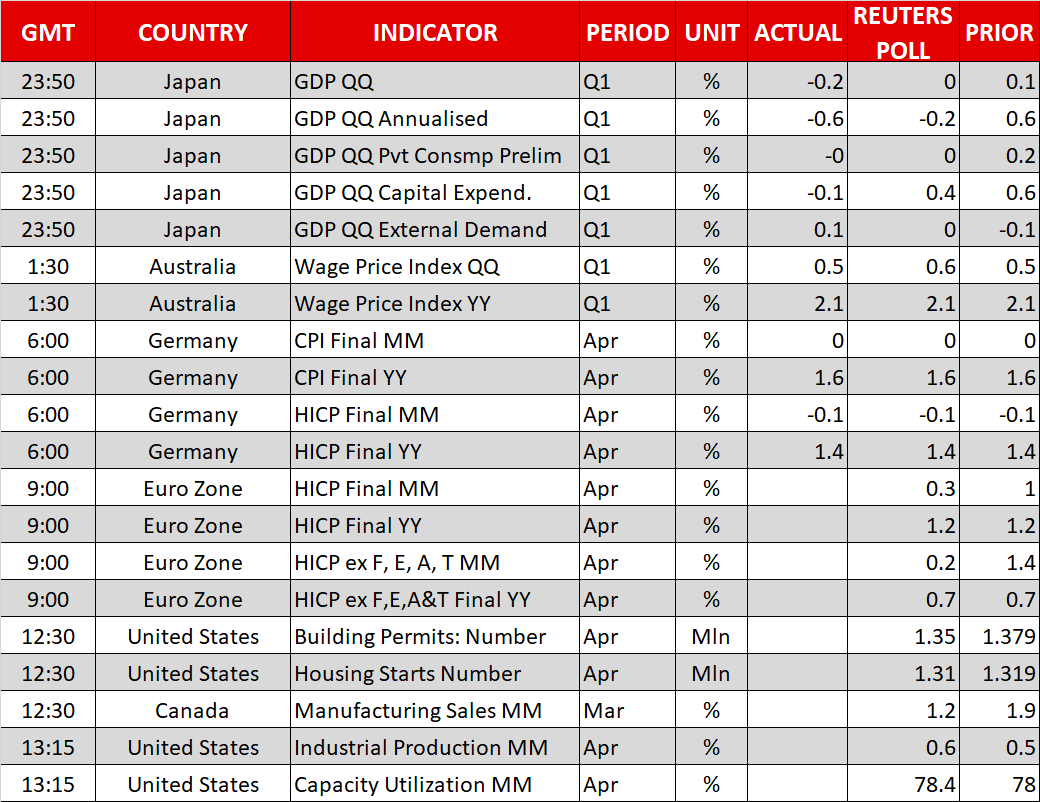
Day ahead: Eurozone inflation, US housing starts & industrial production on the agenda
Wednesday's calendar features the release of inflation numbers out of the eurozone, as well as US housing starts & industrial production figures.
Final inflation figures out of the eurozone for the month of April will be made public at 0900 GMT. Headline inflation, as gauged by the Harmonised Index of Consumer Prices (HICP) that uses a common methodology across EU countries, is anticipated to have grown by 0.3% m/m and 1.2% y/y, confirming the slowdown relative to March's readings that was reflected in the preliminary release. For perspective, the ECB's target for annual inflation is below but close to 2%. The measure of inflation that excludes food, energy, alcohol and tobacco will also be monitored.
The attention will next turn to the US which will see the release of data on April's housing starts and the number of building permits for the same month at 1230 GMT. Housing starts are projected to have fallen by 1.1%, following a rise by 1.9% in March.
Canadian manufacturing sales for March are also scheduled for release at 1230 GMT.
Another important data point out of the US is the one pertaining to April industrial production figures, due at 1315 GMT. Industrial output is expected to have expanded by 0.6% m/m, a higher pace relative to March's 0.5%. Manufacturing output, a subset of industrial production, will also be closely monitored, while data on capacity utilization will be released at the same time as well.
Of interest to oil traders will be EIA weekly data on US crude inventories. Crude stockpiles are projected to decline by around 0.8 million barrels during the week ending May 11, recording their second straight weekly drawdown. That said, the private API data released overnight missed their forecast for a similar drawdown and instead posted a notable build, suggesting that investors may take the forecast for today's figures with a pinch of salt.
Cisco is one of the companies releasing quarterly results today; the firm will be reporting after the US market close.
Numerous ECB policymakers, including President Mario Draghi (1200 GMT), will be speaking at a conference in honor of departing ECB Vice President Vitor Constancio. Meanwhile, Atlanta Fed President Raphael Bostic will be talking about the US economy at 1230 GMT, and Bank of Canada Deputy Governor Lawrence Schembri is scheduled to give a speech at 1415 GMT.
In geopolitics, North Korea decided to suspend talks with South Korea in response to common military drills between the US and South Korea. It will be interesting to see how this plays out and the extent it will affect the planned June summit where Kim Jong Un and Trump are expected to meet.
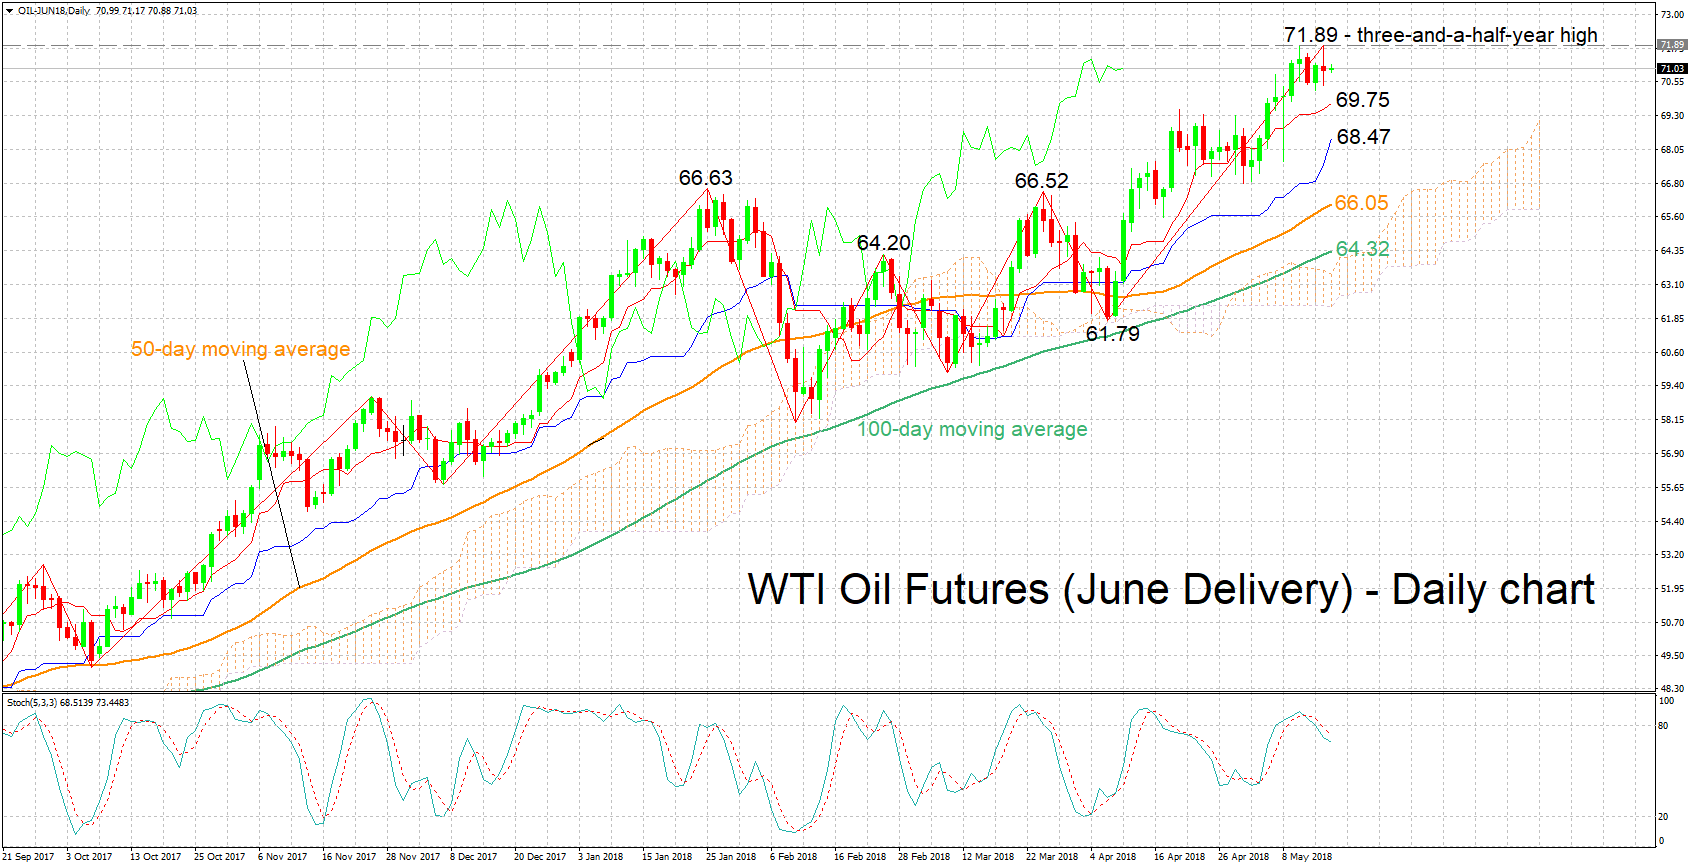
Technical Analysis: WTI oil futures close to 3½-year high; bearish signal by stochastics in very short-term
WTI oil futures for June delivery are trading not far below the three-and-a-half-year high of 71.89 hit yesterday. The Tenkan- and Kijun-sen lines remain positively aligned in support of a bullish picture in the short-term. The stochastics, however, are giving a bearish signal in the very short-term: the %K line has moved below the slow %D one and both lines are heading lower.
If today's EIA report shows a larger-than-anticipated drawdown in crude inventories, then prices could move higher. Resistance to advances might come around yesterday's three-and-a-half-year high of 71.89, including the 72 round mark. An upside break may meet an additional barrier around the 73 handle.
On the downside and in case of a smaller-than-expected drawdown in crude stocks (or a buildup), support could come around the current levels of the Tenkan- and Kijun-sen lines at 69.75 (including the 70 handle) and 68.47 respectively, given that the region around the 71 handle, which seems to be providing immediate support, is violated first.
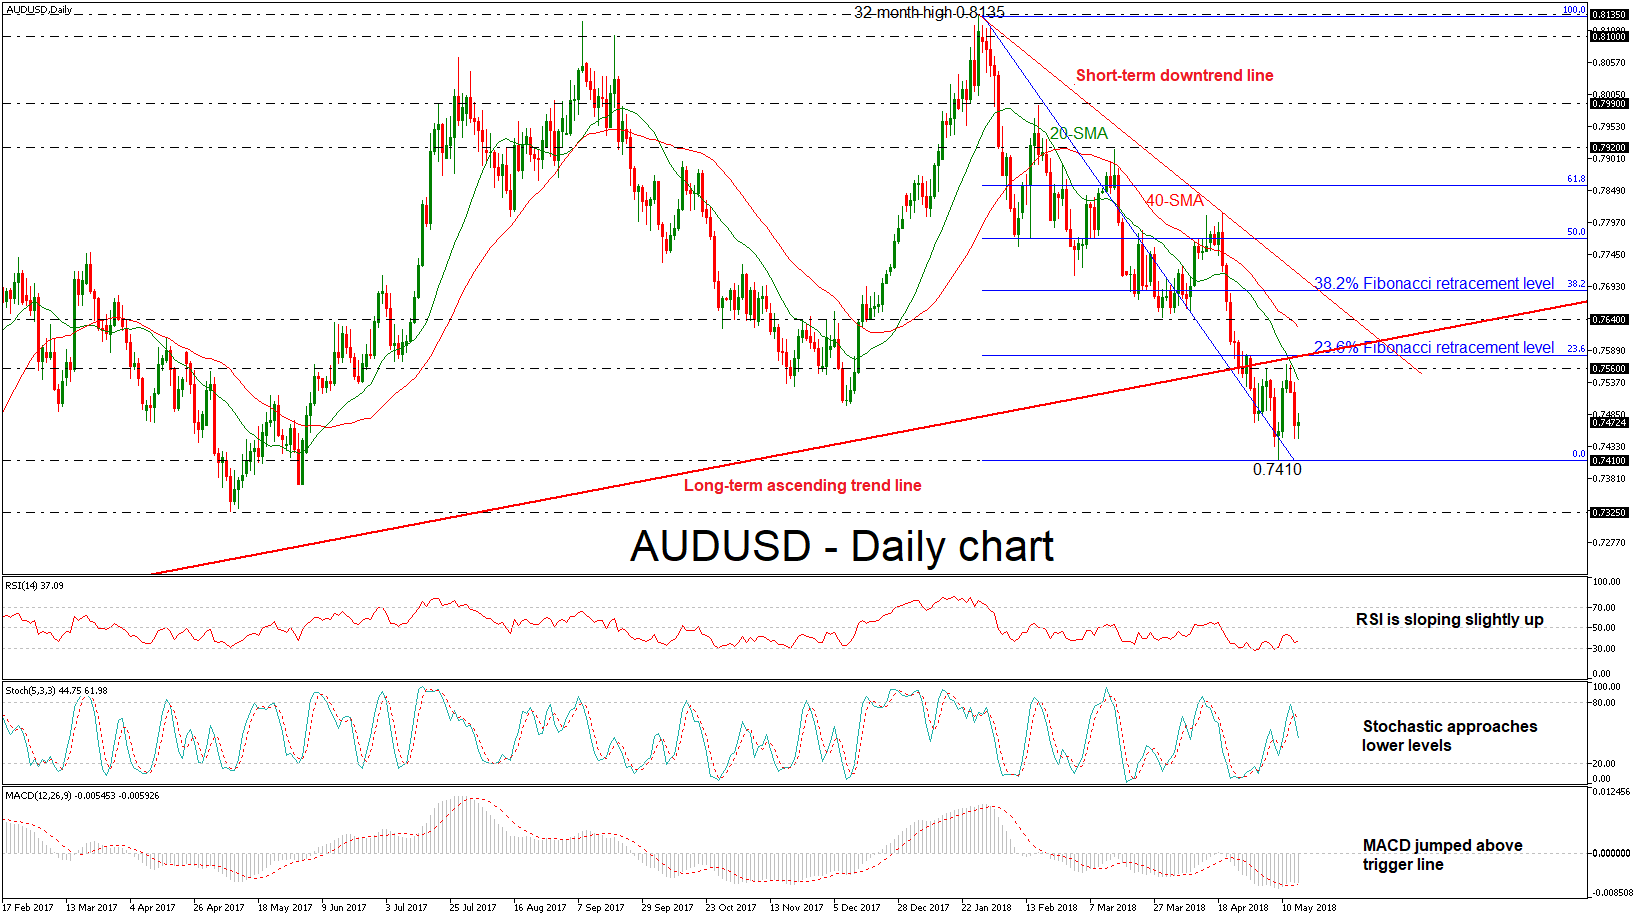
AUDUSD Continues Bearish Correction In Near Term, Holds Below 0.7800
AUDUSD has reversed back down again after finding resistance at the 0.7560 barrier, achieved on Monday and holds below the 0.7800 handle. The pair completed two consecutive bearish days and remains below the 20- and 40-simple moving averages (SMAs) in the daily timeframe. However, Wednesday’s trading session started in positive territory.
In the short-term, the momentum indicators seem to be in confusion. The RSI indicator is pointing slightly north, while is holding in negative. Also, the MACD oscillator climbed above the trigger line with weak momentum. But, the stochastic oscillator created a bearish cross below the oversold levels and is moving lower.
In case of further losses, the 0.7410 support level should act as a major support. A drop below this area would reinforce the bearish structure and open the way towards the next key support level of 0.7325, identified by the May 2017 low.
In the event of an upside reversal, the 0.7560 and the 23.6% Fibonacci retracement level of 0.7580 of the downleg from 0.8135 to 0.7410 could act as a significant resistance zone. A continuation of the bullish bias would shift the medium-term outlook to a more neutral one as it would take the pair towards the 0.7640 barrier, which holds near the 40-SMA and next until the 38.2% Fibonacci of 0.7685.
Overall, for a resumption of the longer-term uptrend, which was halted in April, AUDUSD would need to climb back above the ascending trend line and beat the 32-month peak of 0.8135, creating a new multi-month high.