Sample Category Title
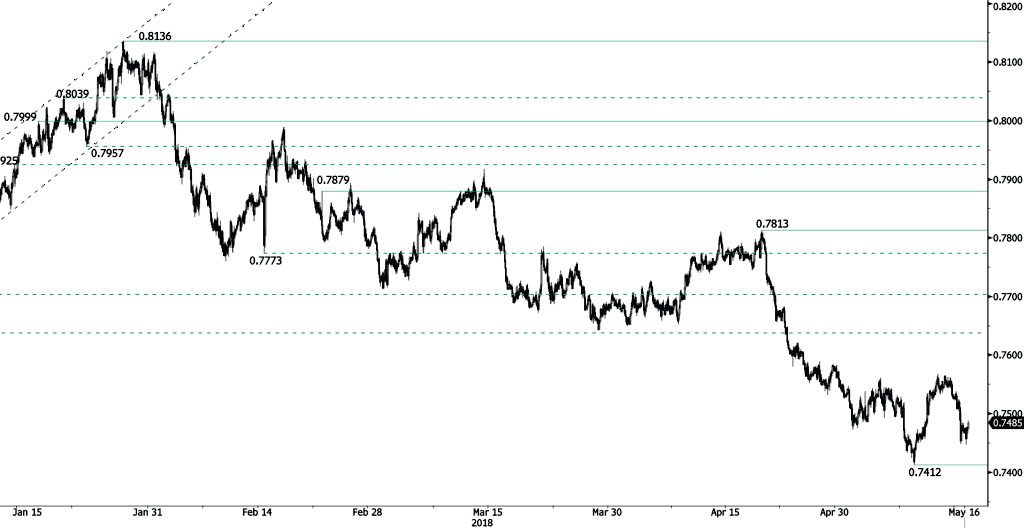
AUD/USD Bouncing Higher
AUD/USD is bouncing off from 0.7447, heading along the 0.7490 range. Hourly support and resistance remain at 0.7412 (09/05/2018 low) and 0.7813 (19/04/2018 high). The technical structure suggests short-term increase.
In the long-term, the upward trend slows down after failing to reach key resistance at 0.8164 (14/05/2015 low). Key support stands at 0.6009 (31/10/2008 low). A break of the key resistance at 0.8164 (14/05/2015 high) is needed to invalidate our long-term bearish view.
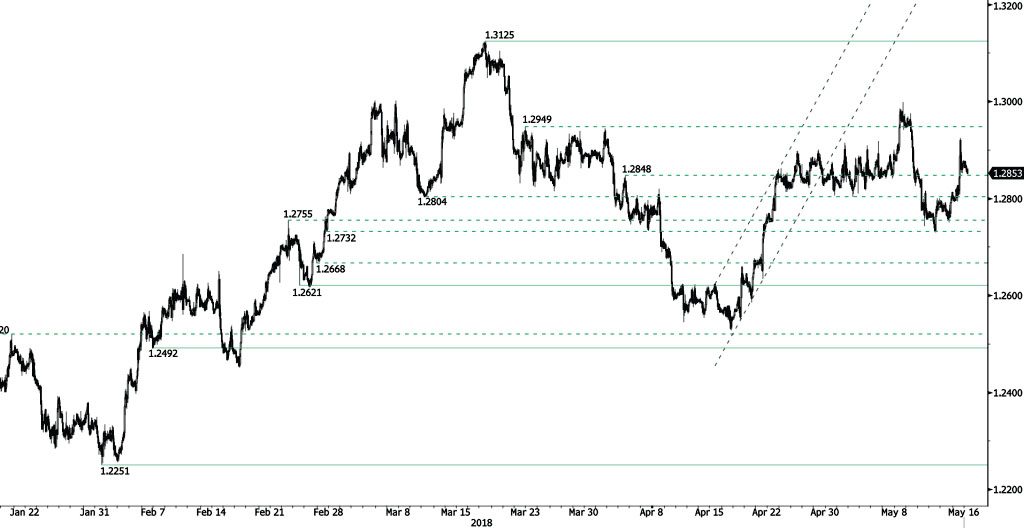
USD/CAD Decreasing
USD/CAD is decreasing after reaching 1.2925 (15/05/2018 high), heading along 1.2845. Hourly support and resistance are given at 1.2621 (23/02/2018 low) and 1.3125 (19/03/2018 high). The technical structure suggests short-term downward moves.
In the longer term, the pair is trading between resistance point at 1.3805 (05/05/2017 high) and support at 1.2128 (18/06/2015 low). Strong resistance is given at 1.4690 (22/01/2016 high). The pair is likely to head lower. The pair is trading above its 200 DMA
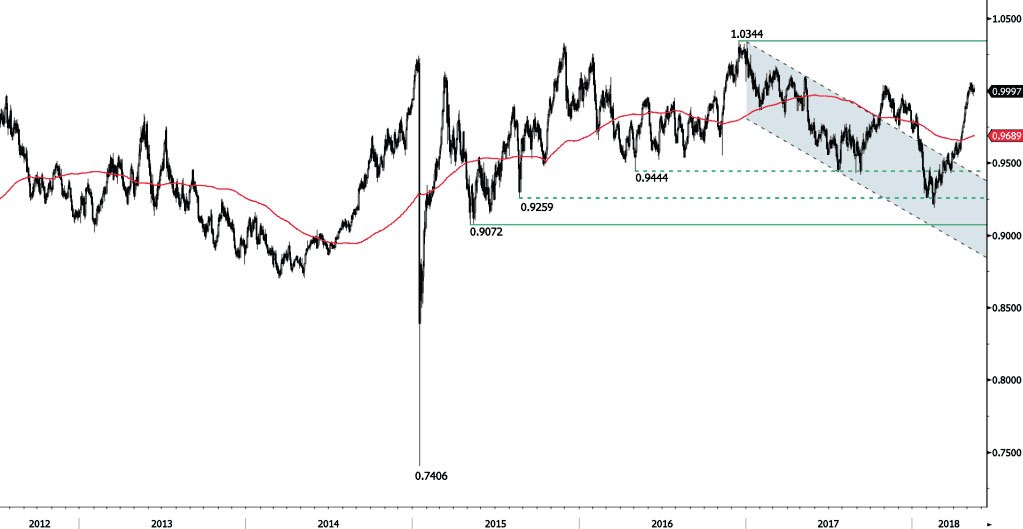
USD/CHF Bearish Pressures
USD/CHF is decreasing after reaching the pair, heading along 0.9990. Hourly support and resistance given at 0.9755 (10/01/2018 low) and 1.0091 (09/05/2017 high) are maintained. The technical structure suggests further short-term downward moves.
In the long-term, the pair is still trading in range since 2011 despite some turmoil when the SNB unpegged the CHF. Key support lies at 0.9072 (07/05/2015 low) while resistance at 1.0344 (15/12/2016 high) is distanced. The technical structure favours a long term bullish bias since the unpeg in January 2015.
EUR/CHF Daily Outlook
Daily Pivots: (S1) 1.1819; (P) 1.1883; (R1) 1.1917; More...
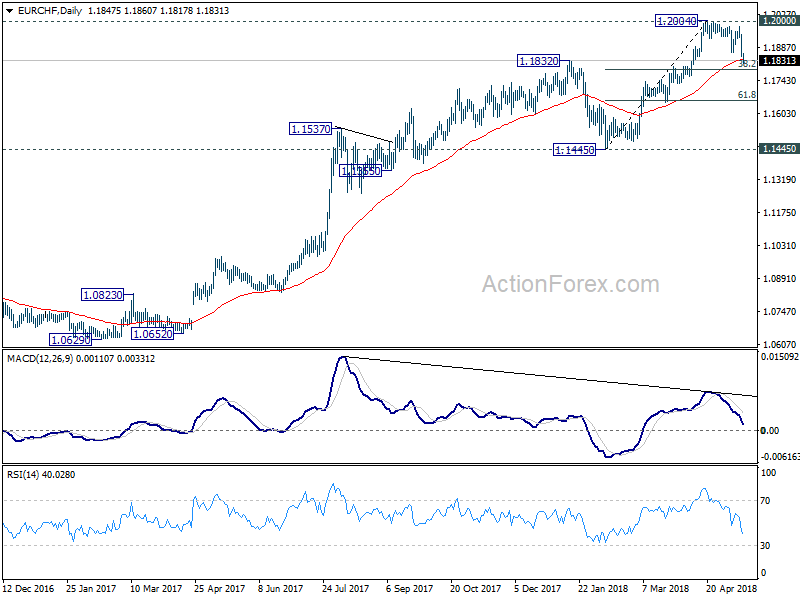
EUR/CHF drops sharply to as low as 1.1817 as correction from 1.2004 extends. Intraday bias is back on the downside for deeper fall. For now, we'd still strong support from 38.2% retracement of 1.1445 to 1.2004 at 1.1790 to contain downside and bring rebound. And decisive break of 1.2004 will confirm up trend resumption. However, sustained break of 1.1790 will at least bring deeper fall to 61.8% retracement at 1.1659 and below.
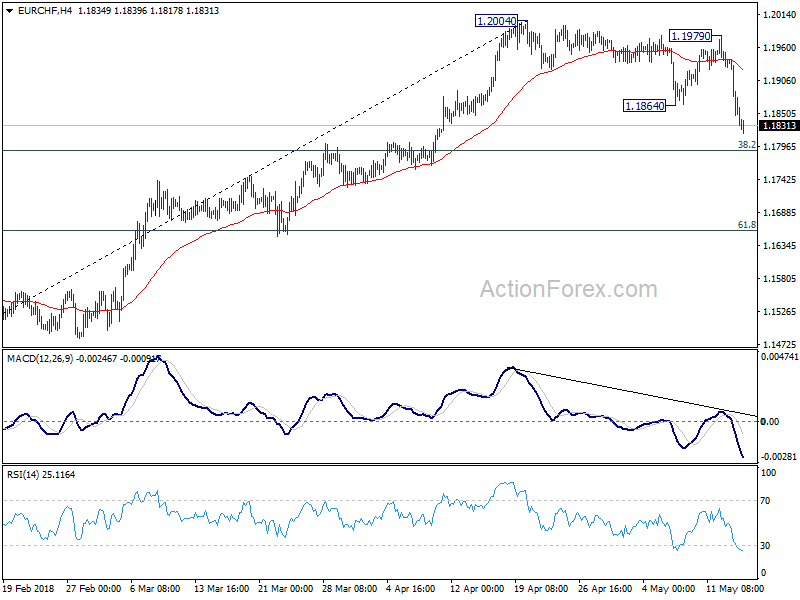
In the bigger picture, long term up trend in EUR/CHF is still in progress. Prior SNB imposed floor at 1.2000 was already met but there is no sign of reversal yet. As long as 1.1445 support holds, we'd expect the up trend to extend to 2013 high at 1.2649 next. However, considering bearish divergence condition in daily MACD. Break of 1.1445 will be an indication of medium term reversal and will turn outlook bearish.
USD/JPY Declining
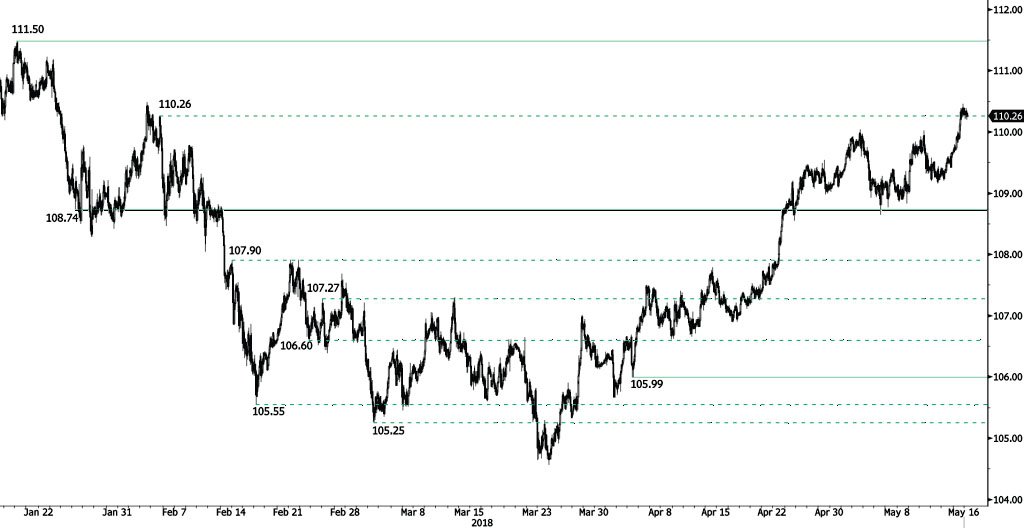
USD/JPY is decreasing after breaking hourly resistance at 110.26 (05/02/2018), heading along the 110.20 range. The bullish pattern started from 104.56 (25/03/2018 low) continues. Hourly support and resistance are located at 108.74 (25/01/2018 low) and 111.50 (18/01/2018 high). The technical structure suggests short-term decrease.
We favor a long-term bearish bias. Support remains at 101.20 (09/11/2016 low). A gradual rise toward the major resistance at 125.86 (05/06/2015 high) seems unlikely. Expected to decline further support at 101.20 (09/11/2016 low). The pair trades at its 200 DMA range.
GBP/USD Trying To Bounce
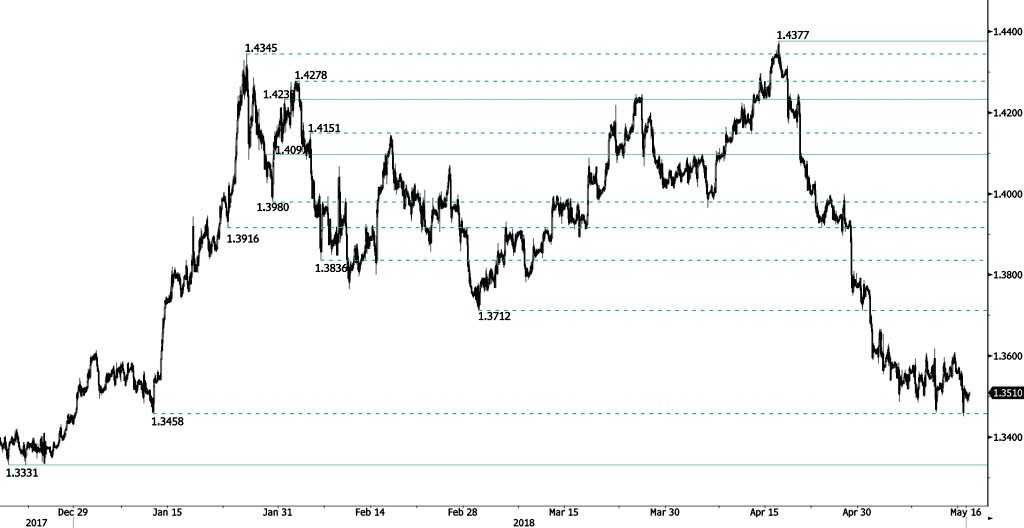
GBP/USD is bouncing off from 1.3451 low and broke hourly support at 1.3458 (11/01/2018). The pair is heading along the 1.3530 range. Hourly support and resistance are given at 1.3331 (19/12/2017 low) and 1.4097 (29/01/2018 high). The technical structure suggests short-term increase.
The long-term technical pattern is reversing. The Brexit vote had paved the way for further decline but the pair is moving to 2016 highs. Long-term support and resistance are given at 1.1841 (07/10/2017 low) and 1.5018 (24/06/2016 high).
EUR/USD Testing Hourly Support At 1.1812
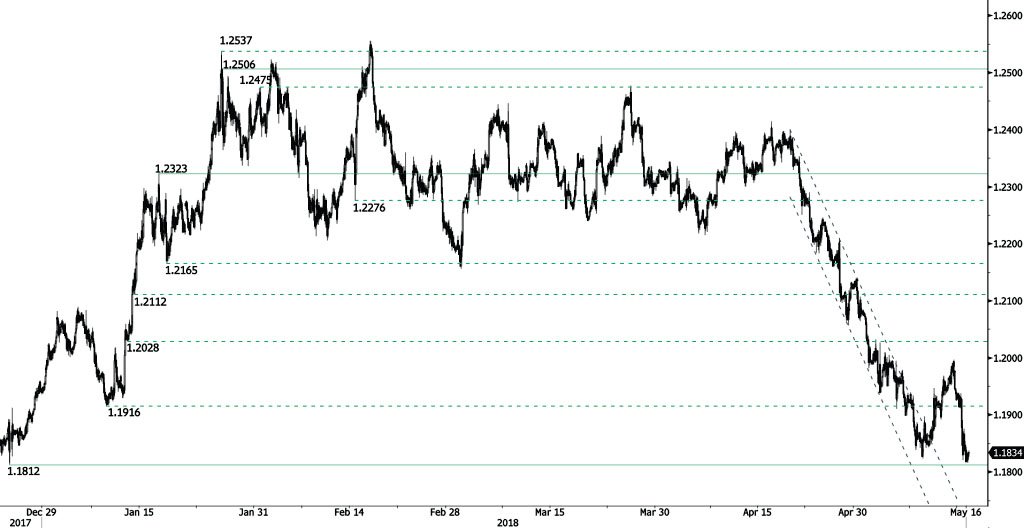
EUR/USD is starting a bearish consolidation after declining at 1.1817, testing hourly support at 1.1812 (25/12/2017 low) and heading along 1.1815. The pair is currently trading at end- December 2017 levels. Hourly resistance remains at 1.2323 (17/01/2018 high). The technical structure suggests short-term sideways trading moves.
In the longer term, the momentum is turning largely positive. We favor a continued bullish bias. Key resistance is holding at 1.2886 (15/10/2014 high) while strong support lies at 1.1554 (08/11/2017 low).
AUD/USD Daily Outlook
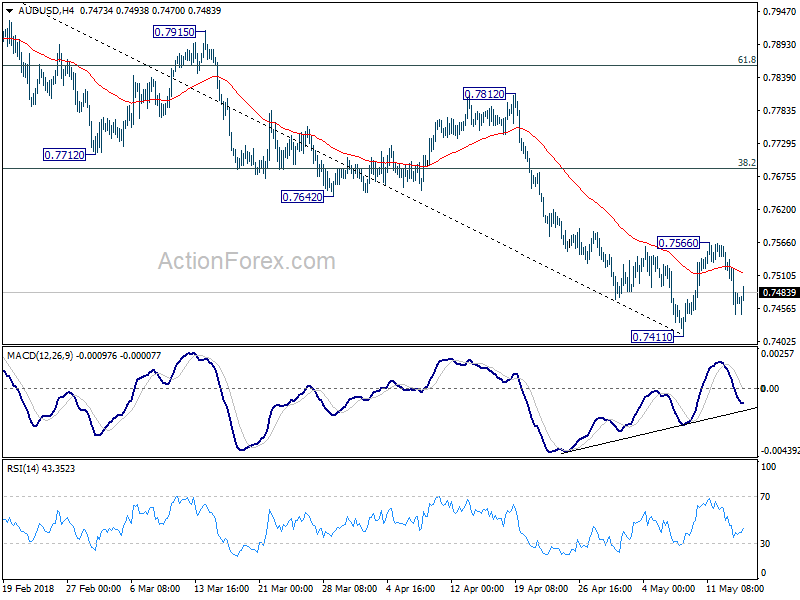
Daily Pivots: (S1) 0.7434; (P) 0.7486; (R1) 0.7525; More...
Despite sharp decline from 0.7566, AUD/USD is holding above 0.7411 short term bottom. Intraday bias remains neutral first. More consolidation could be seen and above 0.7566 will bring another recovery. But in that case, upside should be limited by 38.2% retracement of 0.8135 to 0.7144 at 0.7688 to bring decline resumption. On the downside, break of 0.7411 will resume the fall from 0.8135 and target cluster support at 0.7328 (61.8% retracement of 0.6826 to 0.8135 at 0.7326).
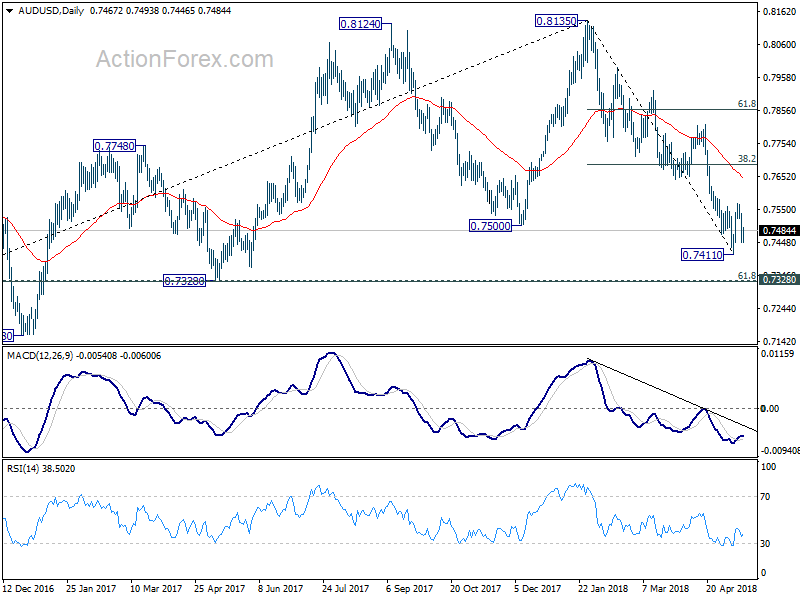
In the bigger picture, medium term rebound from 0.6826 is seen as a corrective move. Decisive break of 0.7500 key support suggests that such correction is completed at 0.8135. Deeper decline would be seen back to retest 0.6826 low. In case of another rise, we'd expect strong resistance from 38.2% retracement of 1.1079 to 0.6826 at 0.8451 to limit upside to bring long term down trend resumption eventually.
XAU/USD Analysis: Should Recover After Plunge
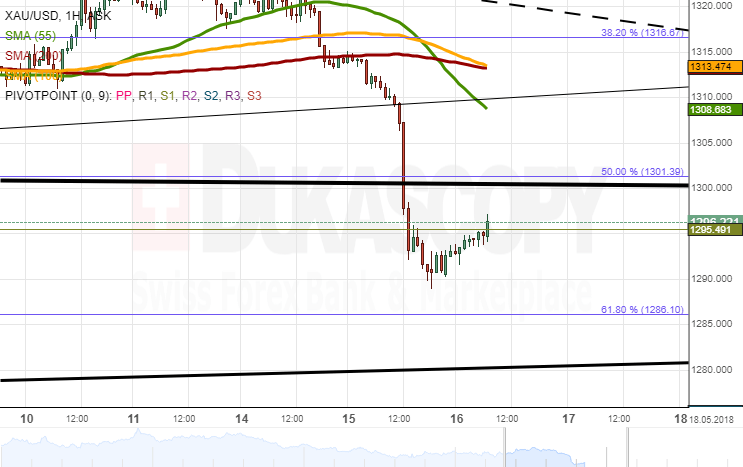
The inability of the yellow metal to surpass the 200-hour SMA on Tuesday morning was followed by a significant 1.85% plunge down to the 1,290.00 level. Additional bearish pressure was provided by disappointing US Retail Sales released mid-yesterday.
During this time, Gold breached various support levels, including the five-month channel. The seniority of this pattern suggests that the pair should edge higher and test its bottom boundary and the 50.0% Fibonacci retracement at 1,300.00.
It is also likely that the pair's appreciation does not end there, as it should aim for the 55-, 100– and 200-hour SMAs near 1,310.00.
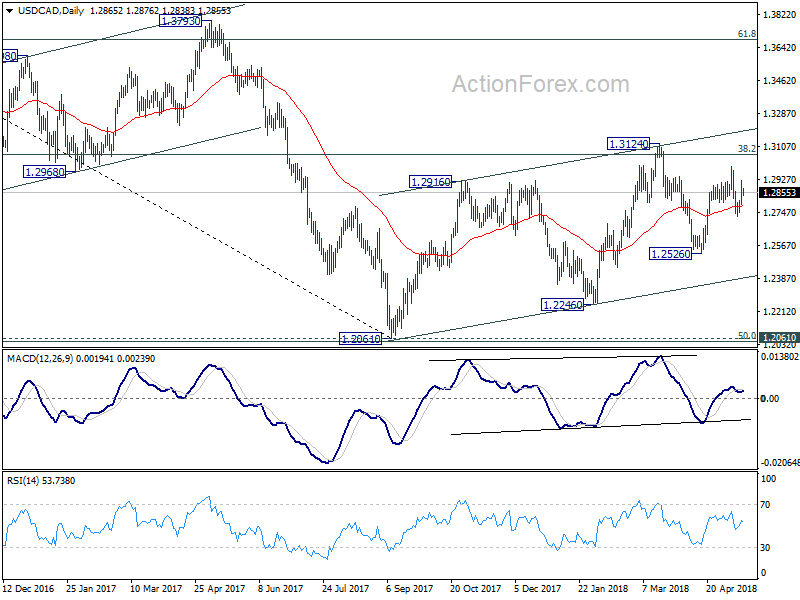
USD/CAD Daily Outlook
Daily Pivots: (S1) 1.2797; (P) 1.2864; (R1) 1.2943; More....
As noted before, the pull back from 1.2996 has completed at 1.2728 already. Intraday bias remains mildly on the upside for 1.2996 resistance first. Break there will affirm our bullish view that rebound from 1.2061 low is still in progress. And in that case, further rise should be seen to retest 1.3124 key resistance. We'll hold on to this bullish view as long as 1.2728 support holds.
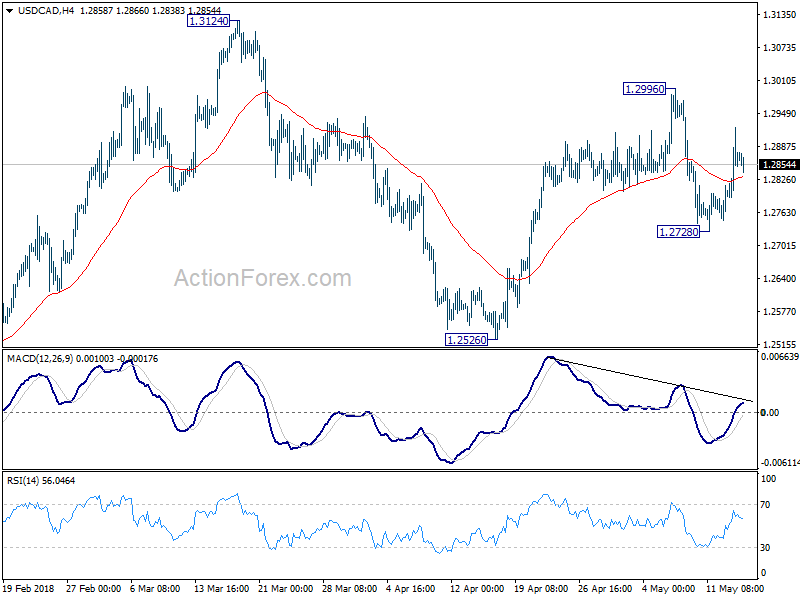
In the bigger picture, current development suggests that rebound from 1.2061 has not completed yet. Focus is back on 38.2% retracement of 1.4689 to 1.2061 at 1.3065. Sustained trading above there will confirm medium term bullish reversal. That is, down trend from 1.4689 has completed at 1.2061 already. In that case, next target will be 61.8% retracement at 1.3685. However, break of 1.2526 support will dampen this bullish view again. And, focus will be back on 1.2061 key support level, which is close to 50% retracement of 0.9406 (2011 low) to 1.4689 (2015 high) at 1.2048