

Sample Category Title
Silver: White Metal Trading Higher In The Asian Session
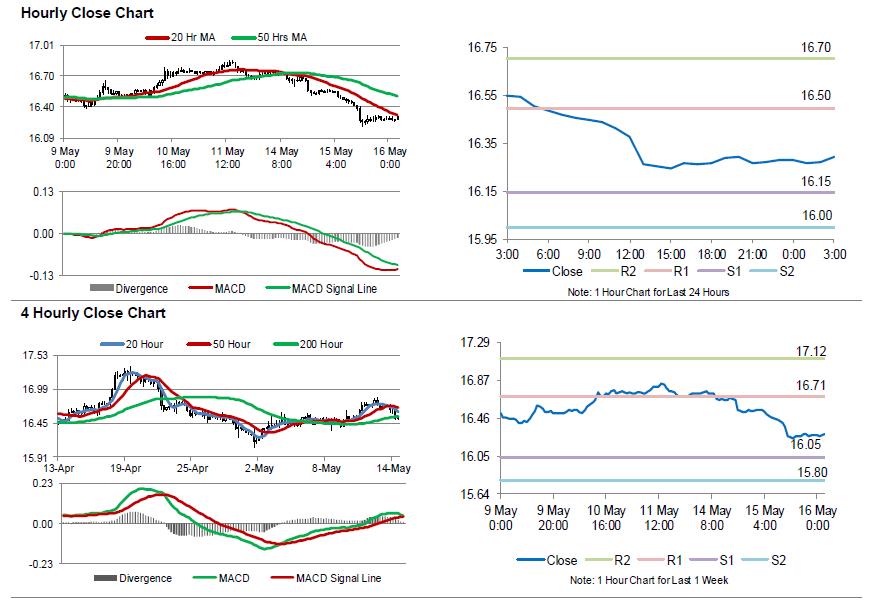
For the 24 hours to 23:00 GMT, Silver declined 1.57% against the USD and closed at USD16.29 per ounce, tracking losses in gold prices.
In the Asian session, at GMT0300, the pair is trading at 16.30, with silver trading 0.06% higher against the USD from yesterday’s close.
The pair is expected to find support at 16.15, and a fall through could take it to the next support level of 16.00. The pair is expected to find its first resistance at 16.50, and a rise through could take it to the next resistance level of 16.70.
The white metal is showing convergence with its 20 Hr moving average and trading below its 50 Hr moving average.
Australia’s Westpac Consumer Confidence Eased In May
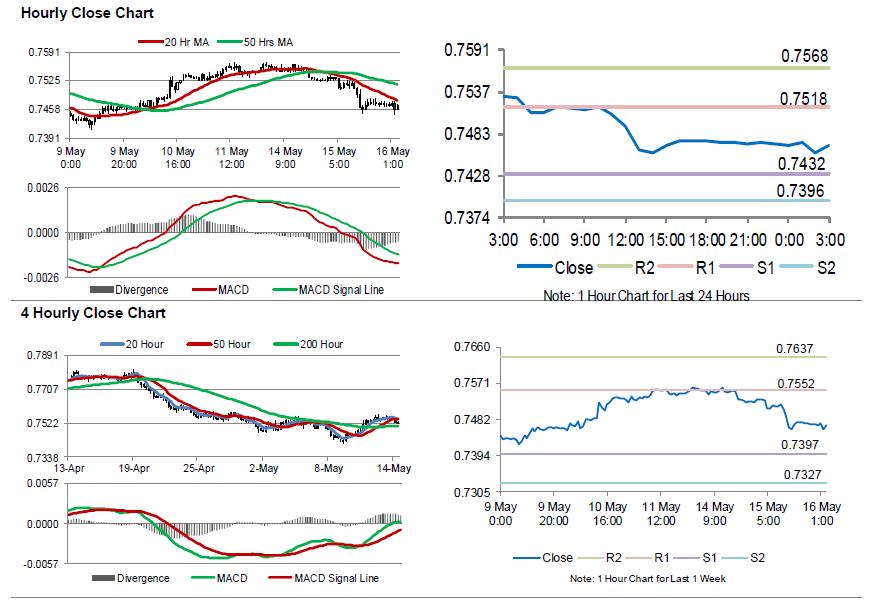
For the 24 hours to 23:00 GMT, the AUD declined 0.74% against the USD and closed at 0.7470.
LME Copper prices declined 0.08% or $5.5/MT to $6822.5/MT. Aluminium prices rose 1.2% or $27.5/MT to $2313.0/MT.
In the Asian session, at GMT0300, the pair is trading at 0.7467, with the AUD trading slightly lower against the USD from yesterday’s close.
Overnight data revealed that Australia’s Westpac consumer confidence index dropped 0.6% on monthly basis, to a level of 101.8 in May, compared to a level of 102.4 in the prior month.
The pair is expected to find support at 0.7432, and a fall through could take it to the next support level of 0.7396. The pair is expected to find its first resistance at 0.7518, and a rise through could take it to the next resistance level of 0.7568.
Going forward, Australia’s unemployment rate data for April and consumer inflation expectations for May, scheduled to release in the early hours of tomorrow, will be on investors’ radar.
The currency pair is trading below its 20 Hr and 50 Hr moving averages.
Japan GDP ended expansion streak… temporarily
Japan GDP contracted -0.2% qoq in Q1, worse than expectation of 0.0% qoq. On annualized basis,GDP contracted -0.6% versus expectation of -0.1%. The contraction marked the end of eight straight quarters of growth. And that was the longest streak since 1989. GDP deflator, however, rose 0.5% yoy, beating expectation of 0.3% yoy.
But it's generally believed that the contraction is temporary. In particular, a relatively weaker Yen at 100 against Dollar and global recovery, export led Japanese economy remains on solid footing for expansion.
Also from Japan, industrial production was revised up to 1.4% mom in March, from first estimate of 1.2% mom.
Gold: Yellow Metal Trading On A Stronger Footing This Morning
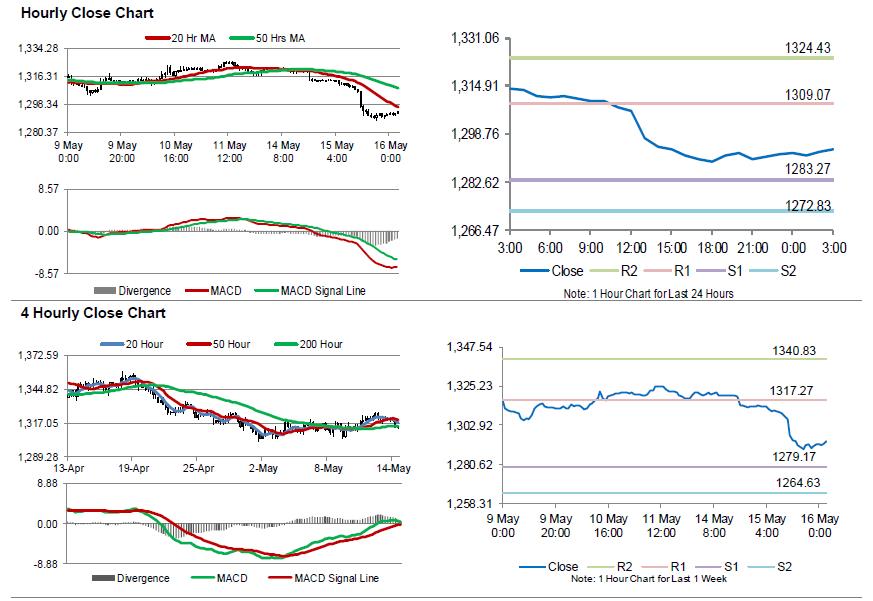
For the 24 hours to 23:00 GMT, Gold declined 1.72% against the USD and closed at USD1291.00 per ounce, amid a broad strength in the US Dollar.
In the Asian session, at GMT0300, the pair is trading at 1293.70, with gold trading 0.21% higher against the USD from yesterday’s close.
The pair is expected to find support at 1283.27, and a fall through could take it to the next support level of 1272.83. The pair is expected to find its first resistance at 1309.07, and a rise through could take it to the next resistance level of 1324.43.
The yellow metal is trading below its 20 Hr and 50 Hr moving averages.
Crude Oil: Oil Reverses Its Losses In The Asian Session
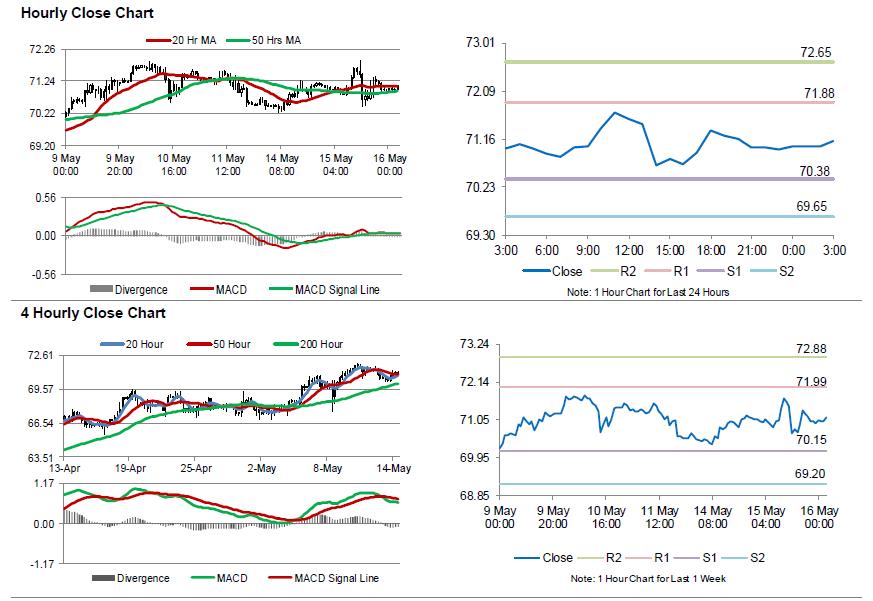
For the 24 hours to 23:00 GMT, Crude Oil declined 0.21% against the USD and closed at USD70.95 per barrel, after the American Petroleum Institute (API) reported that US crude oil inventories unexpectedly rose by 4.9 million barrels to 435.6 million barrels in the last week.
In the Asian session, at GMT0300, the pair is trading at 71.11, with oil trading 0.23% higher against the USD from yesterday’s close.
The pair is expected to find support at 70.38, and a fall through could take it to the next support level of 69.65. The pair is expected to find its first resistance at 71.88, and a rise through could take it to the next resistance level of 72.65.
Crude oil is showing convergence with its 20 Hr moving average and trading above its 50 Hr moving average.
I’m A Believer
I'm a believer
The promising US Retail sales data left a resounding footprint on global markets as US consumers are loosening their purse strings, but perhaps more important from an investor perspective, the data speaks directly and plainly while providing a linear gauge of the trickle-down effects from fiscal stimulus. Indeed, green shoots start to emerge.
The UST 10Y closed above the critical and pivotal 3.05 % area which encouraged the dollar Bulls to hammer the EURUSD down to critical structural support levels. While the clearest dollar bull signal is from US 10y yields, but with trader humming the iconically cool ” I'm a Believer” this morning, there's permanence building as waves of fresh dollar longs hit the books.
Oil Markets
Despite OPEC oil demand forecasts amidst China's unquenching thirst for crude oil rising, bullish Asia sentiment seems to have gone off the boil after China reported weaker-than-expected investment and retail sales in April, muddying its economic outlook suggesting the domestic surge in refinery runs could be short-lived.
The stronger dollar typically causes a bit of indecision as investors usually back off from commodity risk when the US dollar strengthens.
The API reported a surprise inventory build for the week ending May 11 which caused some intraday long positions to cut risk.
But at the end of the day, Oil markets remain supported by the usual suspects, Iran and Venezuela and OPEC compliance suggesting Oil remains a buy on the dip.
Gold Markets
Gold finally succumbed to the $1300 level as the stronger USD dollar ran roughshod through COMEX gold overnight. But with Gold positioning on CFTC significantly reduced against much of the year, mirroring the money flows into the USD over the past month, there wasn't a lot of market stress on the move from a flow perspective.
Shifting interest rate dynamics on the back of oil-driven inflation expectations with the stronger USD in tow suggests we could see an extension lower. But ultimately the longer term inflationary pressures, especially with real interest rates expected to stay historically low, gold should continue to find support. However.,logic suggests letting et the dust settle, as bullish signals have remained far and few between of late.
G-10 Currencies
EUR: The US retail sales number triggered a massive currency reaction on the back of UST 10 Y yields rocketing higher. While the market is tentatively finding support at the critical 1.1820-25 level, it's hard to argue the current direction given the surging US yields which suggest we could print in the 1.17 handle sooner than later.
JPY: USDJPY soared as the US Treasury yield rally spotlight on the interest rate policy divergence between the Bank of Japan and the Fed. USDJPY rose from 109.91 at the NY open to 110.44. However, Yonhap reported North Korea is cancelling its meeting with South Korea for Wednesday and threatening to withdraw from its summit with Trump – all because of US-South Korea drills. Which has seemingly capped, at least for the time being, USDJPY upward momentum
Malaysia
The local markets are going through a period of inflexion. After navigating a potentially high-risk election, as investors are taking a well-deserved breather after coming out relatively unscathed.
But with the US dollar trading stronger across the EM Asia Basket and in G-10 space the Ringgit will struggle to make any inroads today Especially with the US 10 years UST surging to 3.08 overnight.
Investors are unlikely to flock back into the Ringgit end masse over the next week especially with the USD surging and US yields punching higher and oil prices off their latest high-water mark.
We should expect a bit of a bumpy ride over the next few weeks as soon as the government lays all their policy cards on the table. Yesterday Malaysia's new Council of Eminent Persons briefed the public on its activities, but the main take away is that fiscal reforms will shade more towards cost cuts to offset GST removal at this stage and should be good enough to keep the prey Credit agencies eyes at bay for the time being.
Can EUR/JPY Move Above 131.50 Resistance?
Key Highlights
- The Euro found support near 129.20/30 and recovered higher against the Japanese Yen.
- There is a major bearish trend line in place with resistance near 131.30 on the 4-hour chart of EUR/JPY.
- The Euro Area Gross Domestic Product in Q1 2018 (Prelim) came in at 0.4%, similar to the forecast.
- Today, the Euro Zone CPI for April 2018 will be released, which is forecasted to rise 1.2% (YoY).
EURJPY Technical Analysis
The Euro declined heavily earlier during the start of May 2018 against the Japanese Yen. The EUR/JPY pair broke 132.00 and 130.00 support levels before finding buyers just above 129.20.
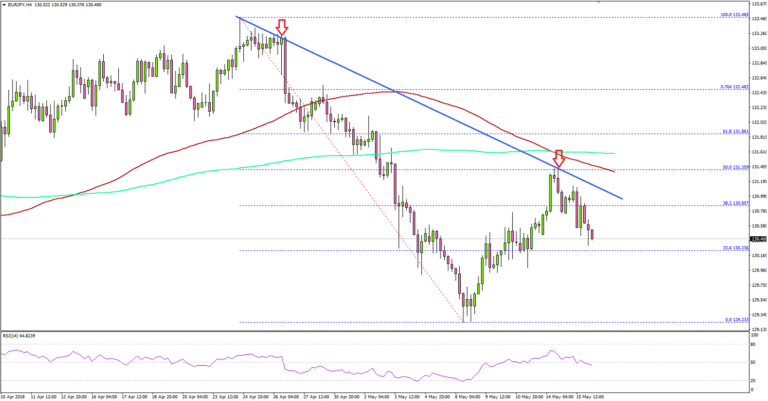
A low was formed at 129.23 before the pair started an upside correction. It moved higher and broke the 130.00 resistance, and even cleared the 23.6% Fib retracement level of the last decline from the 133.48 high to 129.23 low.
It gained bullish momentum above 131.00, but buyers faced a major hurdle just below 131.50. The 50% Fib retracement level of the last decline from the 133.48 high to 129.23 low acted as a resistance.
Moreover, there is a major bearish trend line in place with resistance near 131.30 on the 4-hour chart of EUR/JPY. Moreover, the 100 (red) and 200 (green) simple moving averages (4-hour) are near 131.50/60.
Therefore, a break above the 131.30-50 resistance won’t be easy. If buyers succeed, the pair may rise towards 132.00 and 133.00 in the near term. On the downside, supports are at 130.20 and 130.00.
Recently, the Euro Area Gross Domestic Product for Q1 2018 (Prelim) was released by the Eurostat. The market was looking for a growth rate of 0.4% compared with the previous quarter.
The actual result was similar, and the yearly change was also in line with the forecast of 2.5%. The report mentioned that:
Seasonally adjusted GDP rose by 0.4% in both the euro area (EA19) and the EU28 during the first quarter 2018, compared with the previous quarter. In the fourth quarter of 2017, GDP had grown by 0.7% in the euro area and by 0.6% in the EU28.
The overall result was neutral, and it did not help the EUR/JPY and EUR/USD pairs in the short term.
Economic Releases to Watch Today
- German Consumer Price Index for April 2018 (YoY) – Forecast +1.6%, versus +1.6% previous.
- German Consumer Price Index for April 2018 (MoM) – Forecast 0%, versus 0% previous.
- Euro Zone CPI for April 2018 (YoY) – Forecast +1.2%, versus +1.2% previous.
- Euro Zone CPI for April 2018 (MoM) – Forecast +0.3%, versus +1.0% previous.
- Euro Zone Core CPI for April 2018 (YoY) – Forecast +0.7%, versus +0.7% previous.
- US Housing Starts April 2018 (MoM) – Forecast 1.310M, versus 1.319M previous.
- US Building Permits April 2018 (MoM) – Forecast 1.350M, versus 1.354M previous.
- US Industrial Production April 2018 (MoM) – Forecast +0.6%, versus +0.5% previous.
Market Morning Briefing: Euro Saw A Sharp Drop
STOCKS
Almost all major indices have tested resistances or are trading just below resistance levels. While those hold, there could be some collective correction in the equity indices in the near term.
Dow (24706.41, -0.78%) fell sharply from the immediate daily trend resistance as mentioned yesterday. While the fall continues, the index could come off towards 24500-24250 in the coming sessions.
Dax (12970.04, -0.059%) closed slightly at lower levels but note that there is support near 12800-12900 levels and while the support holds, medium term outlook for Dax remains bullish.
Nikkei (22728.74, -0.39%) also come down a bit to test daily channel support. If the support manages to hold, Nikkei could again start to move up towards 23000+ levels in the coming sessions. Only on a break below 22600, we may expect the index to come off in the medium term.
Shanghai (3177.87, -0.45%) could be stable below 3200 for now and while the resistance at 3200 holds, near to medium term looks bearish.
Nifty (10801.85, -0.044%) moved up to make an intra-day high of 10900 on news of the Karnataka election results. Some stability could be achieved over today and tomorrow. Immediate support is near 10800 and if that holds, the index could move up in the near term.
COMMODITIES
Brent (78.18) and Nymex WTI (71.05) are almost stable. WTI has some support near 70.50 and could move up in a few sessions while the scope on the upside for Brent looks limited. Brent has resistance near 80 and could be stable in the 80-76 region in the coming days.
Gold (1293.40) came off finally breaking below 1300 and could test 1280 on the downside before pausing. Support is visible on the 3-day candles and may hold in the medium term producing a bounce back towards 1320.
Copper (3.06) is trading just above support levels and while that holds, it could head higher towards 3.15 in the near term.
FOREX
Dollar index (93.30) moved up sharply after the US 10 Year yield rose past 3% decisively yesterday (see Interest Rates below). This was in response to US Retail Sales data matching expectation for Apr and also due to an upward revision in the numbers for April. The Dollar Index has shot up from the 13 days moving average near 92.5 and has seen a high near 93.46. It could see a dip towards 93 over today and tomorrow. However, given its broader uptrend, it could target levels near 94-95 by next week.
Euro (1.1828) saw a sharp drop from the 13 days moving average line and is now testing the 55 weeks moving average. It could see a bit of a pause here and see some upward correction towards 1.187-1.188. However, as the Dollar Index tests levels near 94-95 next week, Euro could test levels near 1.16-1.15.
Dollar Yen (110.25), as we predicted yesterday, rose to a high near 110.46. It could rise up even further to test resistance on daily line chart near 111. However, after that, it should turn bearish for the medium term.
Euro Yen (130.38) as we mentioned yesterday, did find resistance at the 13 days MA and dipped from there. However, it could see a rise towards 131 if the Euro rises to 1.187 and Dollar Yen stays near 110.5.
Pound (1.3498): Against our expectation, the rise in Pound towards 1.37 didn’t take place as Dollar strength took Pound below 1.35. However, there is support on 3 day candles near current levels, which could lead to a pause in its downtrend in the near term.
Dollar Rupee (68.075): Watch Resistance at 68.12-25 today. If it breaks, then 68.79-86 will be on the cards. If it holds, we can see a 50-100 paise correction.
INTEREST RATES
US Retail Sales grew 0.3% in April and the March growth figures were revised upward from 0.6% to 0.8%. Sentiment around US economic growth has received a boost by these numbers, with the 2nd quarter of 2018 expected to see higher consumption as compared to the mild consumption figures in the 1st quarter. This data release (as we had anticipated yesterday), has turned out to be the trigger which has made the US 10 Year yield breach the 3% level decisively (high near 3.09%). We can now expect US yields to move towards their medium term targets, which are as below:
3.2%-3.3% (10 Year), 3.4%-3.5% (30 Year), 3.15% (5 Year) and 2.75% (2 Year)
As the expected rate hike in the June Fed meeting starts getting factored later this month, the rally in yields could continue till the above mentioned targets are reached. We also expect some more yield curve flattening in this month followed by steepening after that, as yields bounce from long term supports.
US 10 Yr Yield (3.06%), 30 Yr (3.19%), 5 Yr (2.91%), 2 Yr (2.57%): The 30 year yield and 5 year yield are near their resistance levels on the short term chart. Last time they tested these resistances, they had come off from there. However, this time we expect them to breach these levels. Let’s wait and watch.
The German 10 Year – US 10 Year yield spread (-2.41) is getting some interim resistance from 21 moving average on medium term chart. However, as we predicted yesterday, it could keep moving up towards -2.3% in this month. German 10 year yield (0.65%) has gone up further after having risen from support near 0.5% on short term chart yesterday. It might now target resistance near 0.9% in the medium term.
We have been saying that: 0.9% on German 10 year yield and -2.3% on the German-US spread gives a target of 3.2% for the US 10 year which syncs well with our above mentioned medium term targets.
Eco Data 5/16/18
[php_everywhere instance="1"]
Australia’s Wage and Employment Data Under the Microscope
In Australia this week, the main events will be the release of wage growth and employment data on Wednesday and Thursday respectively, both at 0130 GMT. Forecasts point to another set of decent figures, which may support the Aussie a little, but are unlikely to change the RBA’s neutral stance on policy.
The Reserve Bank of Australia (RBA) held its policy unchanged for the 19th consecutive meeting in early May, marking a new record for keeping interest rates stable. The Bank has long been faced with a tough dilemma: the economy is performing relatively well overall, but wages have not risen enough, keeping the nation’s heavily-indebted households relatively cautious of spending too much. Hence, policymakers have been keeping rates low, waiting for wages to accelerate and ease the debt burden on households, which would allow consumers to spend more in the future and boost economic growth.
That is not likely to be evident in this week’s data releases though, according to economic forecasts. The nation’s wage price index for Q1 is projected to have risen by 2.1% in yearly terms, the same rate as in the previous quarter. Meanwhile, the unemployment rate is anticipated to have held steady at 5.5% in April, while the net change in employment is expected to have risen by 20k, notably more than the lackluster 4.9k recorded in March. While the wage prints are arguably more significant for how the RBA may act, the employment figures have been generating a bigger reaction in the Aussie recently, and it will be interesting to see whether this pattern continues.
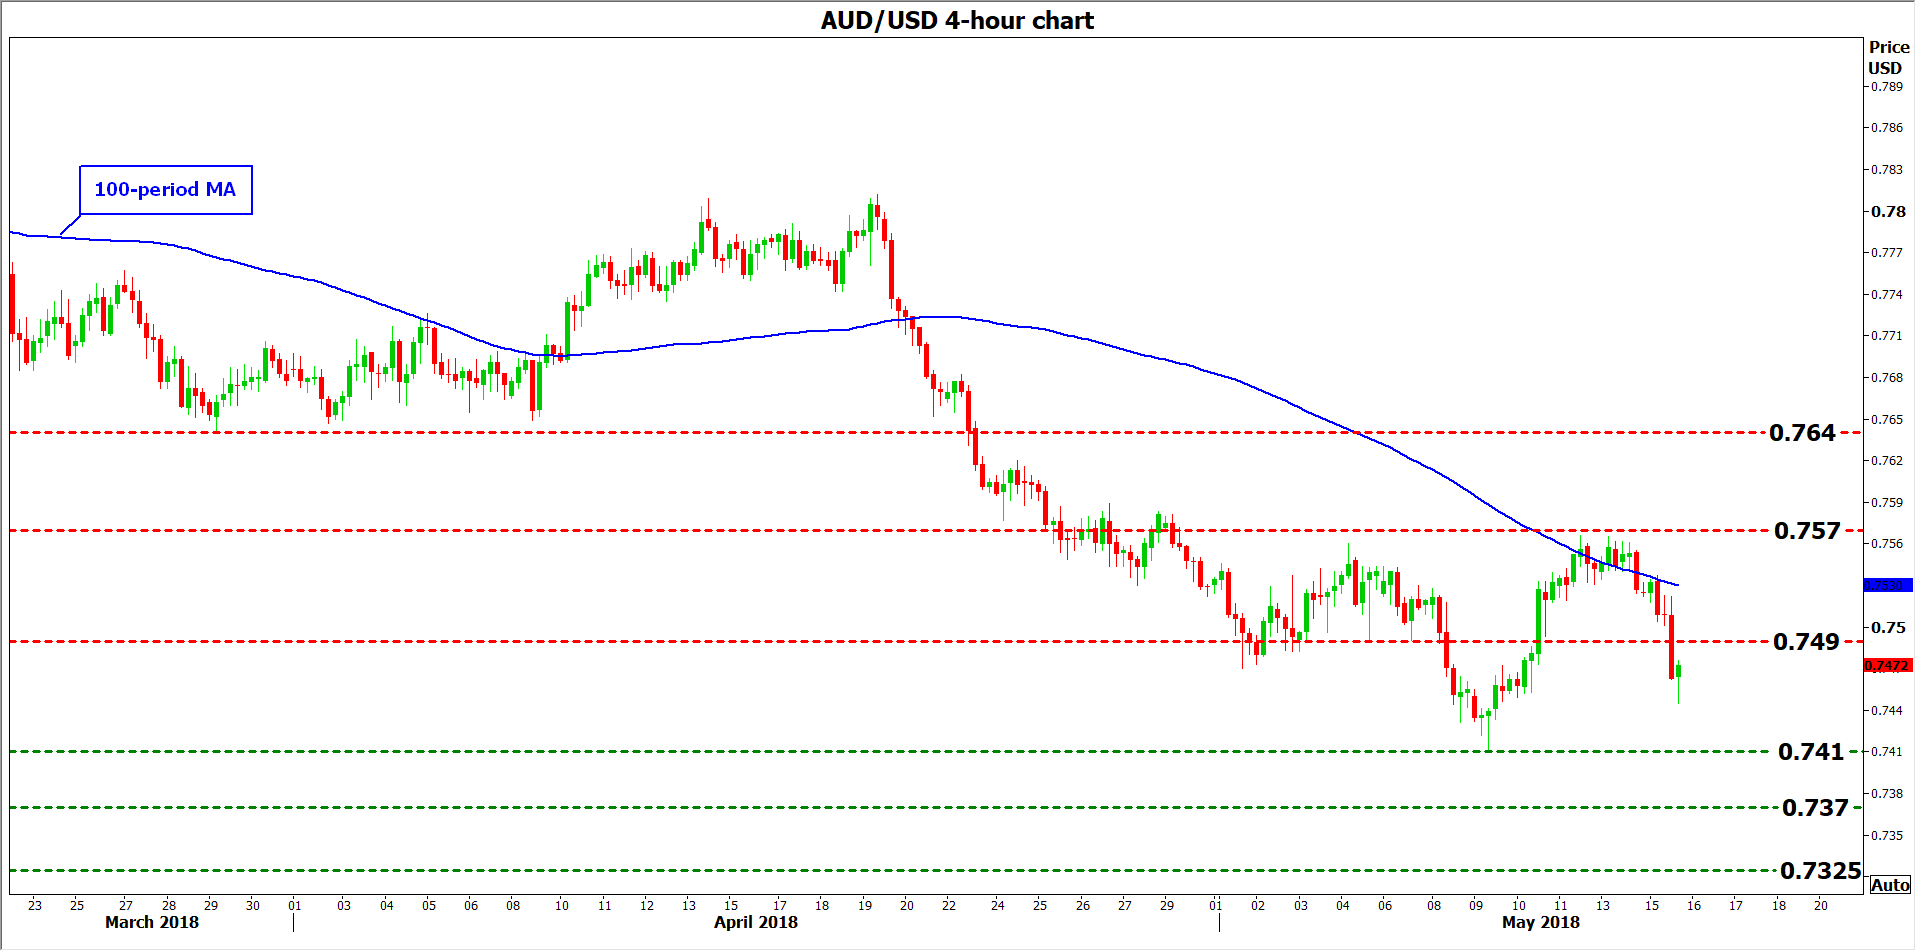
Should these prints come in stronger than expected, stoking expectations for a more hawkish tone by the RBA, then the aussie could recover some of its latest losses. Looking at aussie/dollar, advances in the pair could encounter immediate resistance at 0.7490, the inside swing low of May 4. An upside break of that line could open the way for 0.7570, the peak of May 11 and 14. Further up, the 0.7640 zone would come in focus, marked by the March 29 lows.
On the other hand, a disappointment in these data may diminish any surviving hopes for the RBA to appear more optimistic anytime soon and thereby, bring the aussie under renewed selling interest. Declines in aussie/dollar could stall initially near 0.7410, a level that halted the decline on May 9. If the bears overcome that barrier, that would mark a lower low in the pair, potentially opening the way for 0.7370, a level last seen in June 2017. Even lower, the 0.7325 area may come in play, defined by the trough of May 2017.