Sample Category Title
UK 100 Eyes All-time High; Medium-Term Outlook Increasingly Bullish
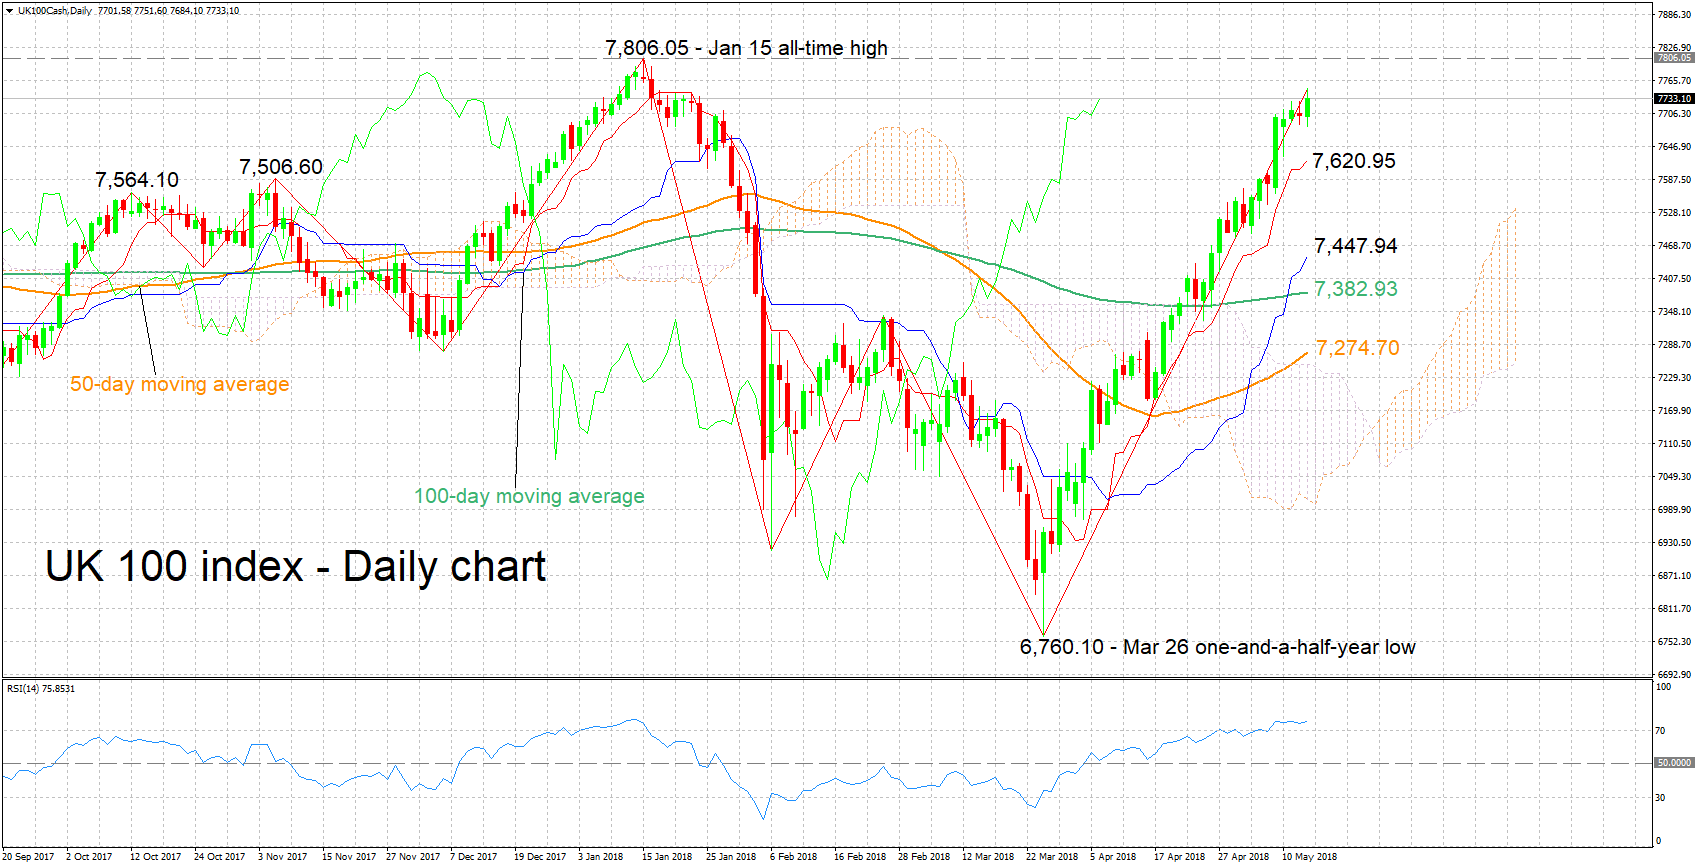
The UK 100 index has posted an impressive rally after hitting a one-and-a-half-year low of 6,760.10 on March 26; in fact the index has advanced in every single week ever since that trough and is currently on track for an eighth straight weekly gain.
The short-term bias is bullish as indicated by the positively aligned Tenkan- and Kijun-sen lines. The rising RSI adds to this view, though notice that the indicator has entered oversold territory above 70; the implication being that a near-term pullback is not to be ruled out.
Resistance to further gains might come around the all-time high of 7,806.05 – including the 7,800 round figure – recorded in mid-January. An upside break might open the way for more bullish movement, increasingly turning the attention to the 8,000 mark.
On the downside, support to declines could come around the current levels of the Tenkan- and Kijun-sen lines at 7,620.95 and 7,447.94 respectively. The area in between the two lines includes a couple of peaks from late 2017, at 7,564.10 and 7,506.60, that might also act as a barrier to losses.
The medium-term picture is looking increasingly bullish, with the index climbing further above the 50- and 100-day moving average lines, as well as above the Ichimoku cloud.
Overall, both the short- and medium-term outlooks are looking bullish at the moment, though there are signs of an overextended market in the near-term.
British Pound Under Pressure as UK Employment Data Falters
The British pound has posted losses in the Tuesday session. In the North American session, GBP/USD is trading at 1.3495, down 0.44% on the day. On the release front, UK employment numbers disappointed. Wage growth dropped to 2.6% in March, down from 2.8% a month earlier. This missed the estimate of 2.7%. Unemployment claims jumped to 31.2 thousand, well above the forecast of 13.3 thousand. The unemployment rate remained at 4.2%, matching the estimate. In the US, retail sales dipped to 0.3%, shy of the estimate of 0.4%. Core retail sales edged up to 0.3% but missed the forecast of 0.5%. On Wednesday, the US will release Housing Starts and Building Permits.
British employment numbers were a mixed bag on Tuesday. Unemployment claims and wage growth both missed their forecasts, but the unemployment rate remained steady, and the participation rate rose to 75.6%, the highest rate ever recorded. Policymakers at the Bank of England will have to digest the mixed job numbers, as the employment market and wage growth will be important factors in the bank’s thought process regarding rate future rate hikes. Weak economic numbers dissuaded the BoE from raising rates last week, but if second quarter data is stronger, the bank could press the rate trigger at its August meeting.
In the U.S, Retail sales reports were shy of the estimates in April, but investors preferred to focus on the positive, noting that both retail sales and core retail sales posted gains, as consumer spending is improving after a sluggish first quarter. A new concern is higher gas prices, which could put a dent in consumers’ wallets and hurt spending. Oil prices have hit their highest levels in over 3 years, and with the US leaving the Iran nuclear deal and escalating tensions in the Middle East, gasoline prices could remain at high levels.
Dollar Punches Above 110 Yen, Shrugs off Soft U.S Retail Sales
The Japanese yen has posted considerable losses in the Tuesday session, USD/JPY is trading at 110.29, up 0.58% on the day. On the release front, Japanese Tertiary Industry Activity declined 0.3%, missing the estimate of -0.2%. This marked the third decline in four months. In the US, the focus is on consumer spending reports. Retail Sales dipped to 0.3%, shy of the estimate of 0.4%. Core Retail Sales edged up to 0.3%, but missed the forecast of 0.5%. On Wednesday, the US will release Housing Starts and Building Permits.
Retail sales reports were shy of the estimates in April, but investors preferred to focus on the positive, noting that both retail sales and core retail sales posted gains, as consumer spending is improving after a sluggish first quarter. A new concern is higher gas prices, which could put a dent in consumers’ wallets and hurt spending. Oil prices have hit their highest levels in over 3 years, and with the US leaving the Iran nuclear deal and escalating tensions in the Middle East, gasoline prices could remain at high levels.
Has the impressive streak come to an end? Japan has boasted eight consecutive quarters of economic growth, but the first quarter appears likely to buck the trend. The economy is expected to show no growth in Q1, compared to strong growth of 1.6% in the fourth quarter. The expected slowdown is being attributed to weak consumer spending and softer global demand for Japanese exports. Still, analysts are viewing the Q1 report card as a temporary blip, with second-quarter expected to rebound with annualized growth of 1.0%.
PBOC Prone to Adopt Less Tightening as April Data Proves Slowdown Underway
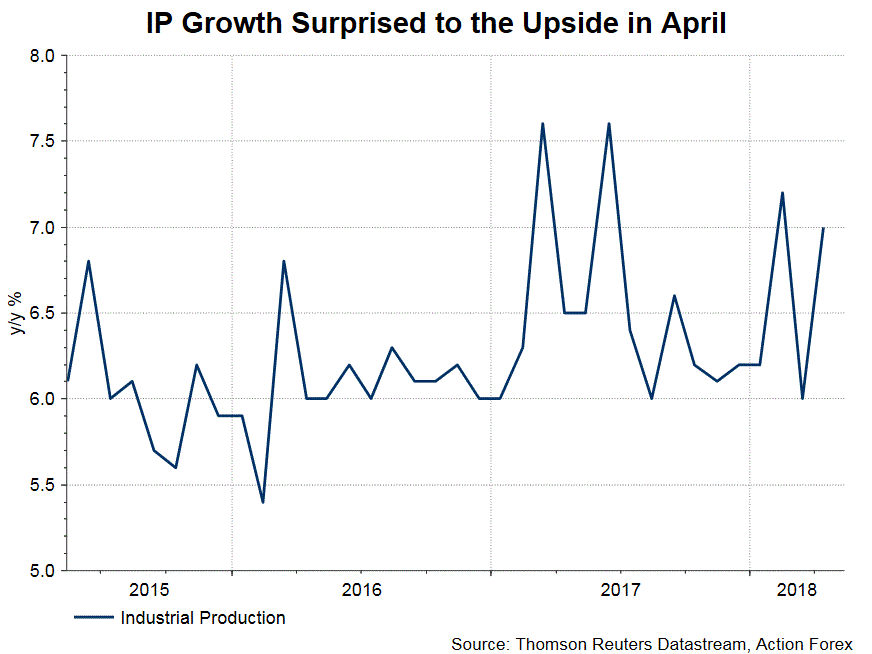
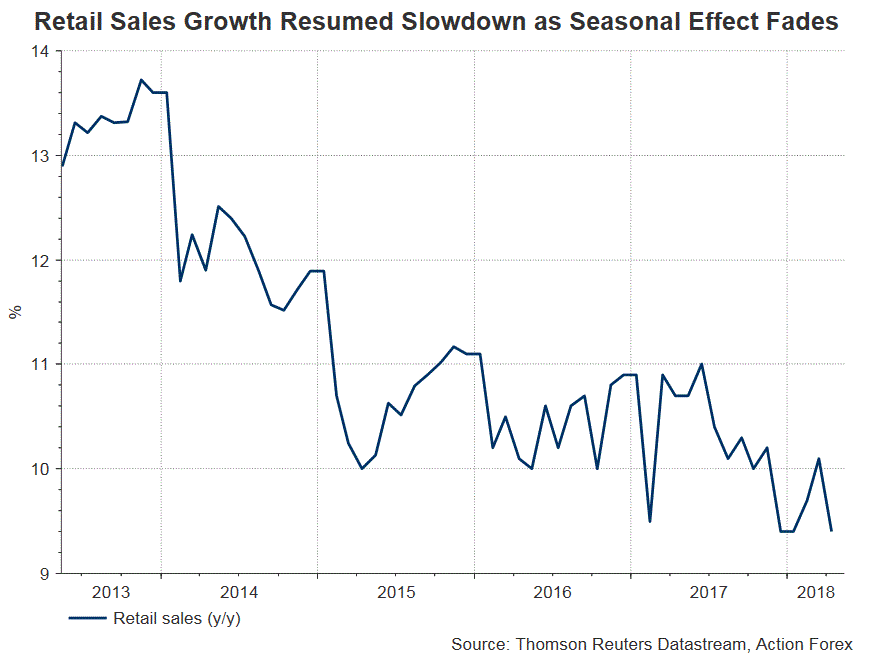
China’s macroeconomic data was mixed in April. Industrial production (IP) expanded +7% y/y, accelerating form +6% in March and consensus of +6.4%. Retail sales grew +9.4% y/y, easing from +10.1% in March. The market had anticipated a milder drop to +10%. Urban fixed-asset investment (FAI) increased +7% in the first four months of the year, compared with a +7.5% growth in the first three months. The market had anticipated a growth of +7.4%. Essentially, the reports mark the first set of data this year that’s unaffected by Lunar New Year. Presumably reflecting the underlying trend of the world’s second largest economy, the dataflow confirms that China is undergoing cyclical economic slowdown. Assessing the economic backdrop since the beginning of the year, we believe the authority has tilted its focus of monetary stance to growth stability from deleveraging.
The positive surprise from IP growth was in contrast with the official PMI. Recall that China’s manufacturing PMI eased to 51.4 in April, from 51.5 a month ago. The moderation was driven by slowdown in foreign demand, as well as the aftermath of the rapid easing in credit growth in the first quarter. Trade-related indices fell across the board, with the “new export orders” index slipping to 50.7 from 51.3 in March and “import” index plunging -1.1 points to 50.2. Falling for 5 months in a row, the “input prices” index was down -0.4 point to 53. Separately, the Caixin/ Markit PMI, which focuses on small and mid-size businesses, came in at 51.1 for April, up slightly from 51 in March. Moderation in IP growth is expected in coming months as US-China trade tensions have roiled the sentiment.
Retail sales growth retreated to 9.4%, from the three-month high in March, as increase in property-related consumption eased. The ongoing downtrend in FAI growth has been a result of the government’s targeted tightening measures. Weaker growth infrastructure investment (+7.6%, +8.3% in 1Q18) was partially offset by a recovery in manufacturing investment (+4.8%). The latter would likely continue to improve as supported by strong industrial profits and the government’s support on high-tech sectors.
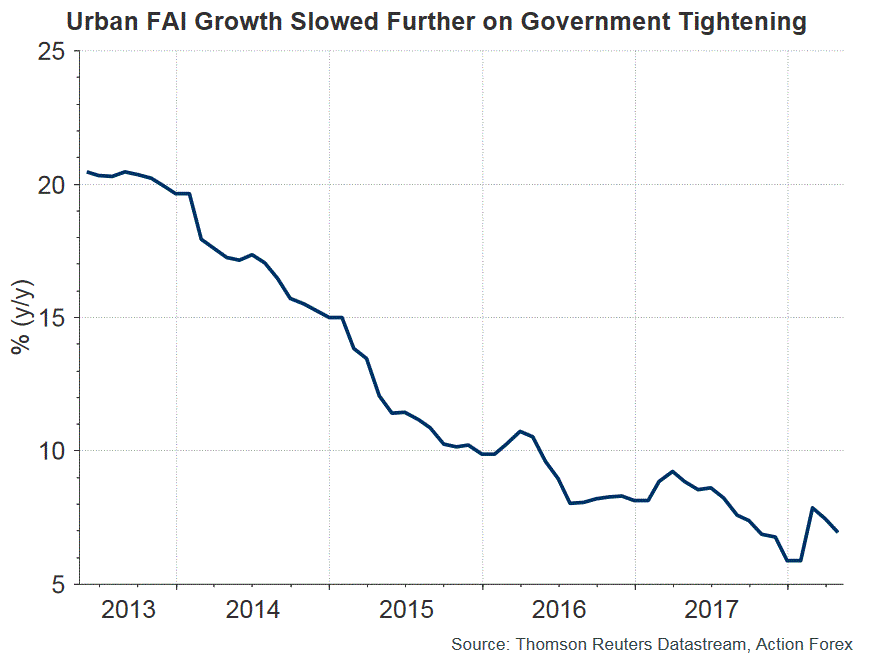
April’s data indicate that investment in China has moderated faster than expected, while challenges on trade have posed downside risks on external demand. As such, the government should continue to emphasize the stance of “persistently boosting domestic demand” and “more hard work” to achieve the GDP growth target of “about 6.5%”.
PBOC’s Shift in Priority
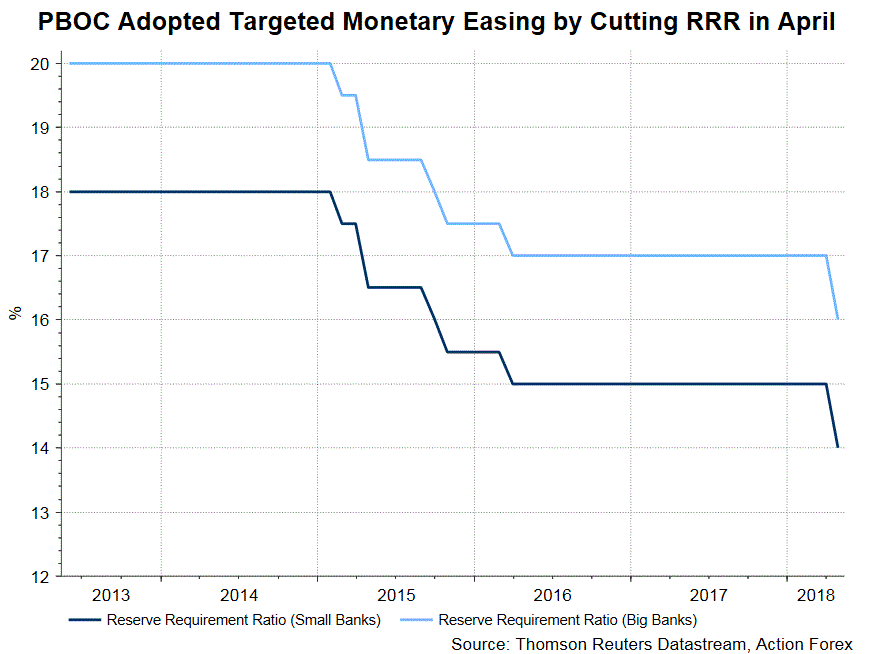
In the first quarter Monetary Policy Report released last week, PBOC stressed effective balance between economic growth stability, structural adjustment, and systematic risk prevention. Meanwhile, although the “neutral and prudent” stance on monetary policy remains in place, the emphasis on “deleverage” is diminished. In a special column about “the change in China’s macro leverage rate”, the central bank acknowledged that the macro leverage ratio increased +2.7 percentage points to 250.3% in 2017, markedly lower than the average increase of +13.5 percentage points during 2012-16. PBOC judged that the slowdown in the macro leverage ratio was driven by the “expansion of supply-side structural reform, a firmer economy and the effective implementation of a prudent, neutral monetary policy. This signaled the authority’s achievement in controlling leverage in the financial sector. PBOC added that “the economic transition from high-speed expansion to high-quality development requires higher utilization ratios of debt capital, which will help prompt a downturn in leverage ratios”. Moreover, it noted that “stronger financial regulation and improved financial markets will curb shadow banking-driven leverage growth". We believe the language paves the way for a skew of the monetary policy stance to growth stability from deleverage. That is, rather than monetary tightening, would be a more important tool in stemming and preventing risks in coming quarters.

EURUSD: Weakens On Price Sell Off
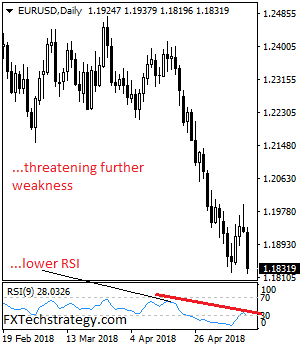
EURUSD: The pair saw a sell on Tuesday opening the door for price extension in the days ahead. On the upside, resistance comes in at 1.1850 level with a cut through here opening the door for more upside towards the 1.1900 level. Further up, resistance lies at the 1.1950 level where a break will expose the 1.2000 level. Conversely, support lies at the 1.1800 level where a violation will aim at the 1.1750 level. A break of here will aim at the 1.1700 level. Below here will open the door for more weakness towards the 1.1850. All in all, EURUSD faces further downside pressure on sell.
US: Retail Sales Start Q2 Relatively Strong
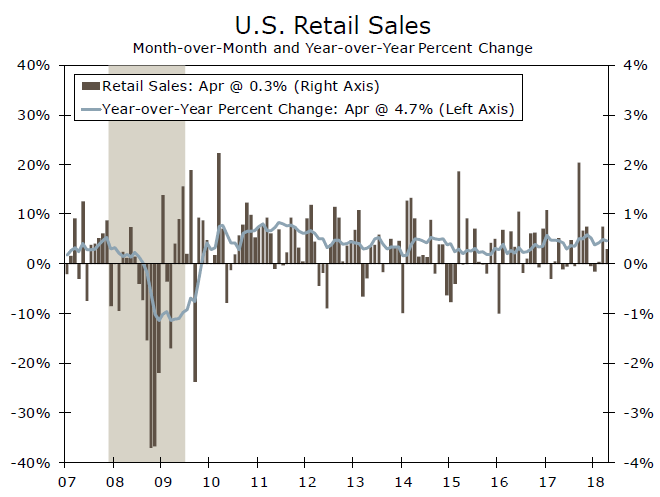
Retail sales increased 0.3 percent in April while March sales were revised upward. The recovery in consumption seems to have started at the end of Q1, which bodes well for consumer demand in Q2.
Retail Sales Recover Strength in March and April
Retail sales were in line with market expectations in April, increasing 0.3 percent. However, March's originally reported increase of 0.6 percent was revised upward to 0.8 percent. The details of the March revision were also strong, with retail sales excluding autos up 0.4 percent instead of 0.2 percent in March. For April, retail sales excluding auto sales were lower than expected, up 0.3 percent versus consensus' 0.5 percent expectation. Retail sales excluding auto and gas were up a less-than-expected 0.3 percent, but just because March's increase was revised up from a 0.3 percent increase to a 0.4 percent increase.
The strongest sectors of retail in April were clothing and clothing accessories stores' sales, up 1.4 percent compared to a decline of 0.2 percent in March, while miscellaneous store retailers' sales were up 0.9 percent. Meanwhile, gasoline stations' sales were up 0.8 percent, mostly driven by the recent increase in gasoline prices. Non store retailers' sales growth, on the other hand, moderated a bit from the strong, 0.9 percent increase in March to a still strong 0.6 percent rate in April. The next strongest sector in April was furniture & home furnishing stores' sales, whose index increased 0.8 percent after an even stronger print in March, up 1.4 percent.
Meanwhile, building material & garden equipment & supplies dealers' sales and food & beverage stores' sales increased 0.4 percent in the month. Motor vehicle & parts dealers' sales disappointed in April, increasing 0.1 percent but after a very strong month in March when it increased 2.1 percent. The weakest sectors in April were food services & drinking places' sales, dropping 0.3 percent, health & personal care stores' sales, down 0.4 percent, sporting goods, hobby, book & music stores' sales, down 0.1 percent, and electronics & appliances stores' sales, down 0.1 percent.
Relatively Strong End of Q1 and Start to Q2 for Control Group
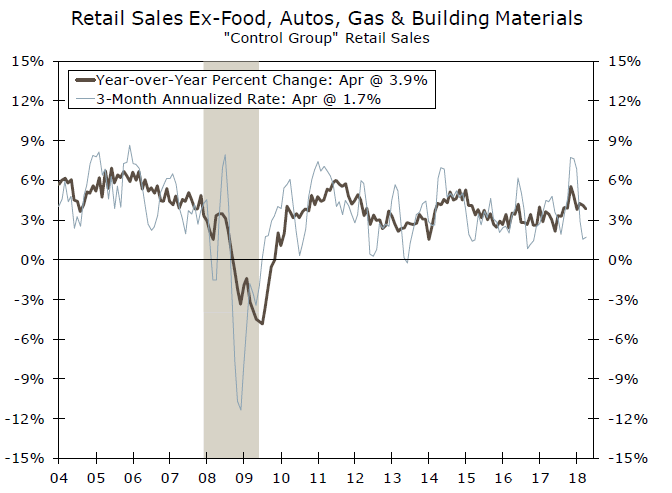
Control group sales, which is the part of retail sales that is used to calculate GDP (bottom figure), was relatively strong in April, up 0.4 percent, while it was upwardly revised from 0.4 percent to 0.5 percent in March. Both results point to a recovery in economic activity at the end of Q1 and at the beginning of Q2. Still, there is some noise from the recent increase in oil and gasoline prices, which will probably bring down the real retail sales numbers.
Furthermore, the Department of Commerce indicated in the release that it will release a revision to monthly retail sales estimates on May 25, 2018. This estimate will include a new sample, new seasonal factors as well as the results of the 2016 Annual Retail Trade Survey. Thus, we will be looking closely at the seasonal factors as these could make a big difference in the revision to Q1 personal consumption expenditures (PCE) estimates. However, for now, the picture for the start of the second quarter is much better than the one we saw at the start of Q1, even with the old seasonal factors.
Sunset Market Commentary
Markets:
The sell-off on core bond markets continued today. They suffered from higher inflation expectations and good US eco data. US Treasuries today underperformed German Bunds. The main move occurred during US trading. April retail sales printed in line with expectations (control group 0.4% M/M), but March readings faced an upward revision. May Empire manufacturing comfortably beat consensus (20.1 from 15.8 vs 15.0 expected). Forward looking details suggest more economic strength in Q2 while inflationary pressures are building. Data keep the possibility of three more US rate hikes this year more than alive and suggest that the US economy could outperform this year thanks to the late cycle fiscal boost. Dallas Fed Kaplan, hawkish non-voter, suggested raising rates towards neutral levels (2.5%-3%) as the Fed met its dual mandate. Within the next year to year and a half, the FOMC should discuss whether it’s necessary to hike them further into restrictive territory. US yields add 2.1 bps (2-yr) to 5.2 bps (10-yr) at the time of writing. The US 10-yr yield is inches away from testing key 3.07% resistance. A sustained break higher implies more upside from a technical point of view, targeting 4% in the medium term. The German yield curve bear steepens with yields 1 bp (2-yr) to 3.2 bps (30-yr) higher.
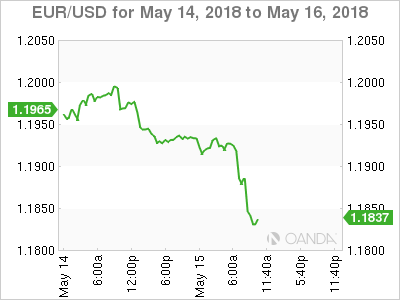
Over the previous days, the dollar rally took a breather especially against the euro. However, several investors apparently considered yesterday’s rejected test of the 1.20 barrier as a signal to enter new USD long positions and, to a lesser extent, to sell the single currency. The EMU eco data were mixed. ZEW investor sentiment was close to expectations and so was EMU Q1 GDP (0.4% Q/Q). German Q1 growth (0.3% Q/Q) disappointed. Even so, the EMU data didn’t prevent a further rise in core yields. The US 2-yr yield set a new cycle top at 2.57%. The US 10-yr yield came ever closer to the key 3.07 % resistance. German bunds suffered, too, but interest rate differentials still widened slightly in favour of the dollar. The rise both of the dollar and of core yields continued after the release of the US retail sales and a good Empire manufacturing survey. EUR/USD dropped further below 1.1850. The 1.1823 correction low is again on the radar. USD/JPY jumped well north of 110 even as US equities came under pressure in the run-up to the opening of cash trading. The pair trades currently in the 110.25/30 area. The dollar remains in the drivers’ seat.
Sterling was sold in the early hours of trading as investors awaited the UK labour data, including the closely watched wage growth data. EUR/GBP jumped temporary to the 0.8815 area. UK job growth was strong, but wage growth was again perfectly in line with expectations at 2.9% Y/Y (ex-bonus measure). The report was good enough to prevent further sterling losses. Later in the session, EUR/GBP even dropped back below the 0.88 mark, but this move was mainly due to EUR/USD selling at that time. Cable dropped to the 1.35 area on broad-based USD strength. In the end, the UK labour report was ok, but it was not strong enough to change market expectations on the timing of a rate hike by the Bank of England.
News Headlines:
In a much anticipated overhaul of the Volcker rule, the Fed and other regulators are planning to drop an assumption written into the original rule that positions held by banks for less than 60 days are speculative -- and therefore banned, the people said. Instead, banks would have leeway to conclude that their trades comply with the rule, putting the onus on regulators to challenge such judgments, the people said. (BB)
Central Europe's economies steamed ahead in the first quarter as rising wages in tightening labour markets propelled household spending, leading to faster-than-expected growth in Poland (1.6% Q/Q) and Hungary (1.2% Q/Q) and still decent expansion in the Czech Republic (0.5% Q/Q). (Reuters)
U.S Retail Sales Advance, while Empire Report Strong Growth
- April Advance U.S retail sales m/m: +0.3% vs. +0.3%e
- Retail sales ex-autos: +0.3% vs. +0.5%e
- Retail sales ex-auto and gas: +0.3% vs. +0.4%e
Americans ramped up spending in April. U.S retail sales rose a seasonally adjusted +0.3% in April.
Digging deeper, spending growth was largely broad-based, with food and beverage stores and clothing and accessories retailers both booking the largest sales gains since 2017. Disappointment was found at restaurants and bars, declining -0.3% m/m.
Gas-station sales rose +0.8% in April m/m, support mostly by the pick up in gas prices.
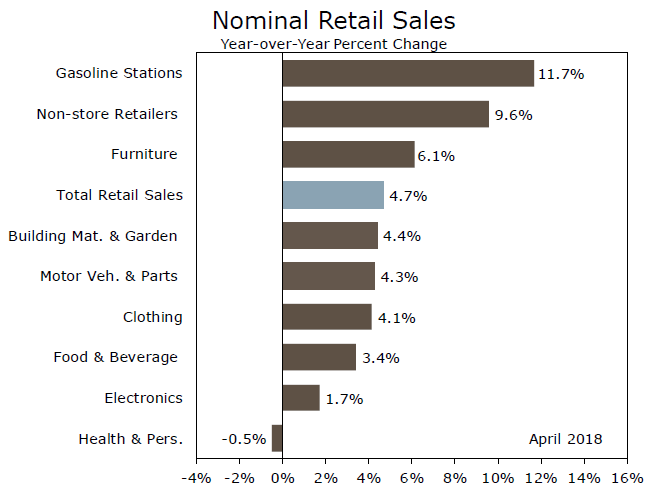
Compared with a year earlier, retail sales were up +4.7% in April, with spending continuing to outpace inflation, with the consumer-price index rising +2.5% in April from a year earlier.
New York manufacturers report strong May growth
The Empire State Manufacturing Survey’s general business conditions index grew to 20.1 in May from 15.8 the previous month. Market expectations were looking for a reading of 15.
Digging deeper, the prices-paid index rose to its highest level in seven years, growing to 54 in May from 47.4 in April, indicating significant input price pressures. The prices-received index increased to 23 from 20.7.
The new orders index rose to 16 from 9, as the shipments index climbed to 19.1 from 17.5, pointing toward ongoing growth in orders and shipments.
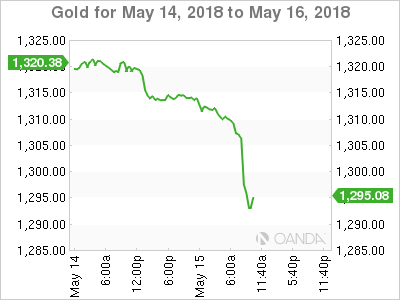
The USD continues to make broad-based gains across the board (€1.1834, £1.3465, ¥110.23 and C$1.2920). U.S 10-year yield continues to back up, +3 bps to +3.054%, while gold trades atop of the key support at $1,304.30
USDJPY – Eventual Break above 200SMA Signals Bullish Continuation
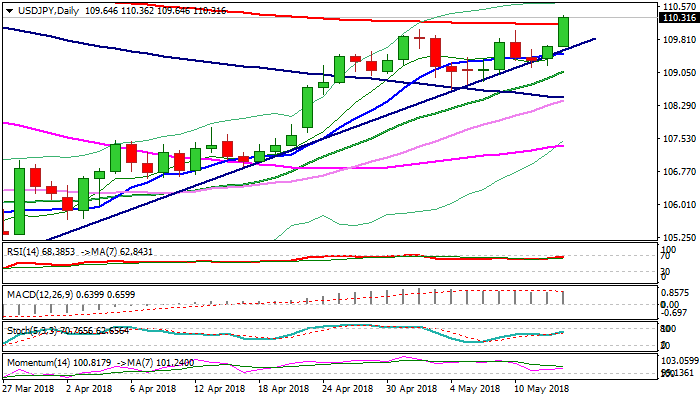
The USDJPY pair eventually broke above strong barriers at 110.00 (psychological / double upside rejection) and 110.15 (200SMA) and cracked Fibo barrier at 110.26 (61.8% of 113.74/104.63 descend) on fresh acceleration of US dollar on rising US yields which broke above 2014 high and solid US retail sales data.
Retail sales rose 0.3% in Apr, more slowly than expected (0.5%) but previous month's figure was revised higher (0.4%).
The dollar bulls maintain pace despite weaker than expected retail sales signaled consumer spending momentum is weaker at the beginning of Q2.
Break above 200SMA and probe above 110.26 Fibo barrier is strong bullish signal which requires confirmation on daily close above these barriers.
Bulls eye initial targets at 110.48 (02 Feb high) and 110.83 (27 Nov low), regain of which would expose barrier at 111.59 (Fibo 76.4% of 113.74/104.63).
Broken 200SMA and former 110 barrier now act as initial supports, followed by bull-trendline at 109.66.
Res: 110.48; 110.83; 111.00; 111.59
Sup: 110.15; 110.00; 109.66; 109.46
EUR/USD Mid-Day Outlook
Daily Pivots: (S1) 1.1903; (P) 1.1950 (R1) 1.1975; More....
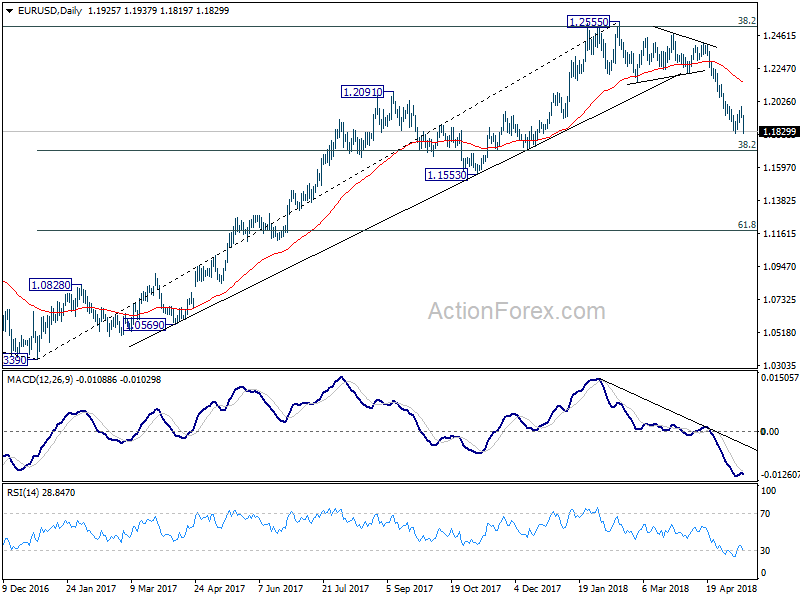
EUR/USD drops to as low as 1.1819 so far today. Breach of 1.1822 indicate that recovery from there has completed at 1.1995 already. And larger decline from 1.2555 is resuming. Intraday bias is back on the downside for 1.1708 medium term fibonacci level next. Break will target 1.1553 support. On the upside, break of 1.1995 resistance is needed to indicate short term bottoming. Otherwise, outlook will remain bearish in case of recovery.
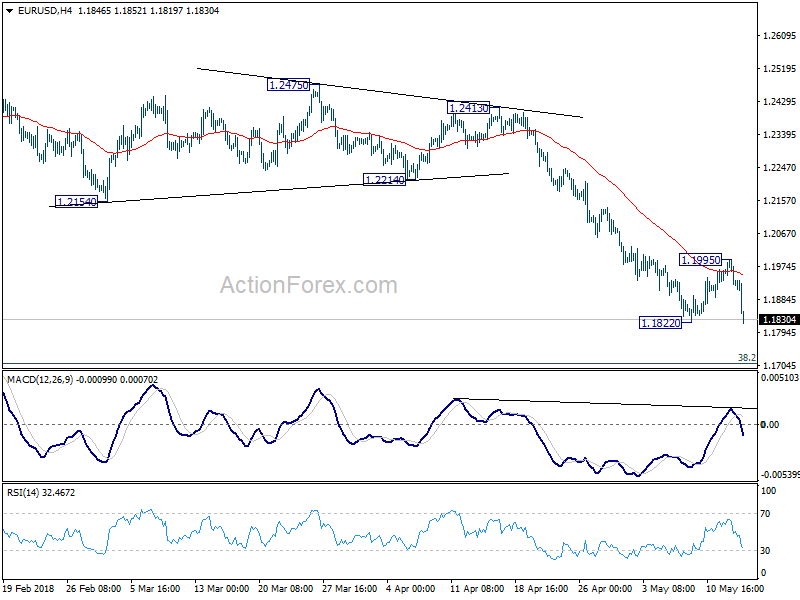
In the bigger picture, current development suggests that EUR/USD was rejected by 38.2% retracement of 1.6039 (2008 high) to 1.0339 (2017 low) at 1.2516. And, a medium term was formed at 1.2555 already. Decline from there should extend further. Break of 38.2% retracement of 1.0339 to 1.2555 at 1.1708 will target 61.8% retracement at 1.1186. For now, even in case of rebound, we won't consider the fall from 1.2555 as finished as long as 55 day EMA (now at 1.2162) holds.