Sample Category Title
Australia plans to return to budget surplus earlier, but S&P said risks are significant
In the 2018 Budget announced today, Australian Treasurer Scott Morrison plotted the path to return to balance in fiscal 2019/20, and turn into AUD 22b surplus in fiscal 2020/21. The move is welcomed by S&P Global Ratings. But the negative outlook on Australia's AAA sovereign ratings is maintained.
S&P said in a statement after the budge release that "the budgetary position has improved over the past year, aided by strength in the Australian and global economies. " Also, "the government has also shown a commitment to fiscal prudence with its plan to return a balanced budget earlier than previously announce." Such developments helped "ease the negative pressures on the Australian sovereign ratings."
However, "risks to the country's fiscal outlook remain, including increasing external economic uncertainties in recent months. Global trade tensions, coupled with rising investor aversion to emerging markets in recent months, may dampen economic growth among Australia's key trading partners."
And, "risks to the government's plan for an earlier return to budget surpluses are significant. The outlook on the long-term Australian sovereign ratings remains negative for now to reflect these uncertainties."
USD/CHF Steep Rise
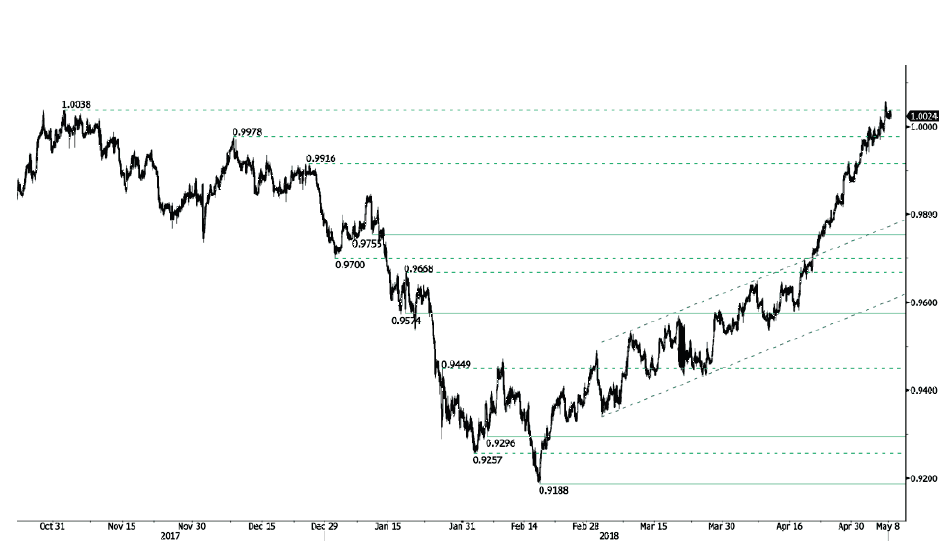
USD/CHF bullish pattern pauses after reaching 1.0056, breaking hourly resistance at 1.0038 (01/11/2018). The pair is heading along the 1.0015 range. The bullish pattern started from 0.9188 (16/02/2018 low) is maintained. Hourly resistance given at 0.9755 (10/01/2018 low) and 1.0038 (01/11/2017 high). The technical structure suggests short-term decrease.
In the long-term, the pair is still trading in range since 2011 despite some turmoil when the SNB unpegged the CHF. Key support lies at 0.9072 (07/05/2015 low) while resistance at 1.0344 (15/12/2016 high) is distanced. The technical structure favours a long term bullish bias since the unpeg in January 2015
USD/JPY Maintained At The 109 Range
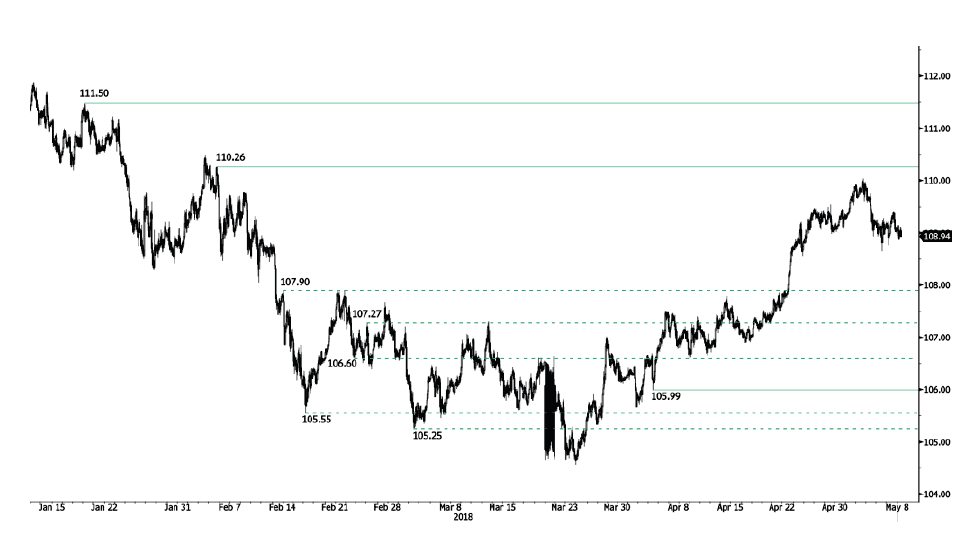
USD/JPY is trading sideways after bouncing off from104.56 (25/03/2018 low), currently decreasing below 109 and heading along the 108.85 range. The bearish pattern started in January 2018 is weakening. Hourly support and resistance are given at 105.99 (04/04/2018 high) and 110.26 (05/02/2018 low). The short-term technical structure suggests short-term downward moves.
We favor a long-term bearish bias. Support remains at 101.20 (09/11/2016 low). A gradual rise toward the major resistance at 125.86 (05/06/2015 high) seems unlikely. Expected to decline further support at 101.20 (09/11/2016 low). The pair trades below its 200 DMA
GBP/USD Approaching 1.36
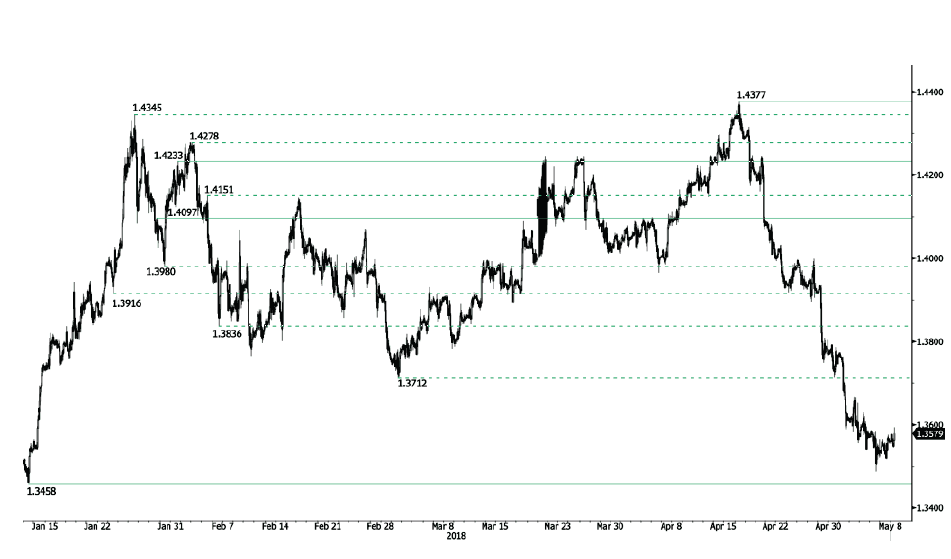
GBP/USD is increasing, trading below 1.36 and heading along the 1.3595 range. The pair is currently trading at mid-January 2018. Hourly support and resistance are given at 1.3458 (11/01/2018 low) and 1.4097 (29/01/2018 high). The technical structure suggests short-term increase.
The long-term technical pattern is reversing. The Brexit vote had paved the way for further decline but the pair is moving to 2016 highs. Long-term support and resistance are given at 1.1841 (07/10/2017 low) and 1.5018 (24/06/2016 high).
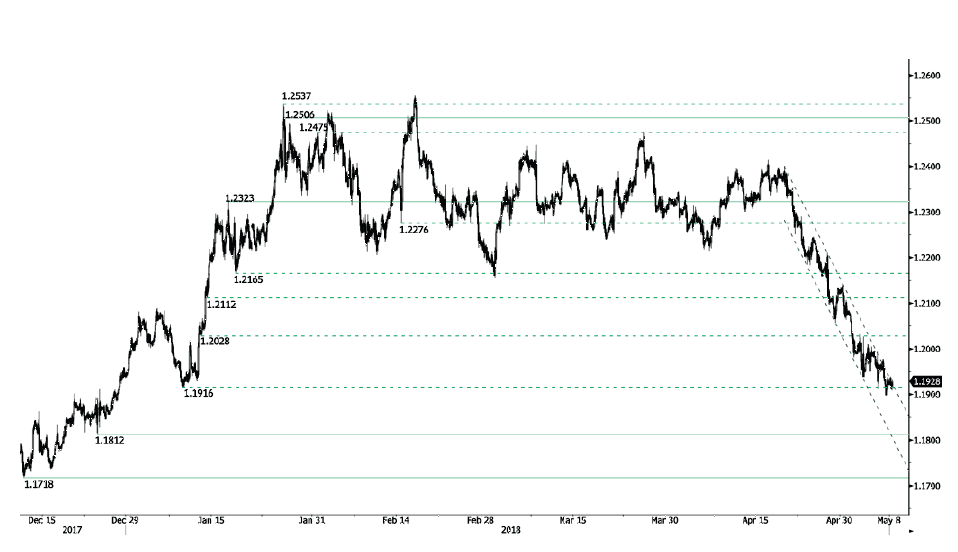
EUR/USD Slight Increase
EUR/USD bearish pattern started from 1.24 (19/04/2018 high) pauses after reaching 1.1898, currently trading at 1.1930 and heading along the 1.1940 range. The pair is currently trading at mid-January 2018 low. Hourly support and resistance are given at 1.1812 (25/12/2017 low) and 1.2323 (17/01/2018 high). The technical structure suggests short-term upward moves.
In the longer term, the momentum is turning largely positive. We favor a continued bullish bias. Key resistance is holding at 1.2886 (15/10/2014 high) while strong support lies at 1.1554 (08/11/2017 low).
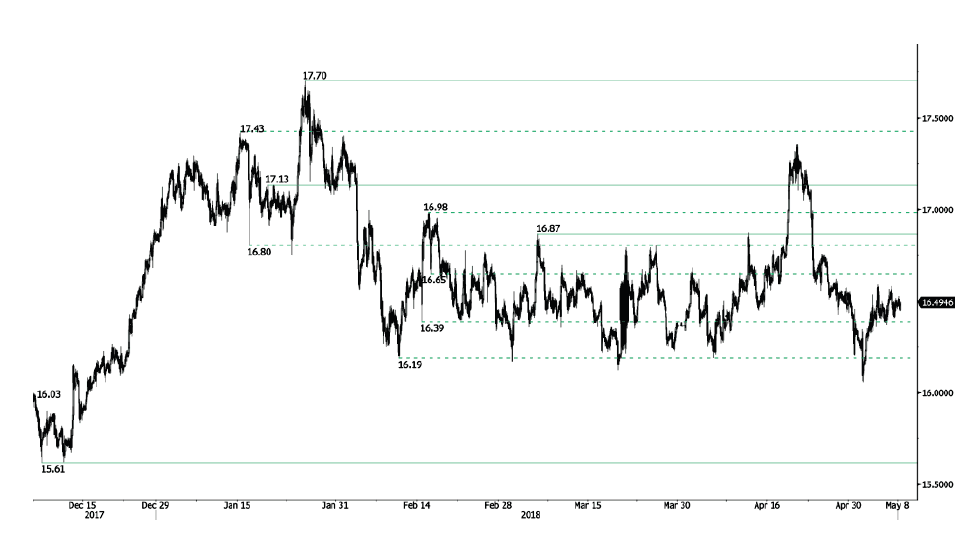
Silver Heading Higher
Silver is increasing, currently trading at 16.50 and heading along the 16.55 range. Hourly support and resistance are given at 16.03 (05/12/2017 low) and 16.87 (06/03/2018 high). The technical structure suggests short-term increase.
In the long-term, the trend remains negative/ sideways. Further downside is very likely. The pair is trading below its 200 DMA. Resistance is located at 21.58 (10/07/2014 high). Strong support can be found at 11.75 (20/04/2009).
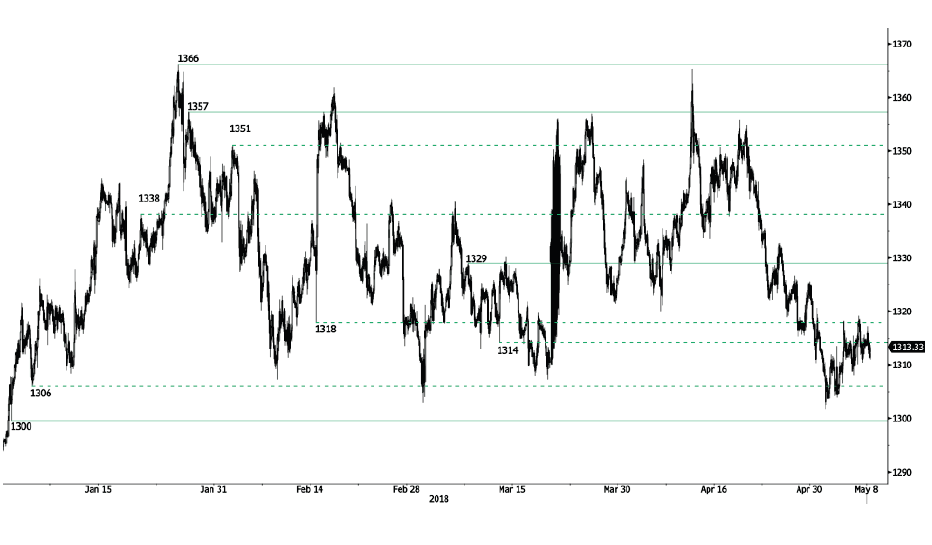
Gold Trading Sideways
Gold is starting a bearish consolidation following recent rise at 1319, heading along the 1311 range. Hourly support and resistance are given at 1300 (29/12/2017 low) and 1329 (08/03/2018 high). The technical structure suggests short-term sideways trading moves.
In the long-term, the technical structure suggests that there is a growing upside momentum. A break of 1'392 (17/03/2014) is required to confirm it. A major support can be found at 1'045 (05/02/2010 low
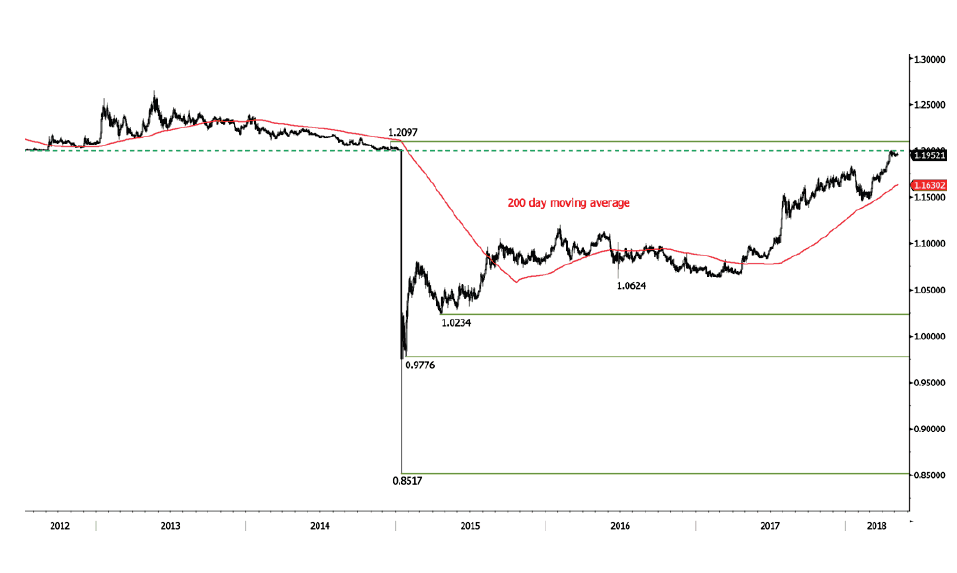
EUR/CHF Neutral
EUR/CHF is pausing, trading at 1.1955. Strong resistance at 1.20 remains. Hourly support given at 1.1842 (11/04/2018 low) is distanced. The short-term technical structure suggests further short-term sideways trading moves.
In the longer term, the technical structure has reversed. Strong resistance at 1.20 (level before the unpeg) is now at reach. The ECB's slowing QE program is likely to cause buying pressures on the euro, which should weigh in favour of the EUR/CHF. Support and resistance can be found at 1.0624 (24/06/2016 low) and 1.2097 (18/12/2014 high).
EUR/GBP Trading Below 0.88
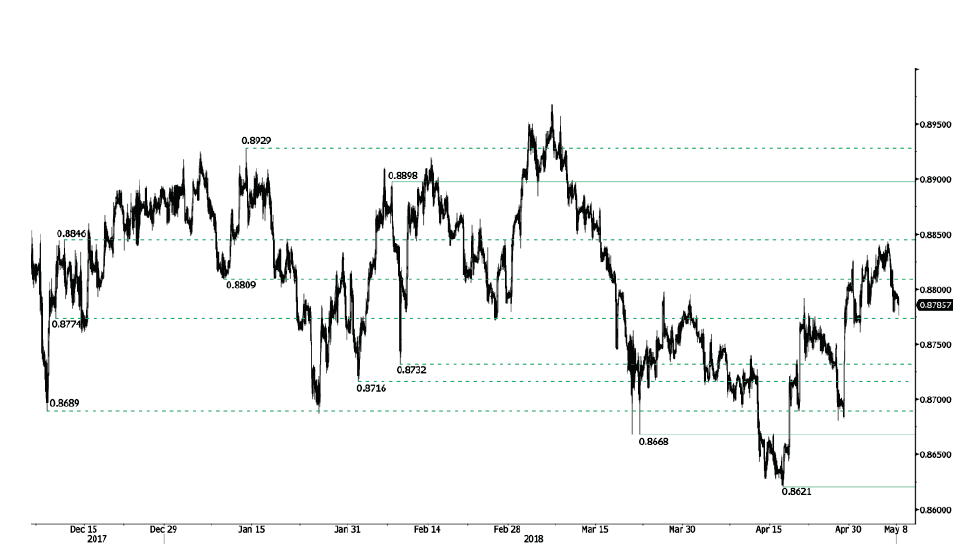
EUR/GBP is decreasing further after reaching 0.8843 high, heading along the 0.8775 range. EUR/GBP bearish pattern started in March is weaker. Hourly support and resistance are given at 0.8668 (22/03/2018 low) and 0.8898 (07/02/2018 high). The technical structure suggests further short-term downward moves.
In the long-term, the pair has largely recovered from 2015 lows. The technical structure suggests further upside pressure. Strong resistance can be found at 0.9500 (psychological level) while support remains at 0.8304 (05/12/2016 low). The pair is trading below its 200 DMA
Bitcoin Trading Above 9300
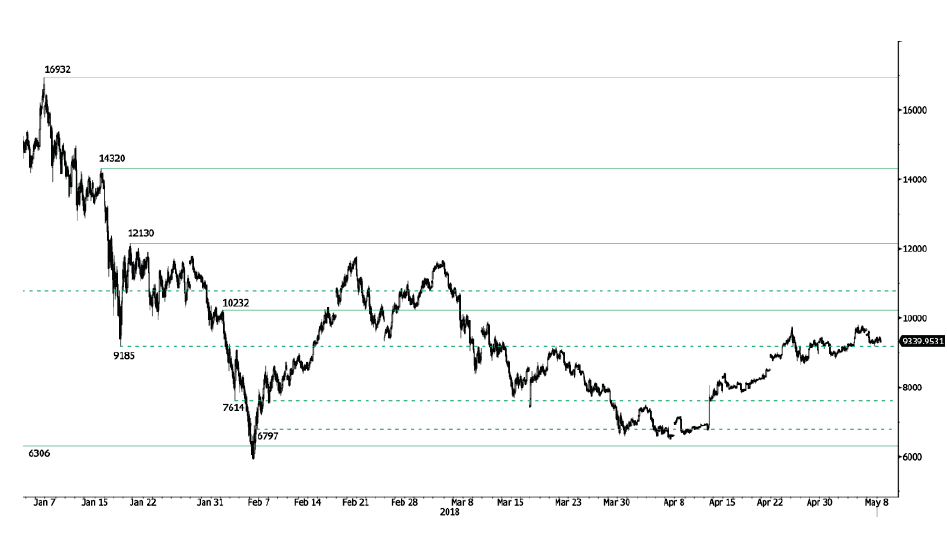
Bitcoin rise started in mid-April pauses, the pair is currently maintained at the 9300 range, heading along 9270. Bitcoin bearish pattern started in March 2018 weakens. The pair is contained between hourly support and resistance given at 6306 (13/11/2017 low) and 10232 (01/02/2018 high). The technical structure suggests short-term decrease.
In the long-term, the digital currency has had an exponential growth but also presented important downturns. There is decent likelihood that the currency could stabilize between 7'000 - 12'000 in 2018. Bitcoin is trading slightly above its 200 DMA (8300 range).