Sample Category Title
Dollar Index Breaks 93 Key-Level Ahead Of Trump’s Nuclear Decision
Here are the latest developments in global markets:
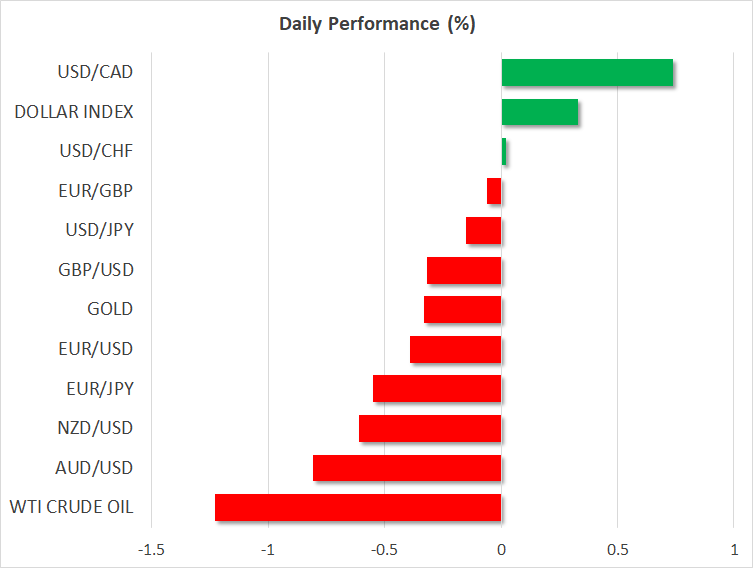
FOREX: The euro extended its losses against the dollar early in the European session as investors shorted their positions on the currency amid uncertainties surrounding the Eurozone's economic performance, sending euro/dollar to a fresh 4-month low of 1.1870 (-0.41%). Pound/dollar was also on the back foot, slipping to 1.3509 (-0.35%) after the British Halifax house price index fell by more than expected on a monthly basis. Brexit risks were pressuring the pair as well, while analysts were eagerly waiting for BoE policymakers to cancel the planned rate hike on Thursday. Dollar/yen was marginally lower at 108.96 (-0.10%), while the dollar index managed to crawl slightly above the 93 key-level (+0.34%) ahead of Trump's announcement on the 2015 Iran nuclear deal later today which could add some volatility to the dollar pairs. Regarding the latest news on the latter, Russia threw a warning today, saying that “any changes to the deal could have negative consequences”. Dollar/loonie was the best performer, advancing to a six-week high of 1.2985 (+0.77%). On the other hand, the antipodean currencies shrugged off upbeat Chinese trade data released during today's Asian session and stretched lower, with aussie/dollar tumbling to an 11-month low of 0.7451 (-0.82%) and kiwi/dollar hitting a 4-month trough of 0.6974 (-0.61%). Inflation worries in Turkey draw the Turkish lira to a new record low.
STOCKS: The pan-European STOXX 600 and the blue-chip Euro STOXX 50 opened lower on Tuesday, being down by 0.15% and 0.21% respectively at 1100 GMT, with energy sectors dragging down the indices. The German DAX 30 retreated by 0.51% weighed by worse-than-expected Q1 earnings delivered by the German postal and logistics group Deutsche Post DHL. The French CAC 40 lost 0.43%, while the Italian FTSE MIB 100 declined by 2.24% as the third round of coalition talks in Italy failed, signaling that fresh elections could take place as soon as July 8th. The British FTSE 100, on the other hand, was in positive territory, gaining 0.11% after the Japanese company Takeda Pharmaceutical agreed to buy the London-listed Shire and Unilever announced the start of a 6 billion share buyback scheme. Futures tracking US stock indices were flashing red, pointing to a negative open.
COMMODITIES: Oil prices were under pressure ahead of Trump's announcement on whether he would pull out of the 2015 Iran nuclear deal or reimpose sanctions on Iran today at 1800 GMT; four days earlier than previously scheduled. If the US president withdraws the US from the agreement after France and Germany failed to persuade him not to engage in such an action, oil prices could bounce up towards yesterday's 3 ½ -year highs. However, since this scenario is already priced to some extend in the markets, a rebound in prices could be softer than a downfall if Trump unexpectedly decides to stay in the accord. Meanwhile, Iran's oil exports surged near to recent record highs in April. WTI crude and the London-based Brent were last seen at $69.82 (-1.29%) and $75.41 (-1.00%) per barrel respectively. In precious metals, gold was weaker at $1,310.13 (-0.29%) per ounce.
Day Ahead: Trump's announcement on Iran nuclear deal in focus; US JOLTs job openings pending
Later today all eyes will turn to the US President Donald Trump who is anticipated to announce at 1800 GMT whether he will stay in the so-called Joint Comprehensive Plan of Action signed also by Iran, the UK, France, Germany, Russia, and China back in 2015 to ease sanctions on Iran in exchange for control over its nuclear program. The market chatter supports that the US president will likely pull the US out of the accord negotiated under Obama's presidency, bringing another headache to global markets. But his plans to renew sanctions against Iran could take time to implement as those would affect trade actions between Europe and Iran. While this has already being priced in to some extend by the markets, an unexpected decision by Trump to renew the agreement could cause a larger decline in oil prices.
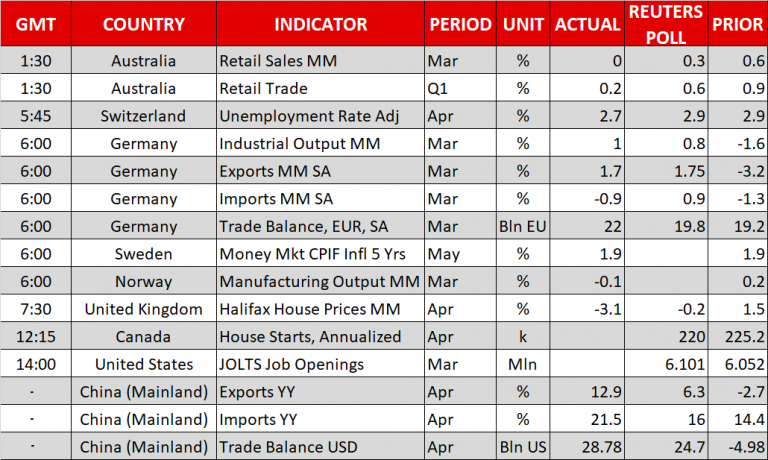
Economic releases during the day will be light. Canada will see the release of housing starts for the month of April at 1315 GMT, while the US JOLTs job openings will be attracting the most interest at 1400 GMT. Particularly, the report published by the Bureau of Labor Statistics is expected to show that 6,101 million positions opened in March compared to 6,052 million seen in the preceding month.
In energy markets, investors will be waiting for the API weekly report at 2030 GMT to indicate the change in US crude oil stocks, after the aggressive run in oil prices on Monday.
At 2245 GMT, New Zealand will publish figures on electronic card retail sales; kiwi traders could face some volatility. Month-on-month electronic card retail sales are forecasted to show no growth in April after an expansion of 1.0% in the previous month.
In equities, Walt Disney and Nvidia are two of the companies releasing results this week, on Tuesday and Thursday respectively.
Markets Brace For Trump’s Iran Decision, Gold Dips
It could be said that there is a cautious vibe across the financial markets on Tuesday, as investors brace for President Donald Trump's announcement on the Iran nuclear deal later today.
Asian shares were mostly higher as Chinese trade data exceeded estimates, while European stocks edged lower amid the cautious trading mood.
Although President Trump is widely expected to withdraw the United States from the 2015 nuclear deal, lessons fromthe past have repeatedly taught investors that the US administration can be highly unpredictable.
An unexpected scenario, in whichTrump announces that the US willremain in the nuclear deal,should be warmly welcomed by investors. Alternatively, risk aversion may intensify if he moves forward with the “nuclear option”, which reimposes all sanctions on Iran and pulls the US out of the deal.Whatever the outcome of Trump's “decision”,we are not ruling out ramifications on the financial markets. Global stocks, Oil and safe-haven assets are just a few of the instruments that could be impacted.
Oil markets wait for Trump
WTI Crude eased slightly lower on Tuesday, with prices dipping towards $69.80 as investors positioned themselves ahead of Donald Trump's Iran announcementlater today.
WTI bulls could be injected with fresh inspiration to boost oil prices higher, if Trump withdraws from the nuclear agreement.
Taking a look at the technical picture, WTI Crude remains bullish on the daily charts. There have been consistently higher highs and higher lows while the MACD trades to the upside. A solid daily close above $70.00 could encourage an incline higher towards $71.00. Alternatively, a failure for bulls to keep prices above $70.00 could encourage a decline to $69.00.
Currency Spotlight – USDJPY
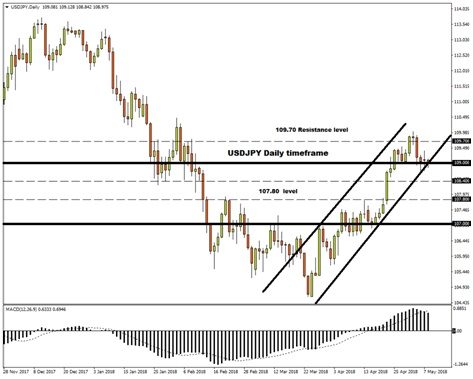
The USDJPY could be injected with explosive levels of volatility today depending on how markets react to Donald Trump's pending announcement. If risk aversion intensifies following Trump's “decision” on the Iran deal, the flight to safety could boost the Japanese Yen. Focusing on the technical picture, the USDJPY is firmly bullish on the daily charts. Prices are trading within a daily bullish channel while the MACD has crossed to the upside. Prices have scope to challenge the 109.70 level, if bulls are able to defend 109.00. Alternatively, a breakdown below 109.00 could invite a decline towards 108.40 and 107.80.
Commodity spotlight – Gold
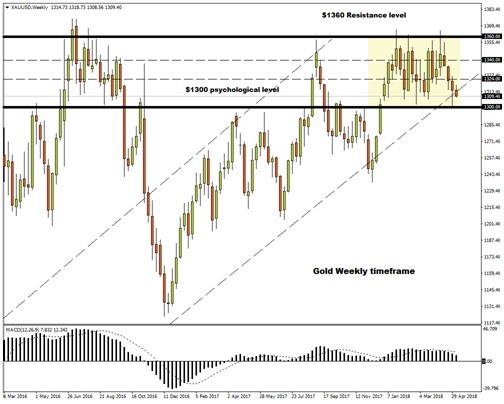
An appreciating US Dollar has punished Gold today, with prices sinking towards $1309 at the time of writing.
The fact that the yellow metal remains under pressure despite market caution ahead of Trump's announcement highlights a lack of buying sentiment. There is a suspicion that market expectations of higher US interest rates will remain a risk to Gold.
Taking a look at the technical picture, prices are coming under increasing selling pressure on the daily and weekly charts. Previous support around $1324 could transform into a dynamic resistance that encourages a decline towards the psychological $1300 support level
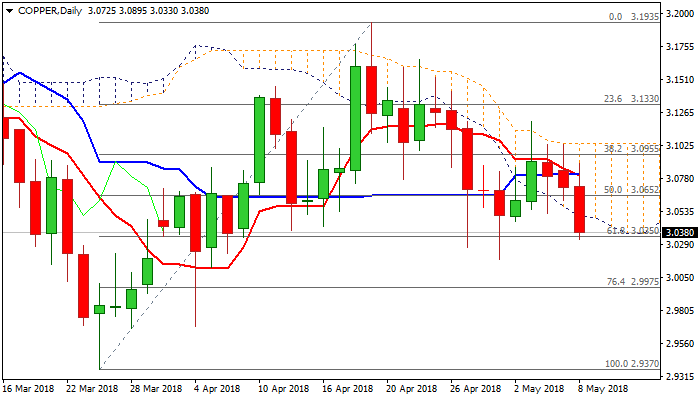
Copper Accelerates Lower And Breaks Below Thick Daily Cloud
Copper price accelerated lower on Tuesday, holding in red for the third straight day and emerged below daily cloud, in which the price was stuck in few previous sessions.
Fresh weakness extended to one-week low at $3.0330 and cracked strong support at 3.0350 (Fibo 61.8% of $2.9370/$3.1935 and opening way for retest of 01 May spike low at $3.0185, to mark full retracement of $3.0185/$3.12 upleg.
The notion is supported by bearish signal on break below daily cloud, with daily close below $3.0350 Fibo support to re-confirm bearish signal.
Moving Averages turned to full bearish setup on daily chart (10/30 bear-cross and 20/200 death-cross are forming), while 14-d momentum is in steep fall and maintains pressure.
Extension below $3.0185 would also complete failure swing pattern on daily chart and unmask key sort-term support at $2.9370 (26 Mar low).
Broken cloud base marks initial barrier at $3.0500, while a cluster of converged MA’s marks strong resistances within $3.0760/$3.0960 zone.
Res: 3.0500, 3.0573, 3.0693, 3.0760
Sup: 3.0330, 3.0185, 3.0000, 2.9975
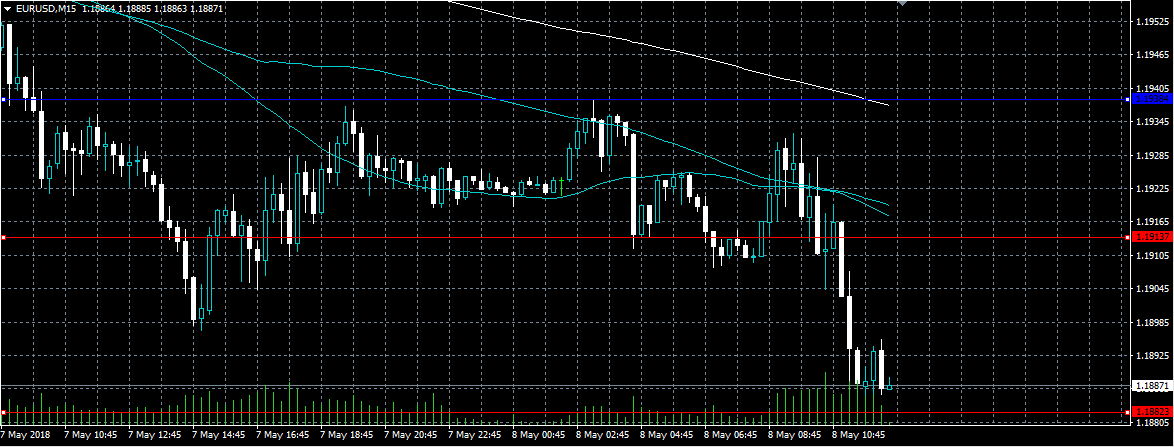
EURUSD Heading Towards 1.1800 Level
The euro has fallen to a fresh monthly trading-low against the greenback this morning, hitting 1.1882, after the U.S dollar index resumed its recent breakout move to the upside. The EURUSD pair currently trades close to the lows of the day, after being sold aggressively from the 1.1930 level during the European trading session. Traders now look towards the 93.00 level on the U.S dollar index, and the release of U.S Job Openings data.
The EURUSD pair remains bearish while trading below the 1.1938 level, further losses towards 1.1860 and 1.1800 seem likely.
If the EURUSD pair starts to trade back above the 1.1938 level, intraday buyers may test towards the 1.1978 and 1.2000 resistance levels.
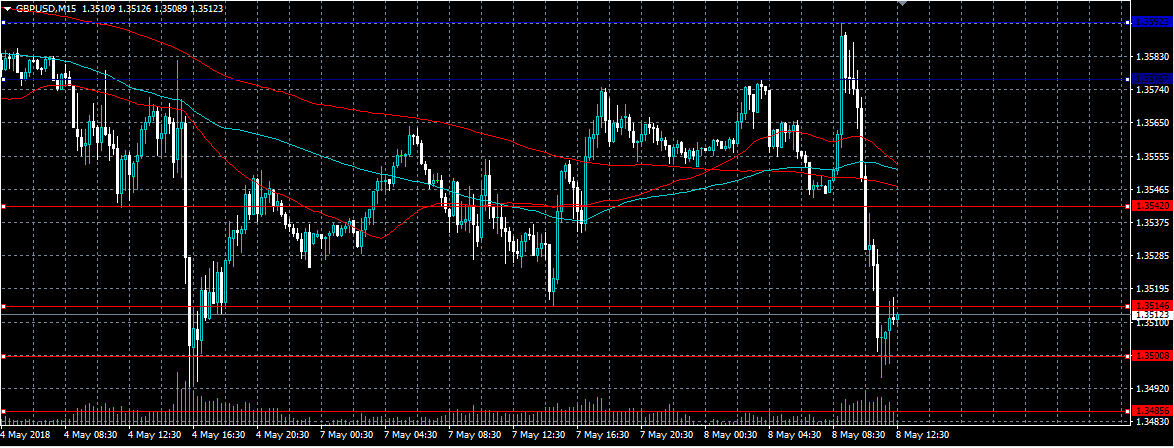
Pound Sold As The U.S Dollar Moves Higher
The British pound has sold-off sharply against the greenback during the European trading session, after the U.S dollar index strengthened towards fresh 2018 trading highs. The GBPUSD pair had climbed to an intraday high of 1.3592, but quickly reversed lower back towards the 1.3500 level after the U.S dollar index firmed broadly. We have also seen further weak data from the United Kingdom economy this morning, with monthly UK house prices tumbling, ahead of Thursday’s BOE meeting.
The GBPUSD pair is now intraday bearish while trading below the 1.3542 level, further losses towards 1.3485 and 1.3460 seem likely.
If the GBPUSD pair can move back above the 1.3542 level, buyers may be encouraged to test back towards the 1.3576 and 1.3592 levels.
EUR/USD Bounces Off 1.19
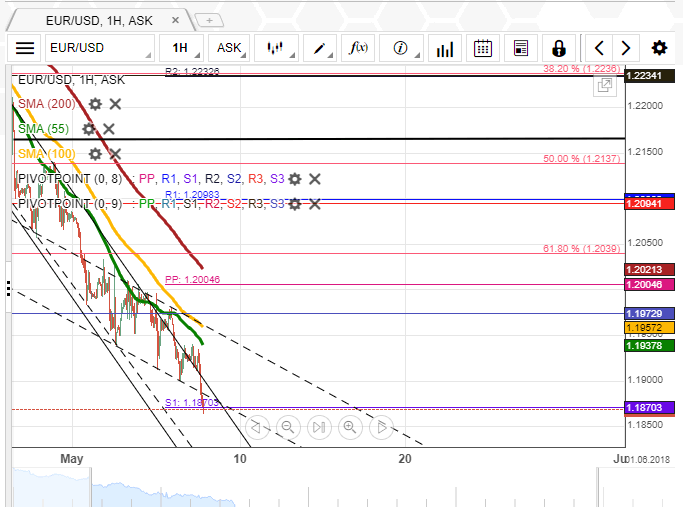
After failing to surpass the resistance of the 55– and 100-hour simple moving averages, the common European currency went for another decline against the US Dollar on Monday. The pair, however, failed to fall below the psychological 1.19 mark, thus providing the second confirmation of a five-day descending channel.
As apparent on the chart, this pattern has altered the rate's steep fall during the previous two weeks. This might point to a possible medium-term recovery starting later this week. In order to edge higher today, the Euro has still to overcome the aforementioned SMAs near 1.96.
Given that the Fed Chief Powell and the US President Trump are to speak today, the rate might push as high as the 1.2000/30 area, while a breakout from the weekly S1 should result in a test of 1.18.
GBP/USD Expected To Surge If Resistance Is surpassed
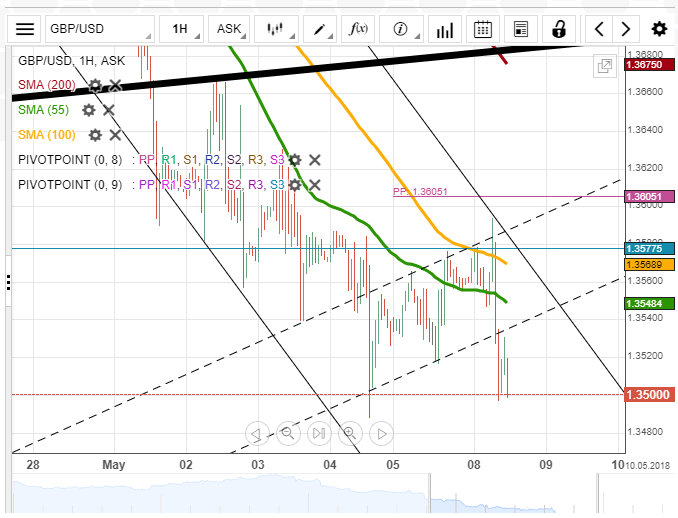
GBP/USD continues to trade sideways for the fifth consecutive session. It seems that the pair has been trying to edge higher during this time, especially considering its failure to plunge after a breakout of the long-term channel last week. However, this expected appreciation is restricted by the combined resistance of the 55– and 100-hour SMA near 1.3560. The weekly PP is likewise located nearby.
It is likely that the Pound tries to push higher during the first part of the day. Even if an upside breakout does not occur today, a surge should follow during the following sessions.
Today's trading range is likely to be wide due to fundamentals. Bullish gains should be capped near the 200-hour SMA at 1.37, while the nearest support is provided by the distant weekly S1 at 1.3417.
USD/JPY Lingers Near Seven-Week Channel
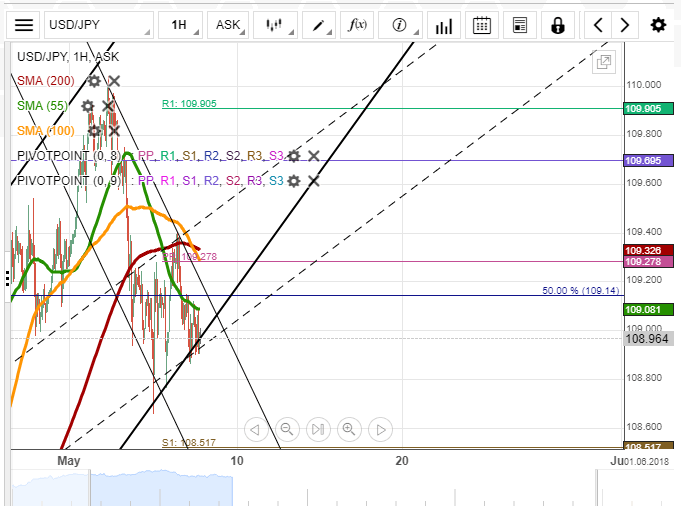
Despite attempts to edge higher during the previous two trading sessions, the US Dollar failed to overcome the 200-hour SMA and thus entered a minor period of consolidation. This has resulted in the formation of a short-term ascending channel (drawn with dashed lines). The downside limit during this time has been provided by a seven-week channel up.
Early on Tuesday, the Greenback was restricted by the combined resistance of the 55-hour SMA and the 50.0% Fibonacci retracement at 109.15. If this level is surpassed, another strong barrier—the 100– and 200-hour SMAs—are limiting an advance above 109.40. In terms of support, the weekly S1 is located at 108.50.
Technical indicators are rather indecisive for this session, suggesting that the general direction of the pair could remain sideways in this session if no fundamentals disrupt this assumption.
XAU/USD Floats In Between SMAs
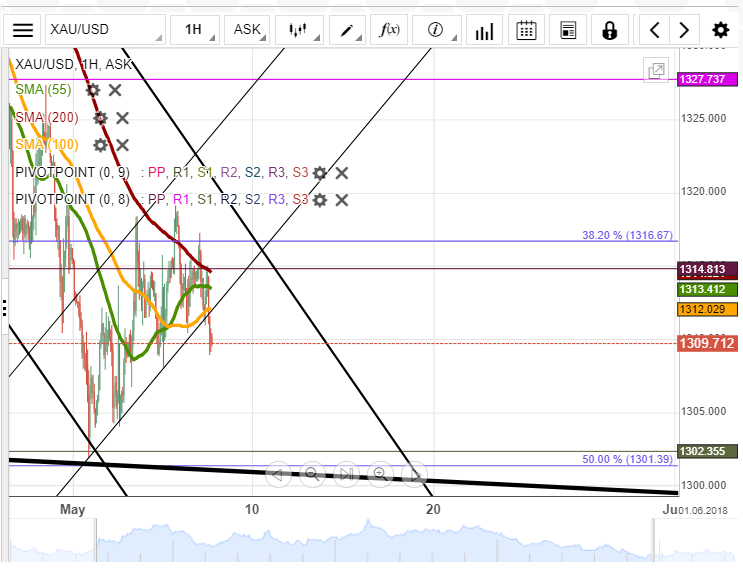
Gold's three-day appreciation against the US Dollar was stopped by the 200-hour SMA and the 38.20% Fibonacci retracement on Monday. As a result, the pair failed to form a higher high and reach the upper boundary of a short-term channel near 1,322.00.
Its movement yesterday was stranded in between two moving averages. The narrowing of the trading range does suggest that a breakout should occur soon, and it is likely that the direction of this move dominates the yellow metal during the remaining session.
Technical indicators favour a bearish breakout that should send the rate towards the senior channel and the 50.0% Fibo at 1,300.00. In case a bullish scenario occurs, Gold is expected to test the weekly PP at 1,331.00 within the following two trading sessions.
Forex Analysis: S&P 500 And Nasdaq 100
U.S. equity indices started the week on a positive note, supported by energy stocks which benefited from the rise in crude oil prices. U.S. WTI crude oil pushed above $70, as markets await President Trump’s decision on a possible U.S. withdrawal from a deal giving Iran relief from sanctions in return for stopping its nuclear weapons development program. U.S equity indices have also been boosted from a rally in Apple shares to new all-time highs, as Warren Buffett revealed that Berkshire Hathaway added 70m shares in the first quarter, taking their holding to 240m. Apple has also launched a $100bn share buyback plan. A number of influential companies will be reporting earnings this week including Walt Disney today and Nvidia on Thursday.
S&P 500
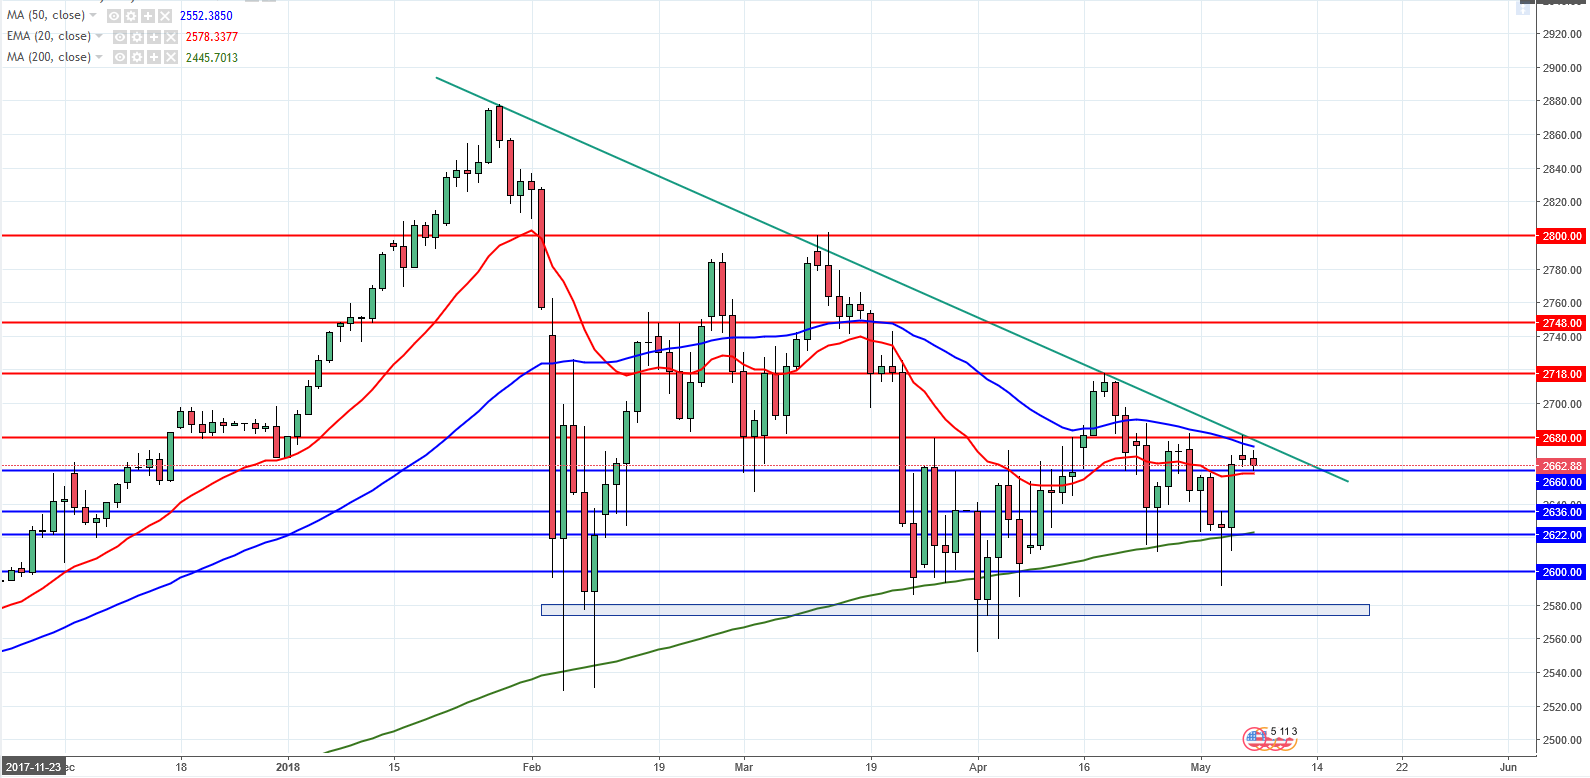
On the daily chart, the S&P500 (SPX) is continuing to trade below the descending resistance trend line from the highs in December. A break below support at 2660 will see further declines towards the 50% retracement near 2636, followed by another test of the 200MA at 2622. A bullish continuation and break of 2680 will likely see a push towards 2800, with resistance at 2718 and 2748.
Nasdaq 100
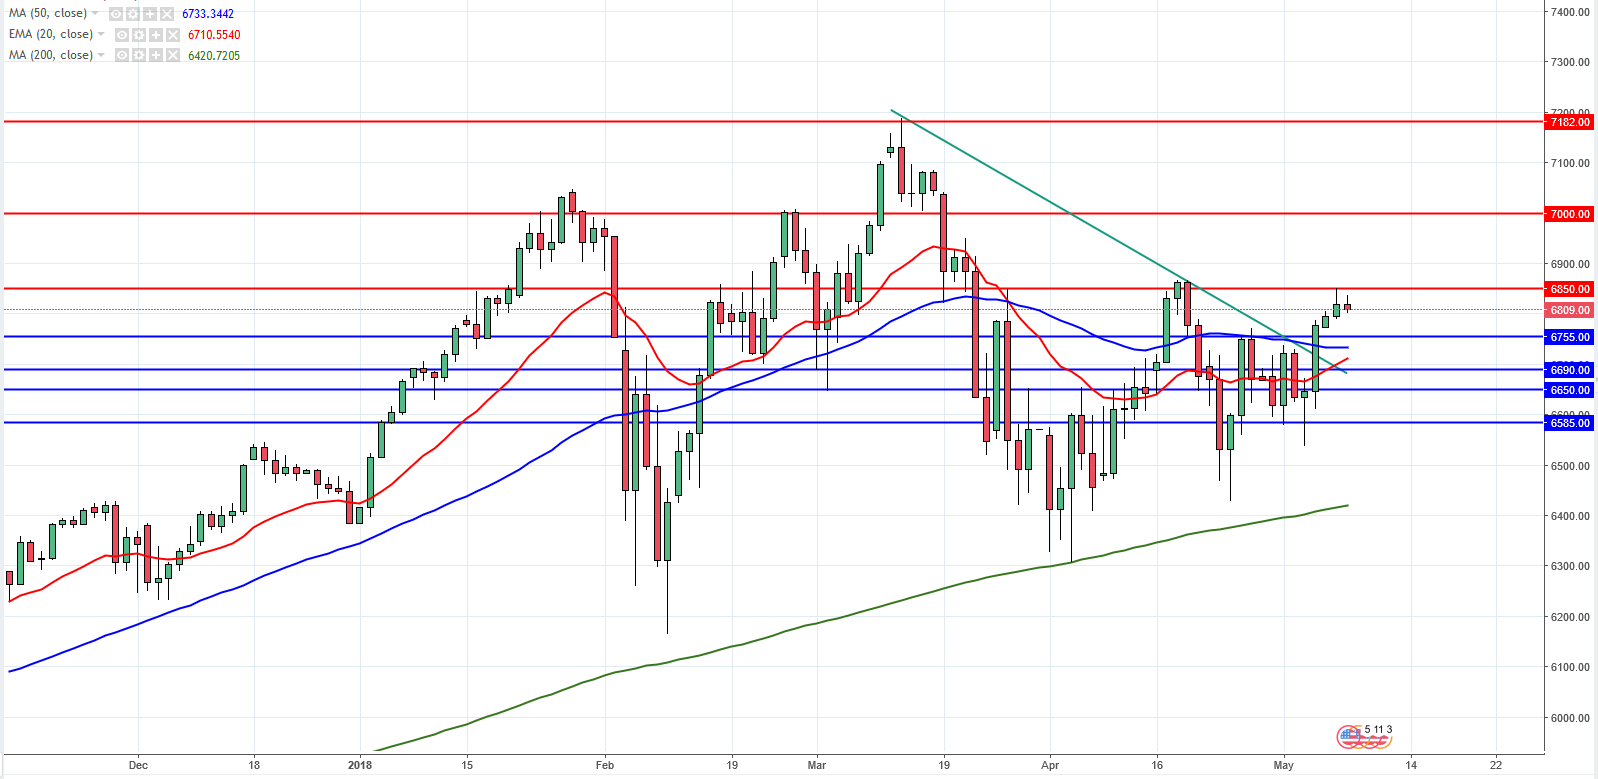
On the daily chart, the Nasdaq 100 (NDX) has broken a falling resistance trend line from the highs in March and is stalled at the 61.8% retracement level at 6850. A bullish break of 6850 could see the NDX aim for all-time highs, with major Fibonacci and horizontal resistance at 7000. However, a reversal will find support at 6755 and then at the trend line and 50% retracement of the bullish move from May 3, near 6690.