

Sample Category Title
China trade surplus at USD 28.8B, YTD imports from EU jumped 20.1%
In USD term, China's exports rose 12.9% yoy to USD 200.4B in April. Imports rose 21.5% yoy to USD 171.6B. That gave to USD 28.8B in trade surplus. Year-to-date, exports rose 13.7% yoy to USD 745.7B, imports rose 19.6% to USD 668.9B, resulting in USD 76.8B in trade surplus.
Year-to-date, exports to the US rose 13.9% yoy to USD 135.9B while imports rose 11.6% yoy to USD 55.6B, resulting in USD 80.3B in surplus. That is, comparing with same period in 2017, China's trade surplus to the US rose 15.6% yoy.
Year-to-date, exports to the EU rose 12.9% yoy to USD 121.9B while imports rose 20.1% yoy to USD 86.3B, resulting in USD 35.6B in surplus. That is, comparing with same period in 2017, China's trade surplus to the EU dropped -1.4% yoy.
Also, year-to-date from January through April, total trade with the US rose 13.2% to USD 191.6B. Total trade with the EU rose 15.8% to USD 208.2B.
Details in this page. In simplified Chinese, but google translate can do the job on tables pretty well.
ECB Smets: Economic expansion continuing at a robust pace
Despite a soft batch of Eurozone data ECB Governing Council member Jan Smets remained optimistic. He said in a WSJ interview that "the latest data remain pretty consistent with the story of the economic expansion continuing at a robust pace."
And the central bank would be ready to phase out the EUR 30b per month asset purchase program later this year. Instead, Smets said ECB would turn the policy focus toward communicating on interest rates.
Reuters reported sources saying the ECB policy would not want to upset market expectations. That is, investors are expecting the asset purchases to end this year and there would be finally a rate hike towards the middle of 2019.
Market Morning Briefing: Dollar Index Has Breached The 92.5 Level
STOCKS
Dow (24357.32, +0.39%) has moved up and traded in the green yesterday. Looking at the 3-day candle chart the fall from levels just below 26800 in Jan’18-end to current levels has been a corrective phase and the trade region has been in a contraction mode. Now the Dow trades in the last phase of the contraction and could spend some time in the 24500-23200 region before starting a fresh upward rally in the medium term. While near term looks sideways ranged, the index could be preparing for a sharp upmove to begin soon.
Dax (12948.14, +1.00%) seems to be holding well above the 12700 support and looks bullish for the near to medium term targeting higher levels of 13200-13400. Near term trend is up.
Nikkei (22536.40, +0.31%) has not been able to move above 22600 and is stuck at the resistance levels. Trading near important levels, a break above 22600 could take it higher towards 23000+ levels while a rejection could drag it down to 22000 or lower.
Shanghai (3151.87, +0.49%) has again moved up to test 3150. A sustained rise from here is needed to take the index higher towards 3200; else another dip back towards 3100-3050 is possible. A break above 3150 could negate a immediate fall back towards 3050.
Nifty (10715.50, +0.92%) saw a short dip to 10600 before rising from there yesterday. While 10600 acts as a decent immediate support, the index could again head back to higher levels of 10800 over today and tomorrow. Immediate view is bullish.
COMMODITIES
News states Trump to have tweeted on Monday about announcing his decision on Iran at 2pm on Tuesday. While the market awaits the decision, Brent (75.52) dipped from levels near 76.34 while WTI (69.98) is down from 70.83. Both Brent and Nymex WTI are down from immediate resistances on the daily charts and while that holds, there could be some near term dip towards 75 and 69 respectively.
Gold (1313.90) could face immediate rejection from levels near 1320-1325 from where a fall back towards 1300 is possible. Near term looks sideways to bearish. A break above 1325 would open up chances of re-testing 1350 in the medium term.
Copper (3.0825) may remain ranged in the 3.00-3.15 region (revised downside limit from 3.05 mentioned yesterday).
FOREX
Dollar index (92.76) has breached the 92.5 level, seeing a high of 92.97 yesterday. Our expectation of a dip till 92.0-91.50 is now unlikely to happen; however it could test levels near 92.4-92.5 today before rising again. The next 1-2 weeks might well see Dollar Index come close to its medium term target of 94-95 (which corresponds to the 5th wave starting point of the downmove since Dec ’16).
Euro (1.1925), against our expectation, did not rise towards 1.20. Instead it saw a low of 1.1898 yesterday. Our expectation of a rise towards 1.205-1.210 is unlikely; however there could be an upmove towards 1.1950-1.1975 today, after which the Euro could dip again. Like the Dollar Index, Euro in the next 1-2 weeks, could come close to its medium term target near 1.16-1.17 (which is the 5th wave starting point of the Euro’s upmove since Dec ’16).
Dollar Yen (108.96), as per our expectation, tested support on the upward trendline (daily candles) by seeing a low near 108.76. As we have been saying, it could now move higher towards 110.5-110.75 in the near term. The broader uptrend looks capped till 110.50-110.75 in the medium term, after which Dollar Yen could turn bearish.
Euro Yen (129.94) is very close to support (on weekly candles) near 129.75 and we can expect it to stay above this level as Dollar Yen moves higher towards 110 from its support.
Pound (1.3565) had turned very bearish last week after breaking below crucial long term support level near 1.385 on weekly line chart. It could move slightly up towards 1.358-1.360 in the next 1-2 sessions, before it resumes its downtrend towards 1.35-1.345.
Dollar Rupee (67.135) could head to 67.35 while Euro falls towards 1.18. A dip if seen could be limited to 67.10 just now.
INTEREST RATES
The Fed had maintained status quo in its May meeting last week but at the same time also expressed positivity regarding rising inflation. Inspite of some hawkishness in the Fed’s stance, US 10 Year yield has stayed below 3% (after having crossed it once to see a high near 3.03%). We are expecting US yields to start rising again as the June Fed meeting comes closer (where a rate hike is widely expected).
The medium term targets for US yields in our Apr ’18 US Treasury report (available on demand) are as follows: 3.2%-3.3% (10 Year), 3.4%-3.5% (30 Year), 3.15% (5 Year) and 2.75% (2 Year). A breach of the 3% level by the 10 year yield would be vital for these targets to be achieved by June. A rate hike is expected in the June Fed meeting, which might start getting factored later this month and could henceforth lead to a rally in yields towards these medium term targets. We also expect some more yield curve flattening in the next month followed by steepening after that, as yields bounce from long term supports.
US 10 Yr Yield (2.95%), 30 Yr (3.12%), 5 Yr (2.79%), 2 Yr (2.49%):
As mentioned yesterday, there is some scope for the US 30 year yield (3.12%) to dip more towards support on short term chart near 3.08% before rising again.
The 10 Year yield (2.95%) is testing support on upward trendline in the short term chart. We expect this support to hold, in which case, it should again start moving up towards 3%. As mentioned above, a rise back above 3% could happen later this month as the June Fed rate hike starts getting factored by traders.
Richmond Fed Barkin: Economy is remarkably strong
Thomas Barkin delivered his first speech as Richmond Fed President overnight and expressed his support for more rate hikes ahead. But he declined to comment on how many hikes this year he expects.
He noted that "monetary policy is still pretty accommodative". And, "when unemployment is low and inflation is effectively at our target, we probably ought to go to neutral in that environment." Also, "the economy's performance as we sit here today is remarkably strong: above trend growth, low unemployment, inflation at target."
But Barkin also warned on the risks from the trade tensions between US and other countries. He said it's "not clear what's going to be implemented in the end" regarding tariffs. But "there is an issue on business confidence and the business people that I talk to who were almost euphoric in January are now nervous. And they're nervous about where the macroeconomy is going."
GBP/USD Could Recover From Oversold Conditions
Key Highlights
- The British Pound declined sharply during the past few days and broke the 1.3700 support against the US Dollar.
- There is a key bearish trend line forming with resistance at 1.3650 on the 4-hour chart of GBP/USD.
- The Euro Zone Sentix investor Confidence Index for May 2018 declined from 19.6 to 19.2.
- Today, UK's Halifax House Price Index for April 2018 will be released, which is forecasted to decline 0.2% (MoM).
GBPUSD Technical Analysis
The British Pound faced a lot of selling pressure recently and declined below the 1.3700 support against the US Dollar. The GBP/USD pair even traded a few pips below the 1.3500 support and is currently correcting higher.

Looking at the 4-hours chart, the pair is trading well below the 100 (red) and 200 (green) simple moving averages. It traded as low at 1.3483 and is currently consolidating losses. On the upside, an initial resistance is near the 38.2% Fib retracement level of the last drop from the 1.3792 high to 1.3483 low.
Moreover, there is a key bearish trend line forming with resistance at 1.3650 on the 4-hour chart of GBP/USD. Therefore, if the pair corrects higher, it could face sellers near the 1.3600 and 1.3650 resistance levels.
On the downside, the 1.3500 support holds a lot of importance. A break and close below 1.3500 may perhaps ignite further losses toward 1.3450.
Recently in the Euro Zone, the Sentix investor Confidence Index for May 2018 was released by the Sentix GmbH. The market was looking for a rise from the last reading of 19.6 to 21.1.
The actual result was a bit disappointing as there was a decline in the Sentix investor Confidence Index from 19.6 to 19.2. This means the index fell for the 4th consecutive time and now stands at 19.2 points. It is one of the lowest reading since 02.17.
The report added:
The assessment of investors in Germany is also experiencing the fourth consecutive damper, which is due to a stronger decline in the assessment of the situation.
The Euro came under pressure and declined versus the US Dollar. Similarly, GBP/USD remains in a bearish zone and at a risk of more declines.
Economic Releases to Watch Today
- Germany's Industrial Production for March 2018 (MoM) – Forecast +0.8%, versus -1.6% previous.
- Germany's Trade Balance for March 2018 – Forecast €20.0B, versus €19.2B previous.
- UK Halifax House Price Index for April 2018 (MoM) – Forecast -0.2%, versus +1.5% previous.
- UK Halifax House Price Index for April 2018 (3m/YoY) – Forecast +3.3%, versus +2.7% previous.
- US IBD/TIPP Economic Optimism Index for May 2018 (MoM) – Forecast 51.3, versus 52.6 previous.
Markets Caught Between Opposing Forces
Equity Markets
US equities finished mostly higher but of their tops as energy shares started to take profits following a Presidential Tweet promising to announce his decision on the Iranian nuclear deal Tuesday at 14:00 EST. WTI retreated from 3-year highs, and equities appear to have echoed that weakness. Despite the strong US economic fundamentals within a Goldilocks zone, there seems to be no escaping geopolitical uncertainty that continues to run at peak levels.
Oil Markets
Oil market continues to run tight suggesting that reinstating the US primary sanctions against Iran will send the delicate balance into disarray and oil prices will rocket higher.
The delicate balance is part and parcel of OPEC/NON-OPEC accord, robust global demand dynamics and Venezuelan adversity as its reasonably safe to say that the supply cushion is deflated. Suggesting that even without Iran sanctions Oil prices will remain firm
The apparent tail risk, given the market’s overbought condition, we could be on for significant kneejerk reaction if the President walks back the more boisterous elements of
hawkish Iran rhetoric
With the Presidents decisions less than 24 hours away, everything that needs to be said has already been said.
Gold Markets
The Gold market continues to be caught between opposing forces, the surging US dollar and geopolitical uncertainty. The US dollar is having the most negative impact on prices. Since mid-April, the dollar has been immensely supported by a sudden downturn in global economic data, specifically in Europe which has left the US economy the last man standing regarding economic growth. While Forex traders continue to decide whether they’re just renting space in this USD dollar rally (little more than a short squeeze) or buying into full-heartedly, the overabundance of geopolitical risk should continue to attract haven appeal for the yellow metal on dips.
Currency Markets
The USD dollar continued to climb overnight as another series of EU economic data missed its mark toppling the EURUSD to a new YTD low at 1.1896 before recovering to close flat for NY session. The softer run of European economic data has some thinking the ECB will kick the can down the road and delay the end of their bond purchase program.
Besides the disappointing European economic data, there were hawkish inferences from Fedspeak along with nascent political flashpoints as the odds of a snap Italian election are increasing.
Given no follow-up presser to last weeks Fed minutes, the market is looking at this week’s Fedspeak for a more precise read on last week’s FOMC. Overnight Fed member Barkin spoke, sounding quite hawkish especially considering the market’s recent read on minutes , his comments supported the current stronger dollar narrative.
But overall, it’s worth noting that the bulk of the move did occur in holiday-thinned UK trading conditions with little to no follow through in the NY session.
The Malaysian Ringgit
The differing election market dynamics are indeed setting up for some element of surprise with most foreign investors considering the election to be uneventful while locals are growing increasingly uncertain. But this is more about the margin of victory and securing a robust mandate for BN, and this is where the balance of risk lies.
That market reaction is what is critical, with a probable knee-jerk weakness on Malaysian assets on a tightly contested result but a subtle appreciation on a more decisive victory. And then the broader market dynamics will continue to take charge. Malaysia is better positioned due to higher oil prices to whether the abundance of negative external factors that are driving market sentiment. Asia EM currencies remain out of favour in the face of a resurgent greenback and higher US yields. Risk sentiment remains in flux, but the most prominent hurdle that the market has completely ignored is the fact we are getting ever so close to the removal of accommodation. Which could be a massive negative for EM markets, particularly in Asia where the bulwarks of commerce Korea and China are showing some wear and tear at the seams.
Eco Data 5/8/18
[php_everywhere instance="1"]
US CPI Preview: Reflation Back on Track in April
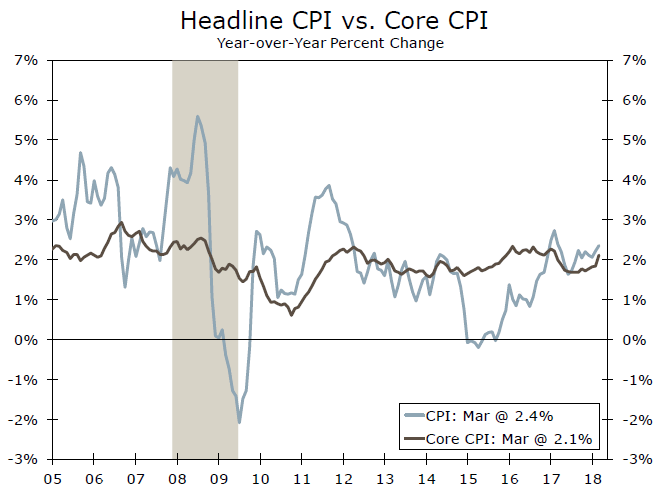
CPI should bounce back 0.3 percent in April due to higher energy prices, while the core index is likely to print a trend-like 0.2 percent gain. Both indexes should rise on a year-ago basis in another sign inflation is picking up.
Headline CPI to Rebound, Trend-like Gain for Core CPI in April
We expect headline CPI to rebound 0.3 percent in April after a gasolineinduced decline in March. That should push the year-ago change up to 2.5 percent. Our model predicts the non-seasonally adjusted index rising to 250.49.
Core inflation is likely to print 0.2 percent for a third straight month. We view the risk to that call as lying to the downside, however, with an expectation that April will be a "low" 0.2 percent gain. Nevertheless, the core CPI should rise to 2.2 percent year over year. Unlike recent months, we do not expect the latest seasonal adjustment factors or residual seasonality to have a meaningful impact to the core index. Over the past five years, the core index has increased an average of 0.148 in April, only modestly lower than the 0.156 percent average change for all months.
What We'll be Watchingn
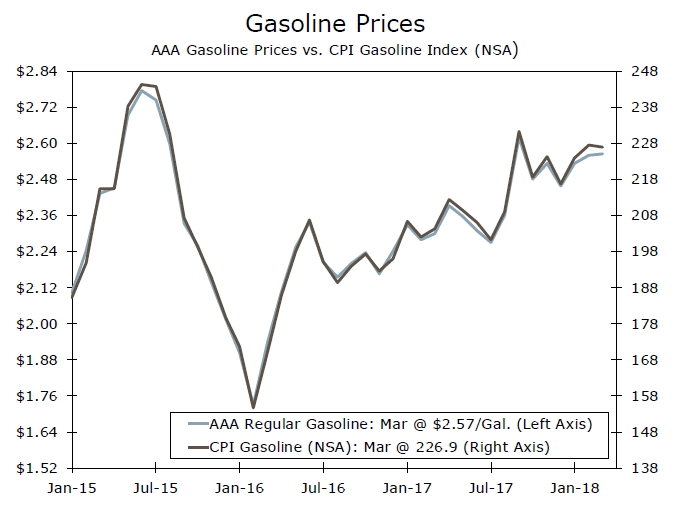
Gasoline Prices Revving Up: Gasoline prices jumped 6.2 percent in April, according to AAA. Gains this time of year, however, are fairly typical, so we expect energy prices to contribute only about 0.1 percentage point to the headline change. That follows a 0.2 percentage point drag in March when the CPI NSA series fell more than both AAA and EIA measures indicated.
Is the energy component of CPI therefore susceptible to a bigger gain than indicated by AAA to bring it more in line with other measures of gas prices? Never say never when it comes to the potential for monthly economic data to surprise, but we do not view it as a major risk. As shown in the middle chart, the CPI index for gasoline runs quite closely with AAA prices, but has been a bit stronger of late. Last month's softer reading in the CPI series brought it more closely in line with AAA prices.
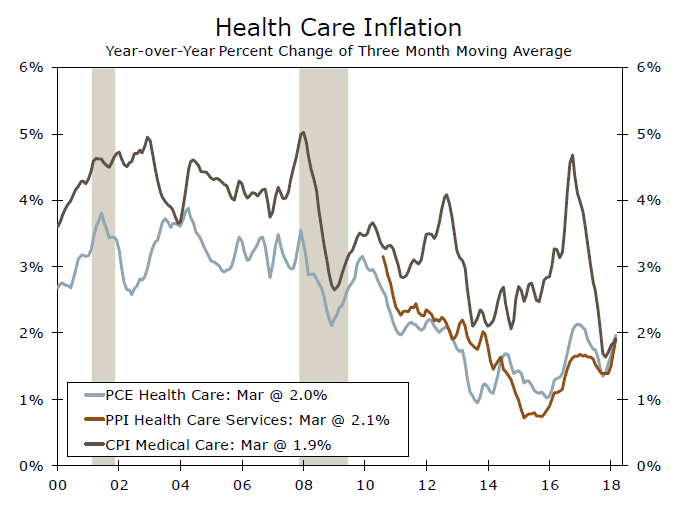
Heart Palpitations from Medical Costs: Medical care costs rose 0.4 percent in March—twice as fast as its average gain over the past year. While that may invite some payback in April, other measures of healthcare inflation are showing costs picking up after what has been some of the most restrained growth in decades (bottom chart). Medical costs in the CPI bears a little less than half the weight than in the PCE deflator—the Fed's benchmark for its 2 percent inflation target—and is limited to consumers' out-of-pocket costs. But with nearly a 9 percent weighting, the renewed strength in medical costs stands to be an important source of upward pressure on core CPI.
Room for Rent: Shelter costs bounced back in March, led by the owner's equivalent rent (OER) and lodging away from home components. While low inventories of homes for sale should keep OER growth solid, it would not be a big surprise to see prices soften in the volatile hotel sector. Prices for rented primary residences also picked up in March, but are beginning to show signs of coming under pressure from the immense growth in multifamily units the past couple of years.
ECB Praet blamed easter for negative surprise in Eurozone core inflation
ECB chief economist Peter Praet said in Geneva today:
- "This negative surprise in core inflation is mainly attributable to a decrease in services inflation, which is likely to be related to developments in volatile items, also reflecting the timing of Easter this year."
- "On the basis of current futures prices for oil, inflation is likely to hover around 1.5 percent in the coming months,"
Released last week, Eurozone CPI flash slowed to 1.2% yoy in April, down from 1.3%. Core CPI was worse, slowed to 0.7% yoy, down from 1.0% yoy.
Atlanta Fed Bostic: Some overshoot in inflation is fine
Altlanta Fed President Raphael Bostic said in an interview:
- "We have seen some upward pressure" on inflation.
- "We don't have the ability to stop trends on a dime. Some overshoot is fine,"
- If current trends continue, "we are going to see wages start to go up because we will truly have a scarcity of labor,"
- "I am not sure there is a big signal" in that on inflation.