Sample Category Title
All Eyes Will Be On This Week’s US CPI Report
All eyes will be on this week's US CPI report
Following a very solid, but softer than expected jobs report; the USD remains in an advantageous position but perhaps short-term speculators are a bit oversubscribed heading into the week.
The primary driver of late continues to be data surprise index between the rest of the world (soft) and the US (firm) which is sitting at all-time highs.
And while the NFP and AHE came in with slight misses, the US economy remains in the agreeable Goldilocks region, and as such, equity investors reacted favourably by taking the US indices higher outweighing the negatives from strained trade talks between the US and China.
On the trade war front, whatever optimism investors had about China-US trade negotiations should be undermined by the fact there was no communique, with rumours suggesting the two superpowers are sitting worlds apart after the US failed to win any concessions. Even the hint of trade war escalation is terrible news for global equities so there is the threat that any contrary Monday morning headline risks could dampen stock market sentiment right out of the gates.
Also, geopolitical developments remain top of the charts, with NAFTA trade negotiations starting up again; the US due to decide on Iran sanctions; and local elections for INR, and MYR.
On the G-10 Central Bank front, the BOE and RNBZ are due. Given the recent dreadful run of UK economic data and low BOE expectations, the RBNZ will be more interesting where the tail risk is for a more hawkish delivery.
On the Local EM FX front, BNM and BSP are due. BNM will likely keep interest rates on hold due to the softer than expected inflation readings in Malaysia while BSP could shift policy as Governor Espenilla's latest comments do suggest he is laying the groundwork for a rate hike given the uptick in Philipines inflation readings.
However, all eyes will be on this week's US CPI report, which will be this month's most significant piece of economic data as it will go a long way to confirm the markets bullish read on the US economy and the Fed rate hike trajectory.
Oil Markets
The lack of any progress on the US Iran nuclear waiver is precisely what is pushing oil prices higher as West Texas Intermediate crude oil traded above the $70 mark for the first time since November 2014 on Friday as market offers ran thin.
We're in the thick of it now as the president has until May 12 to decide whether the US will stay in a deal with Iran or not. While President Trump has walked back a number of his more hawkish policies, the market is buying into a hard line Iran response bolstered by the markets hawkish view of crucial Trump policy stalwarts, Pompano and Bolton.
With OIl prices surging, Baker Hughes reported that US Drillers added nine oil rigs in the week to May 4, bringing the total count to 834, the highest level since March 2015. But given the bullish price action on Friday, it's unclear at this stage, give the Iran focus, if the markets will meander through its ritualistic Monday morning downside test on the back of rising oil drilling rig counts.
Gold Markets
After a midweek lull in geopolitical tension, the intense focus on Iran Nuclear deal perked up Gold geopolitical risk premium. It's just not the US on this stage, but Israels and even Saudi Arabia have called the agreement flawed. And now with Iran's President, Hassan Rouhani suggesting Tehran will scrap the deal and restart high-level uranium enrichment if the US pulls out. It appears we're not far away from setting off the Middle East powder keg again. I guess the big question for politicians, is the world a safer place with a weak Iran deal or no deal at all.
The surging dollar continues to dampen Gold demand. But Gold prices bounced convincingly off the $1303 significant support level possibly supported by the threat of a Trump ” Put”. Indeed, the President can't be happy with the strengthening dollar at precisely when US administration is trying to iron out trade policy with China. After all, no one wants an excessively strong currency in the midst of a trade war, so perhaps the Gold markets should be on guard for the President to remind us just how touchy the administration is the dollar rally.
Not that trade war ever left the stage, but it could be moving back to centre stage after few concession were made at the recent US-China trade summit, which could increase gold appeal given the negative implications of equity markets on a possible trade and tariff escalation.
Currency Market
The USD dollar has been on an impressive run since mid -April and while it's difficult to pinpoint the exact reason, its safe to assume that waning global growth expectations on the back of weaker data out and Europe and Asia is one of the key drivers.
Almost overnight economies have gone from boom to downturn in Europe while Asia's bastions of commerce like Korea and China are starting to show wear and tear at the seams. Korean exports(YoY) turned negative for the first time in 18 months, and suspicion continues to grow that the recent round of RRR cuts in China is signalling that deleveraging is ending. The recent shift in Pboc policy does hint that it's possibly designed to address underlying weakness in the Chinese economy.
And while the correlation between relative interest rates is starting to pick up again, one does have to wonder how much more widening in the differential can be squeezed out unless the there is an actual adjustment in the Fed terminal rate.
And while the mystery of the global slowdown continues, however, unless the recent bout of USD strength is persuasive enough for Asia investors to buy U.S. debt without hedging currency exposure, traders might be best to take out a 1 or 2-month lease on the USD rally rather than buying into it en masse.
The U.S. Treasury Department will auction $163 billion in securities next week, comprising $73 billion in new debt and $90 billion in previously sold debt. Traders will be intently watching the bid to cover ratios on Tuesday auction of 31 billion in three-year notes, Wednesday $ 25 billion in 10-year notes and Thursdays 17 billion of 30-year notes.
The Euro
Traders are respecting the current price action on the EUR and reducing long EUR exposures as fundamentals are looking wobbly in Europe on the back data misses including the HICP inflation gauge. Given the market focus on data surprises and interest rate differentials, it certainly favours the EURO to move lower over the coming days as traders continue to anticipate further unwinding of this year's most subscribed trade, long EURO. However . just how much more juice can be extracted from interest rate differentials unless the Feds adds another dot or two is the big question.
The Japanese Yen
Despite the rising political risk in Japan, USDJPY remains supported by easing of political threat in the Korean Peninsula along with higher US bond yields. The market is trading off USD dollar strength, not a weaker JPY. Based on that we should expect the USDJPY to continue to lag the DXY dollar rallies.
The Pound
The Pound after breaking below the 200-day moving average could be one of the most imperilled G-10 currencies on a stronger than expected CPI print this week. The Pound is utterly prone given the run of soggy economic data all but assures the BOE will sit pat at the May meeting.
Malaysian Ringgit
The Ringgit is struggling ahead of two key events, the BNM policy statement and the general election.
The GE14 week is finally upon us in what has turned out to be a much more hotly contested election run that what anyone had thought. Given this uncertainty, investors have been very tentative to re-engage the Ringgit due to the possibility of a large-scale knee-jerk negative repricing of Malaysian on the slight change the opposition could pull out a surprise. I sense investors are taking little for granted after the Brexit and Trump surprises.
BNM to stay on hold on 10 May amidst the preponderance of lower core inflation. Within this context, traders will be looking for dovish signals from the that would suggest the BNM will stand pat for the remainder of 2018. With that in mind, Traders are also paring back MYR exposure for a possible dovish shift in BNM language.
Adding to the MYR woes is the surging greenback and higher US interest rates of late which not only weakens the MYR but has a negative implication for local debt markets as higher US rates make MGS bonds less attractive.
Eco Data 5/7/18
[php_everywhere instance="1"]
EUR/USD Weekly Outlook
EUR/USD's decline extended to as low as 1.1966 last week. While downside momentum has been diminishing, there is no sign of bottoming yet. Initial bias remains on the downside this week for 200% projection of 1.2475 to 1.2214 from 1.2413 at 1.1891. Break will target 261.8% projection at 1.1730. On the upside, though, break of 1.2008 minor resistance will indicate short term bottoming and bring stronger rebound back to 4 hour 55 EMA (now at 1.2077) or above.
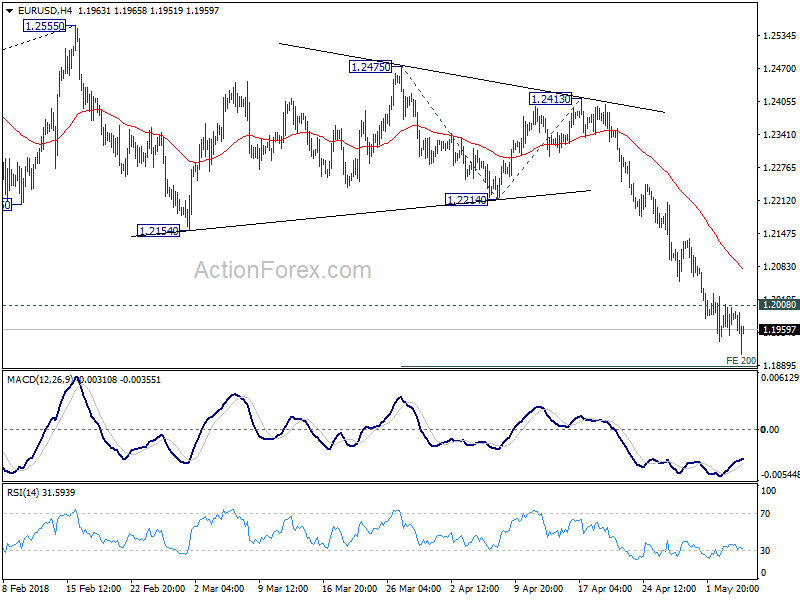
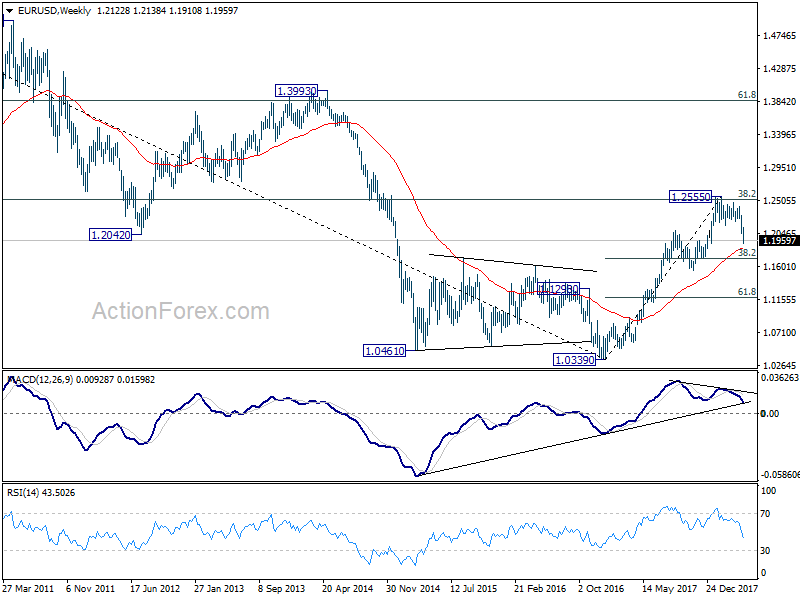
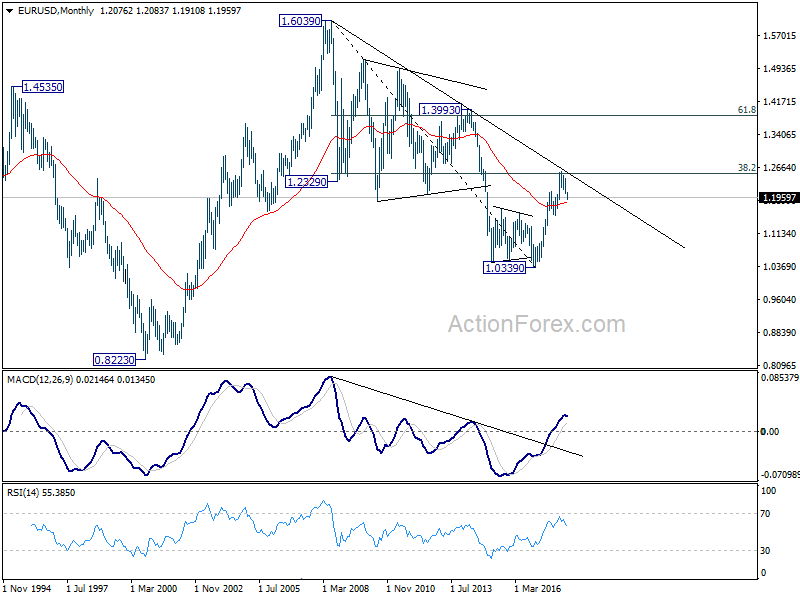
In the bigger picture, current decline and firm break of 1.2154 support confirms rejection by 38.2% retracement of 1.6039 (2008 high) to 1.0339 (2017 low) at 1.2516. A medium term top should be in place at 1.2555 and deeper decline would be seen back to 38.2% retracement of 1.0339 to 1.2555 at 1.1708 first. With current downside acceleration, there is prospect of hitting 61.8% retracement at 1.1186 before completing the decline. But still, we'll need to look at the structure to before deciding if it's a corrective or impulsive move.
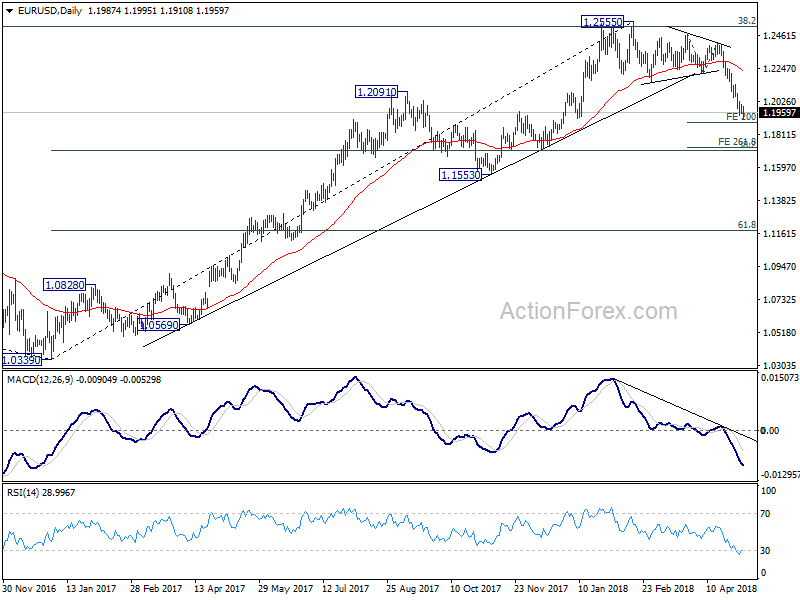
In the long term picture, the rejection from 38.2% retracement of 1.6039 to 1.0339 at 1.2516 argues that long term down trend from 1.6039 (2008 high) might not be over yet. EUR/USD is also held below decade long trend line resistance. Focus will now turn to 1.1553 support. Break there would raise the chance of retesting 1.0339 low. It's early to tell, but the chance of long term bullish reversal is fading.
USD/JPY Weekly Outlook
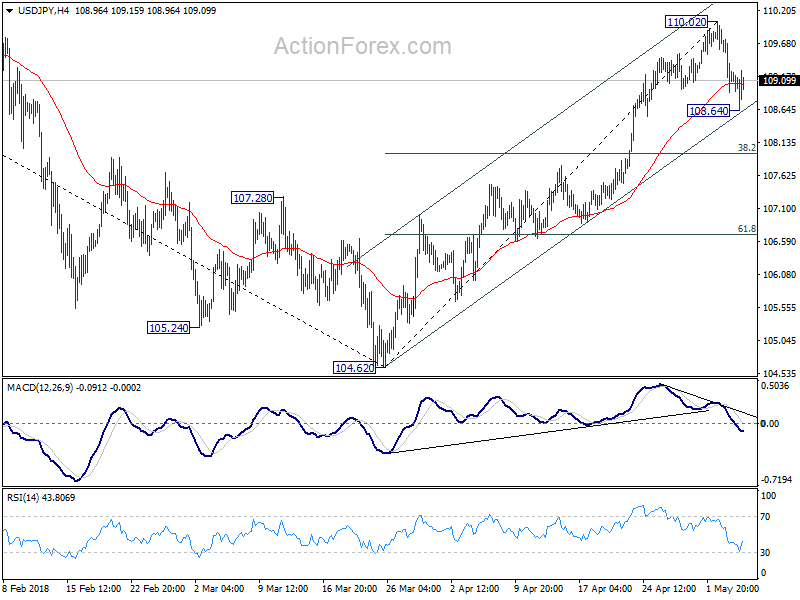
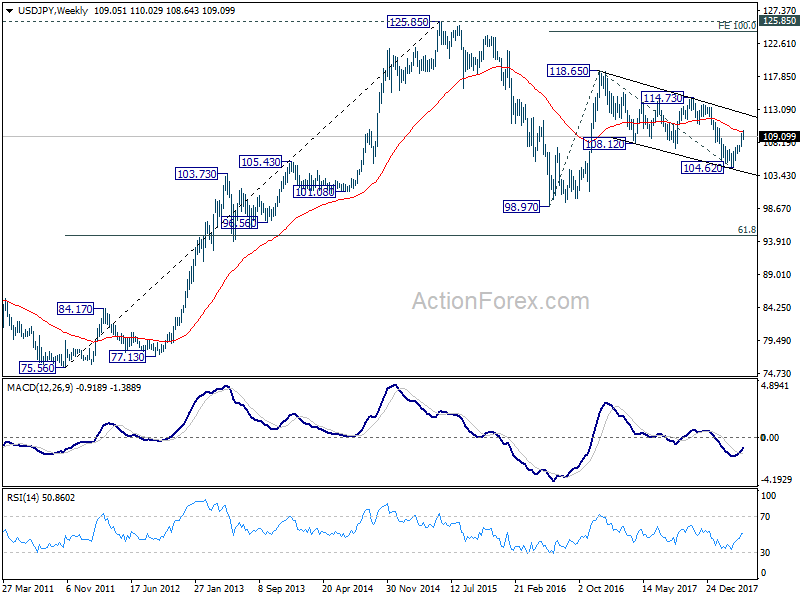
USD/JPY edged higher to 110.02 last week but formed a short term top there and retreated deeply. Though, as the pair drew support from near term channel and recovered, initial bias is neutral this week first. Some more consolidations could be seen in near term. In case of another fall, we'd expect strong support from 38.2% retracement of 104.62 to 110.02 at 107.95 to contain downside and bring rebound. On the upside, break of 110.02 will resume the rise from 104.62 to t 61.8% retracement of 114.73 to 104.62 at 110.86 next.
In the bigger picture, corrective decline from 118.65 (2016 high) has completed with three waves down to 104.62. Rise from 104.62 is possibly resuming the up trend from 98.97 (2016 low). This will be the preferred case as long as 55 day EMA (now at 107.95) holds. Decisive break of 114.73 resistance will confirm our view and target 118.65 and above. However, sustained break of 55 day EMA will dampen this bullish view and turn focus back to 104.62 low instead.
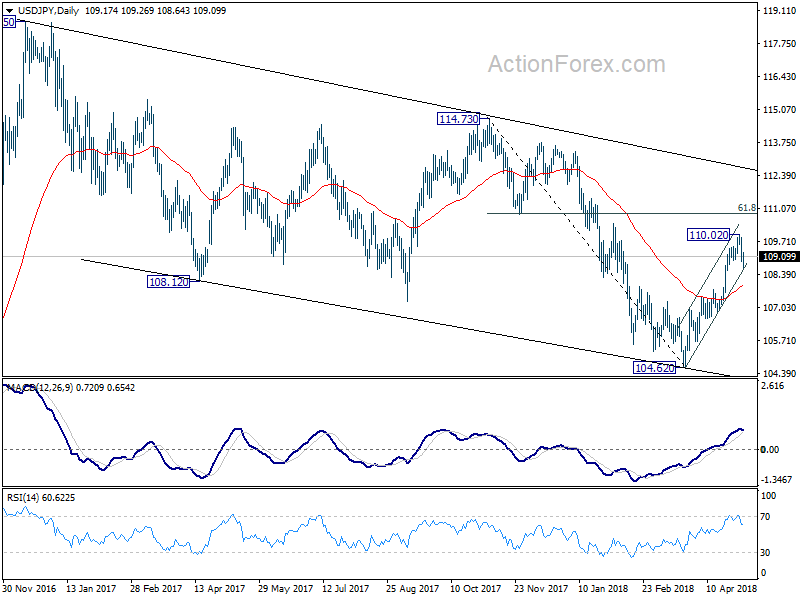
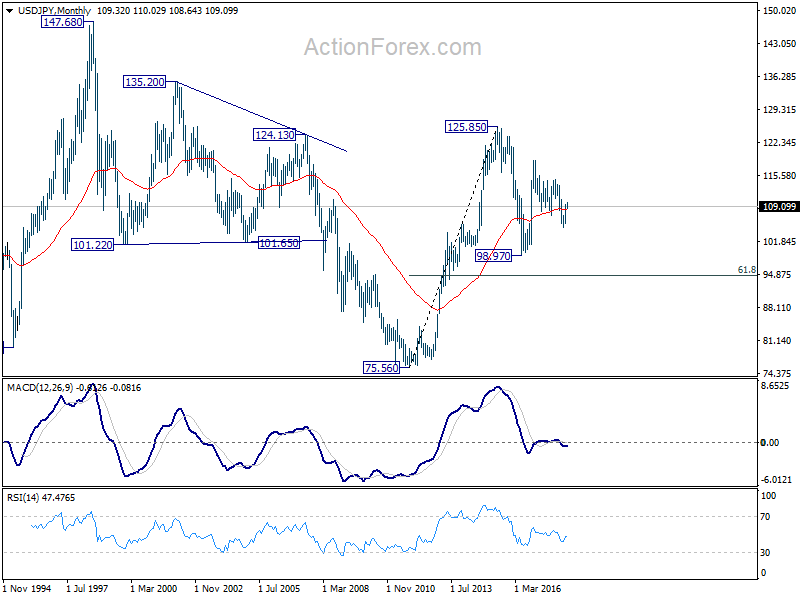
In the long term picture, the rise from 75.56 (2011 low) long term bottom to 125.85 top is viewed as an impulsive move, no change in this view. Price actions from 125.85 are seen as a corrective move which could still extend. In case of deeper fall, downside should be contained by 61.8% retracement of 75.56 to 125.85 at 94.77. Up trend from 75.56 is expected to resume at a later stage for above 135.20/147.68 resistance zone.
GBP/USD Weekly Outlook
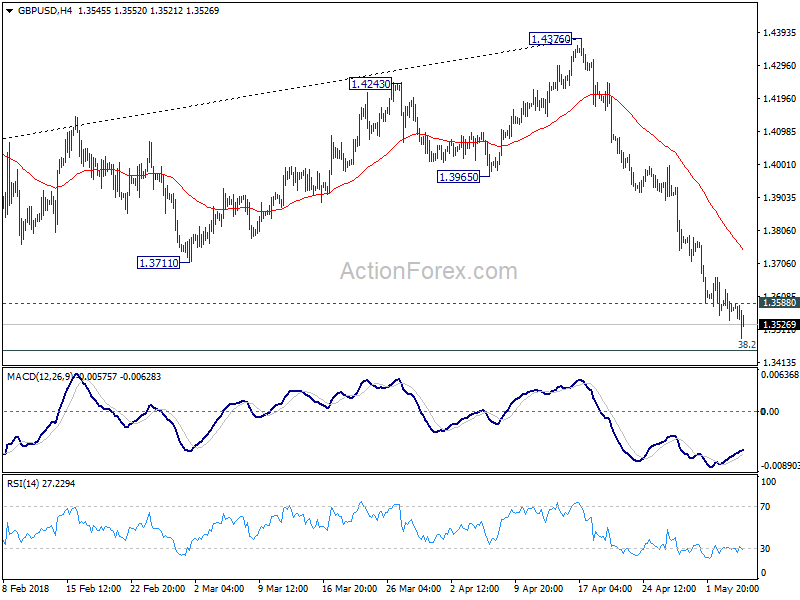
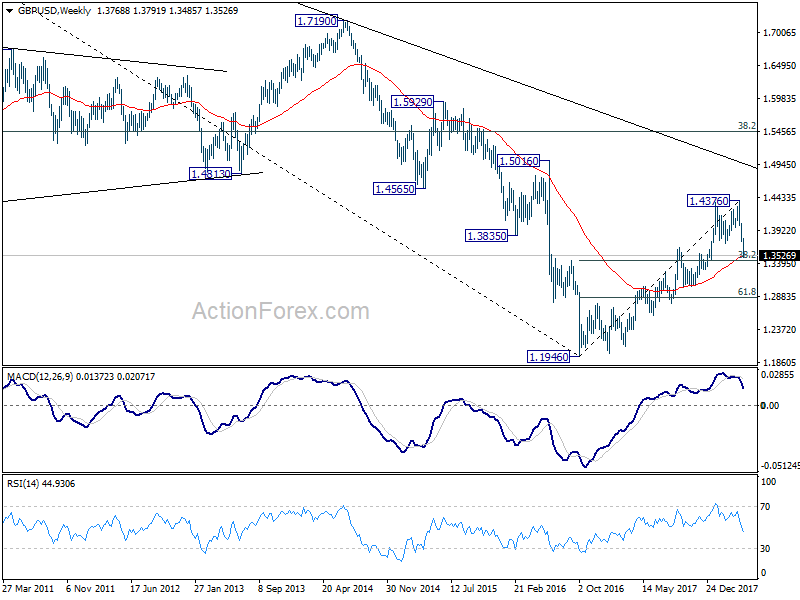
GBP/USD's fall from 1.4376 extended to as low as 1.3458 last week. The pair is losing some downside momentum as seen in 4 hour MACD, but there is no sign of bottoming yet. Initial bias remains on the downside this week for 1.3448 fibonacci level next. On the upside, above 1.3588 minor resistance will argue that a short term bottom is formed. In that case, stronger recovery could be seen back to 4 hour 55 EMA (now at 1.3746) and above before staging another fall.
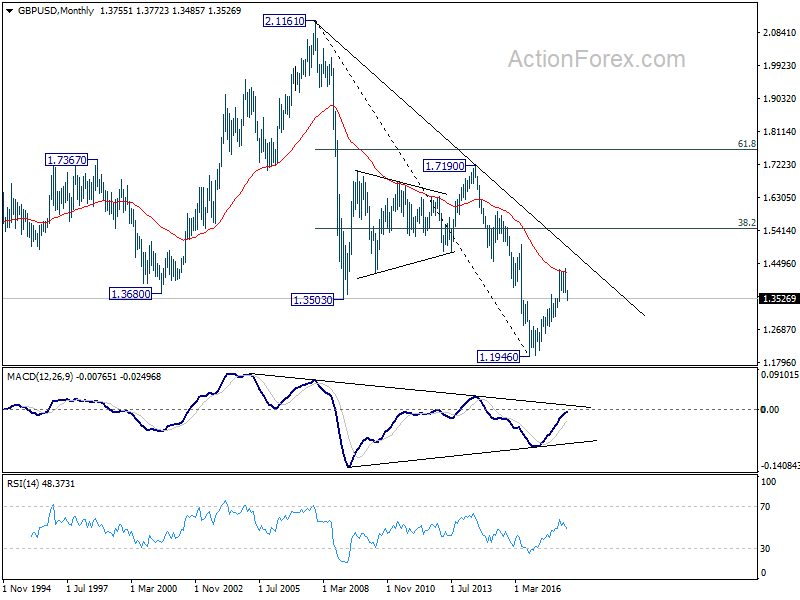
In the bigger picture, current development suggests that whole medium term rebound from 1.1936 (2016 low) has completed at 1.4376 already, with trend line broken, on bearish divergence condition in daily MACD, after rejection from 55 month EMA (now at 1.4223). Deeper decline should be seen to 38.2% retracement of 1.1936 (2016 low) to 1.4376 at 1.3448 first. Break will target 61.8% retracement at 1.2874 and below. Outlook will stay bearish as long as 55 day EMA (now at 1.3925) holds, even in case of strong rebound.
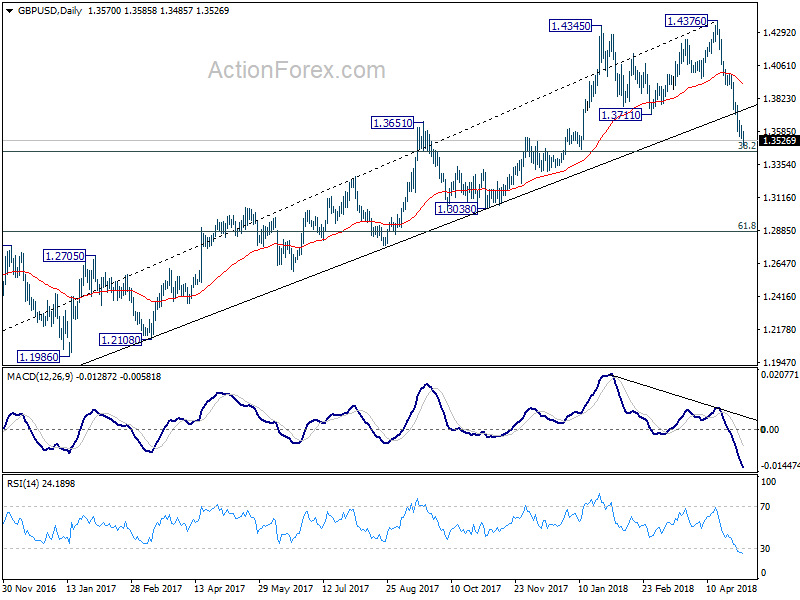
In the longer term picture, rise from 1.1946 (2016 low) is viewed as a corrective move, no change in this view. Rejection from 55 month EMA argues that it might be completed already. Larger down trend from 2.1161 (2007 high) could extend to a new low. This will now be the preferred case as long as 1.4376 resistance holds.
USD/CHF Weekly Outlook
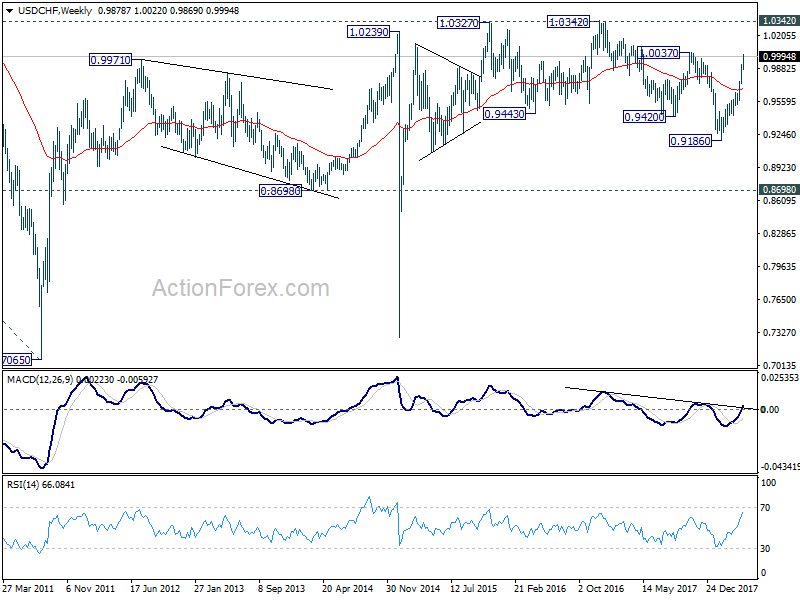
USD/CHF's rally extended to as high as 1.0022 last week. The pair lost some upside momentum as seen in 4 hour MACD, but there is no sign of topping yet. Initial bias stays on the upside or 1.0037 resistance. Firm break there will pave the way to 1.0342 key resistance next. On the downside, though, below 0.9937 minor support will indicate short term topping. And, in that case, deeper retreat could be seen to 4 hour 55 EMA (now at 0.9897) and below before staging another rise.
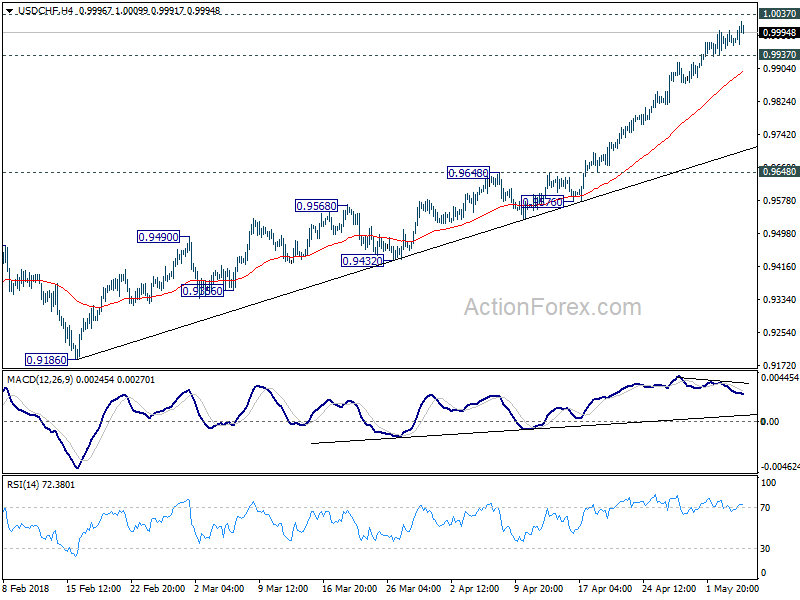
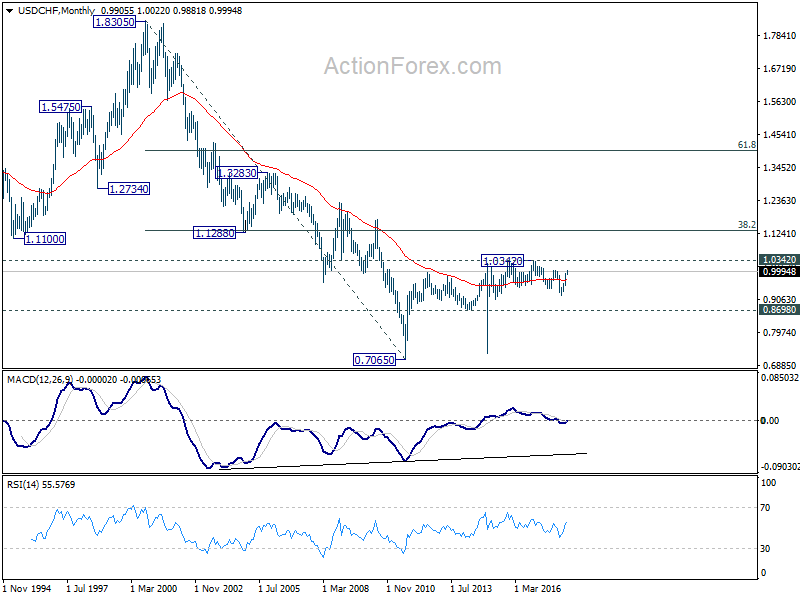
In the bigger picture, medium term decline from 1.0342 has completed with three waves down to 0.9186. Rise from there is currently viewed as a leg inside the long term range pattern. Hence, while further rally would be seen, we'd be cautious on strong resistance from 1.0342 to limit upside. For now, further rise is expected as long as 0.9648 resistance turned support holds, even in case of pull back.
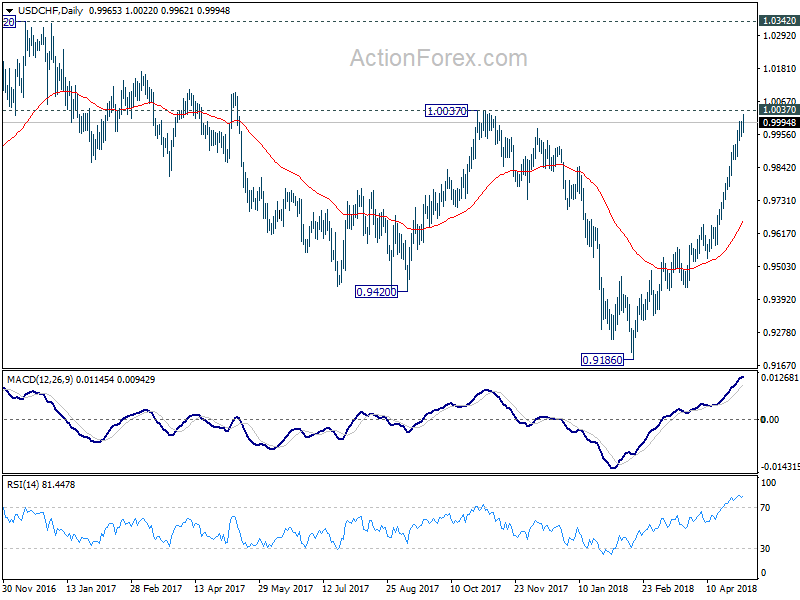
In the long term picture, price actions from 0.7065 (2011 low) are not clearly impulsive yet. Thus, we'll treat it as developing into a corrective pattern, at least, until a firm break of 1.0342 resistance.
AUD/USD Weekly Outlook
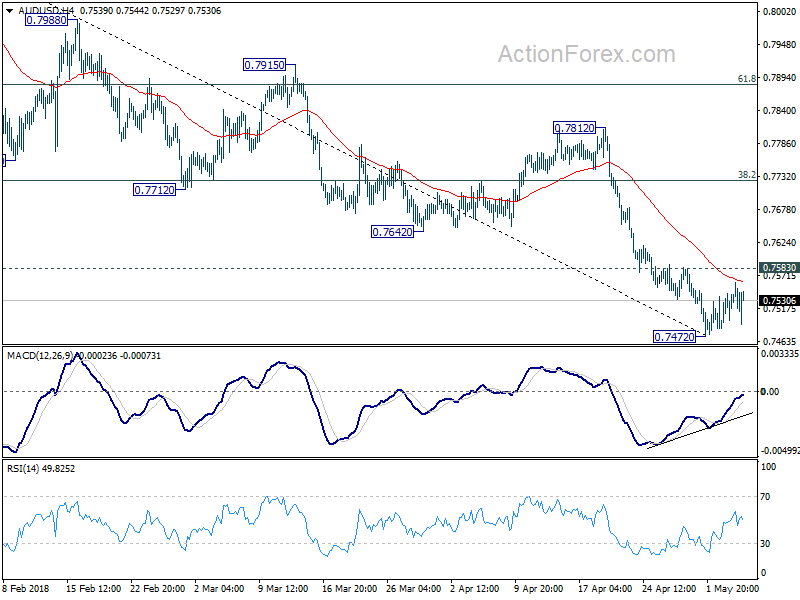
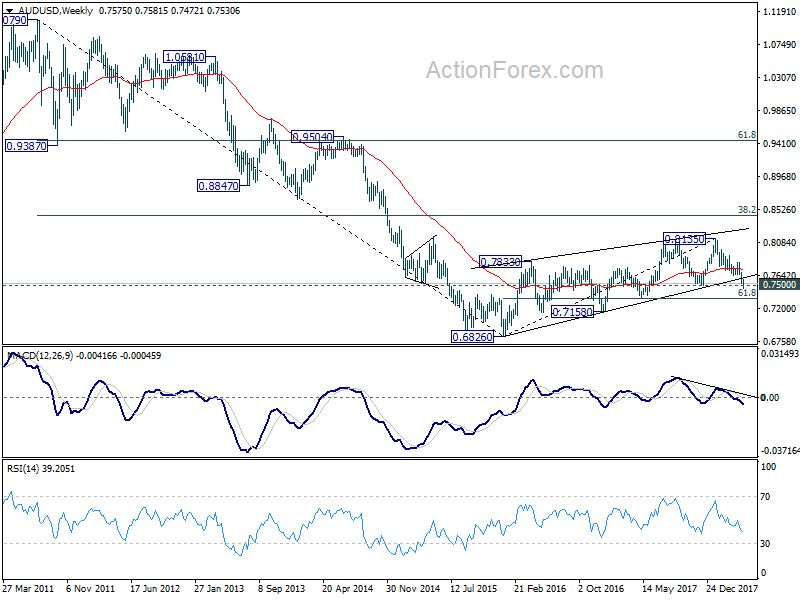
AUD/USD dropped to as low as 0.7472 last week and breached 0.7500 key support level. But there was no follow through selling and the pair recovered. Initial bias is neutral this week for consolidations first. As long as 0.7583 minor resistance holds, the consolidation should be relatively brief and recent fall should resume sooner rather than later. Below 0.7472 and sustained break of 0.7500 will indicate medium term reversal and target next support at 0.7328. However, break of 0.7583 will indicate short term bottoming, on bullish convergence condition in 4 hour MACD. And stronger rebound could be seen back to 38.2% retracement of 0.8135 to 0.7472 at 0.7725 and possibly above.
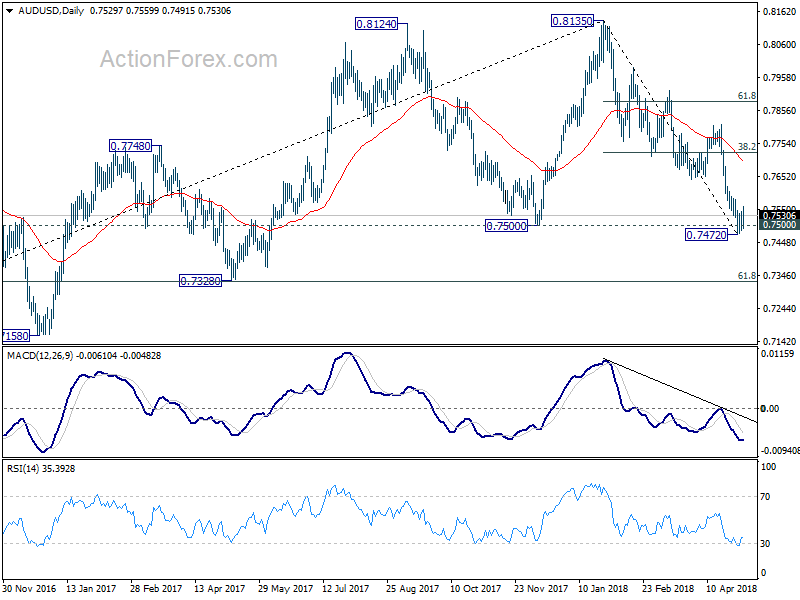
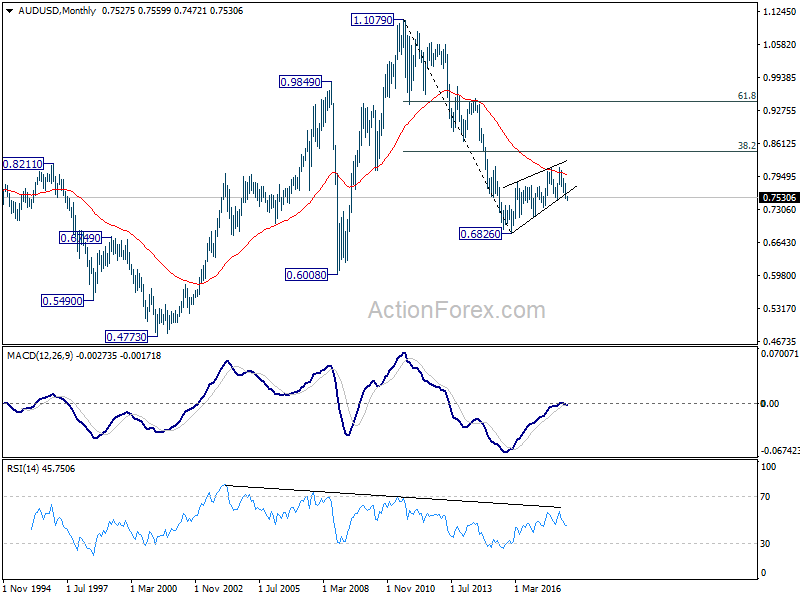
In the bigger picture, medium term rebound from 0.6826 is seen as a corrective move. Decisive break of 0.7500 key support will suggest that such correction is completed. In that case, deeper decline would be seen back to retest 0.6826 low. In case of another rise, we'd expect strong resistance from 38.2% retracement of 1.1079 to 0.6826 at 0.8451 to limit upside to bring long term down trend resumption eventually.
In the longer term picture, 0.6826 is seen as a long term bottom. Rise from there could either reverse the down trend from 1.1079, or just develop into a corrective pattern. At this point, we're favoring the latter. And, as long as 38.2% retracement of 1.1079 to 0.6826 at 0.8451 holds, we'd anticipate another decline through 0.6826 at a later stage. But strong support should be seen between 0.4773 (2001 low) and 0.6008 (2008 low).
USD/CAD Weekly Outlook
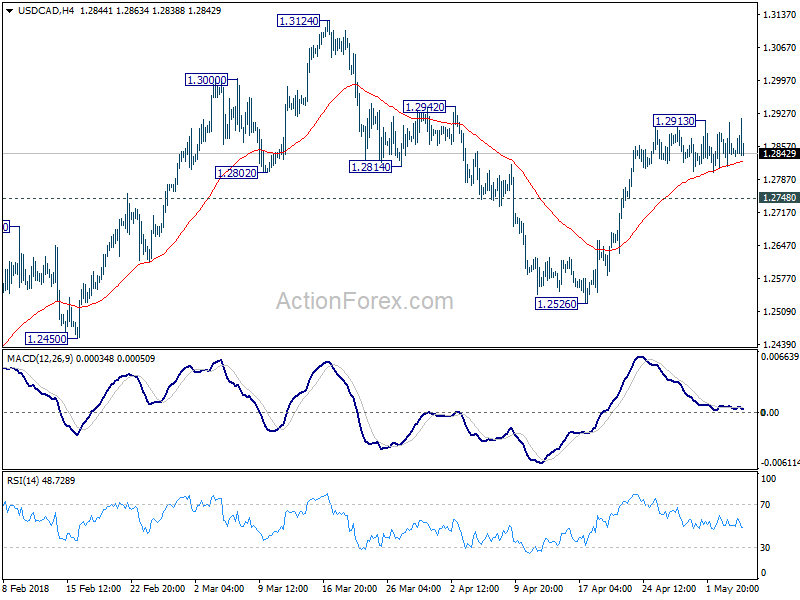
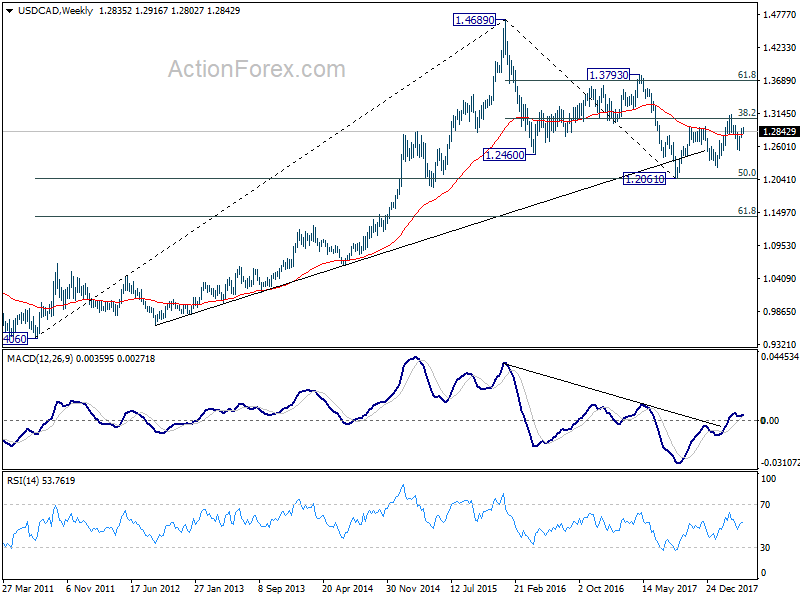
USD/CAD edged higher to 1.2913 last week but failed to extend the rally from 1.2526 since then. Initial bias remains neutral this week for some consolidations. As long as 1.2748 minor support holds, further rise is expected. Break of 1.2913 will target a test on 1.3124 high next. Though, break of 1.2748 will turn focus back to 1.2526 support instead.
In the bigger picture, current development suggests that rebound from 1.2061 has not completed yet. Focus is back on 38.2% retracement of 1.4689 to 1.2061 at 1.3065. Sustained trading above there will confirm medium term bullish reversal. That is, down trend from 1.4689 has completed at 1.2061 already. In that case, next target will be 61.8% retracement at 1.3685.
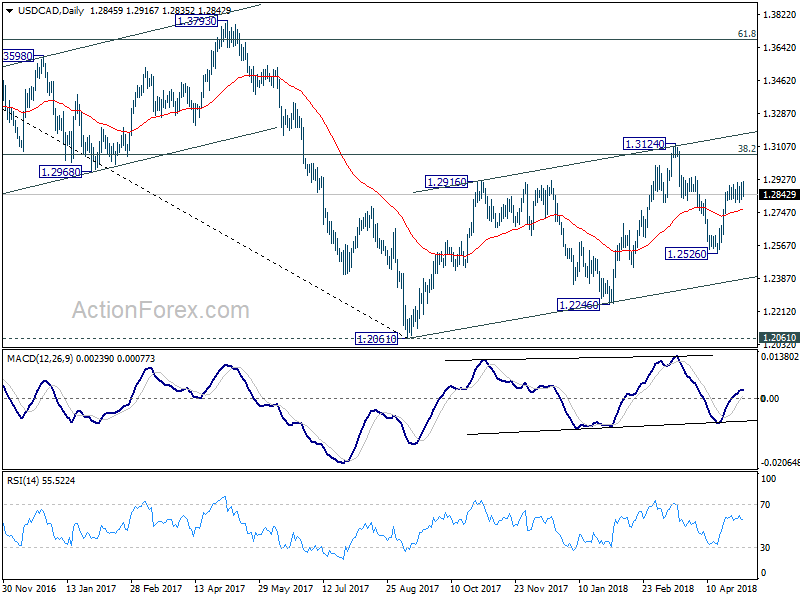
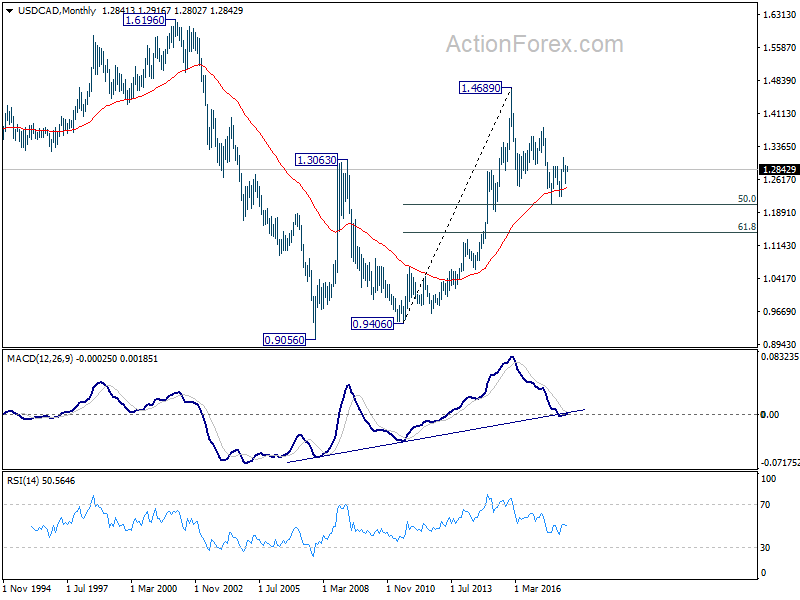
In the longer term picture, 50% retracement of 0.9406 (2011 low) to 1.4689 (2015 high) at 1.2048 remains a key support level to watch. As long as this level holds, we'll treat fall from 1.4689 as a correction and expect another rally through this level. However, sustained break of 1.2048 will turn favors to the case that rise from 0.9056 (2007 low) is a three wave corrective move that's completed at 1.4689. And retest of 0.9056/9406 support zone could be seen in medium to long term.
EUR/GBP Weekly Outlook
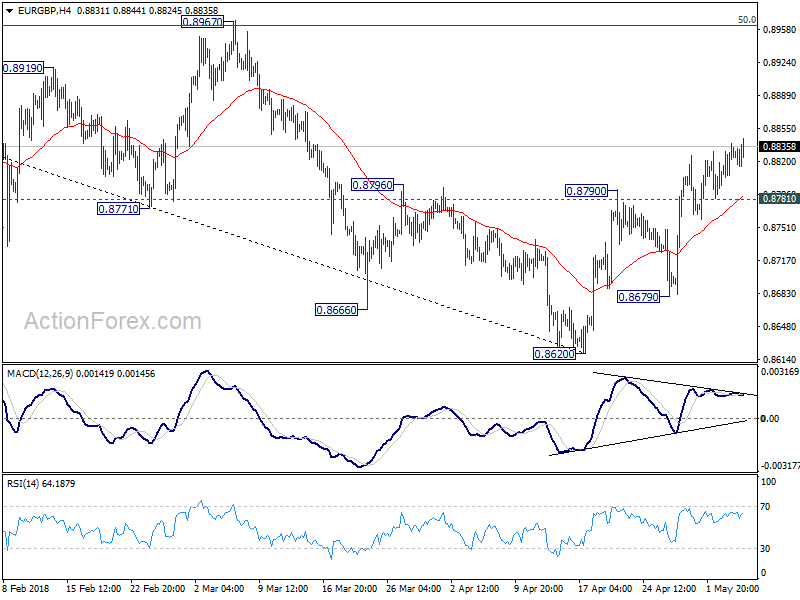
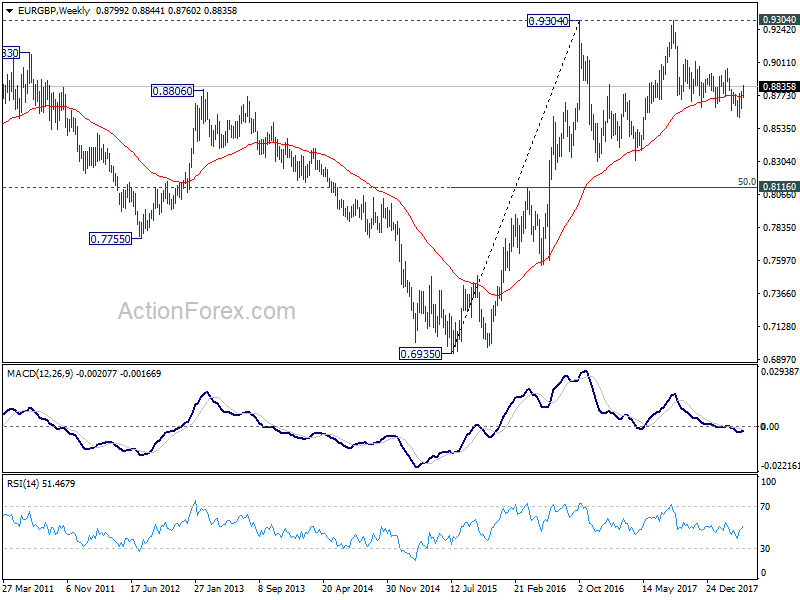
While upside momentum was unconvincing, EUR/GBP extended the rebound from 0.8620 last week and hit as high as 0.8844. Initial bias remains on the upside this week for 0.8967 cluster resistance next (50% retracement of 0.9305 to 0.8620 at 0.8963). Firm break there will confirm neat term reversal. On the downside, below 0.8781 minor support will turn focus back to 0.8679 support. Break there will suggests that larger decline from 0.9305 is resuming.
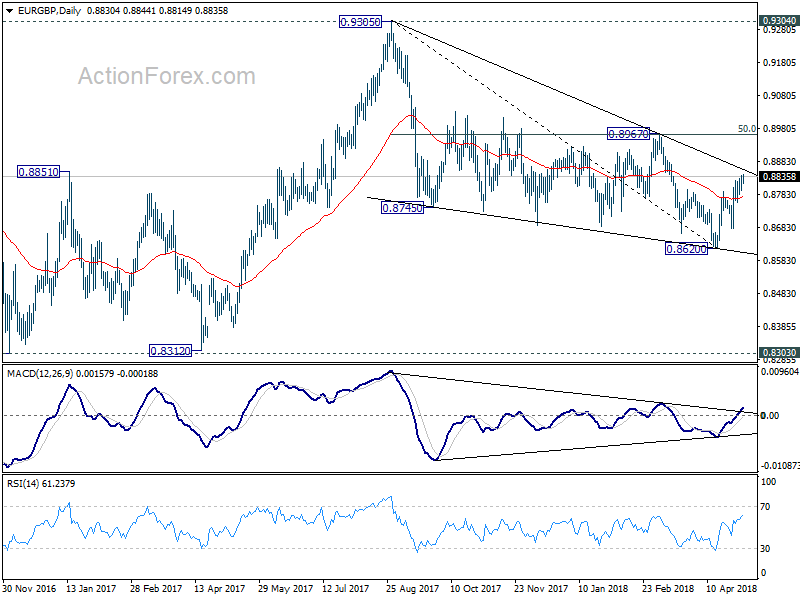
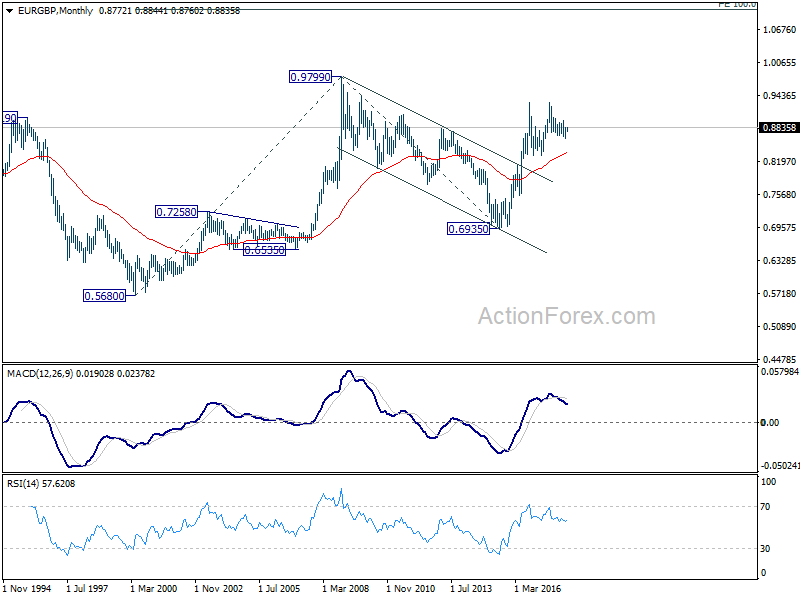
In the bigger picture, for now, the decline from 0.9305 is seen as a leg inside the long term consolidation pattern from 0.9304 (2016 high). Such consolidation pattern could extend further. Hence, in case of strong rally, we'd be cautious on strong resistance by 0.9304/5 to limit upside. Meanwhile, in another decline attempt, we'd expect strong support from 0.8116 cluster support (50% retracement of 0.6935 to 0.9304 at 0.8120) to contain downside.
In the long term picture, we're holding on to the view that rise from 0.6935 (2015 low) is resuming the up trend from 0.5680 (2000 low). Hence, after the consolidation from 0.9304 completes, we'd expect another medium term up trend through 0.9799 to 100% projection of 0.5680 to 0.9799 from 0.6935 at 1.1054.
EUR/AUD Weekly Outlook
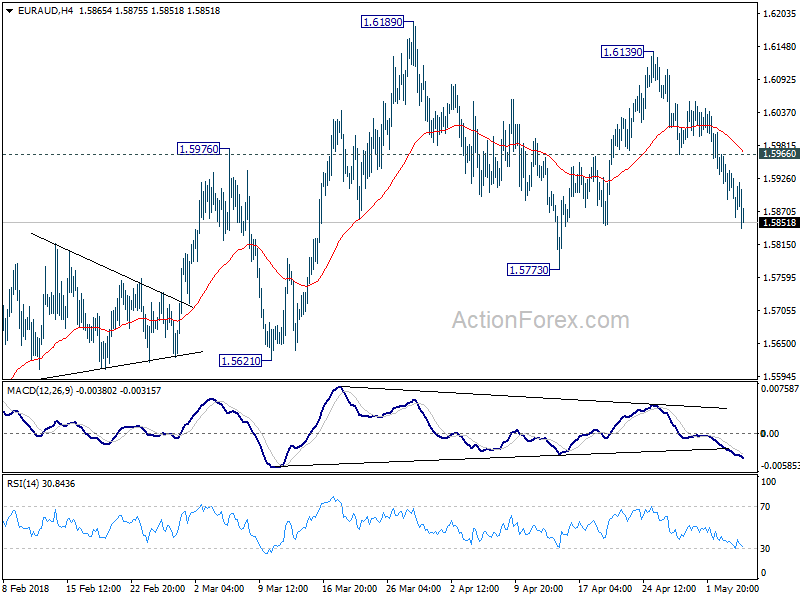
EUR/AUD's decline from 1.6139 continued lower last week as expected. Initial bias remains on the downside this week for 1.5773 support and possibly below. But for now, price actions from 1.6189 are viewed as a corrective pattern. Hence, we'd expect strong support above 1.5621 to complete the pattern and bring rebound. On the upside, above 1.5966 support turned resistance will turn bias to the upside for 1.6139 and then 1.6189 high.
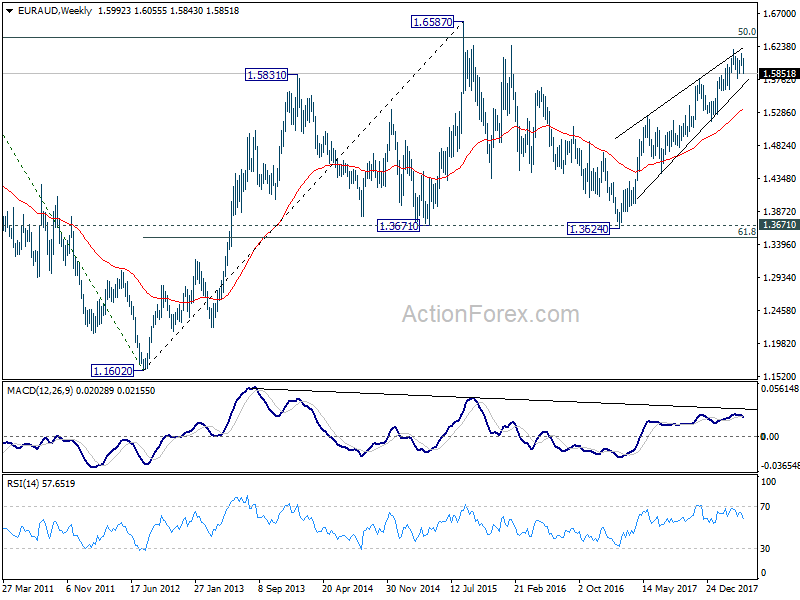
In the bigger picture, while there is bearish divergence condition in daily MACD, there is no clear sign of reversal yet. Current rally from 1.3624 could extend to 1.6587 key resistance (2015 high). Nonetheless, we'd expect further loss of upside momentum, and strong resistance from 1.6587 to limit upside and bring reversal. On the downside, sustained break of 1.5621 support should confirm reversal and turn outlook bearish for 1.5153 support and below.
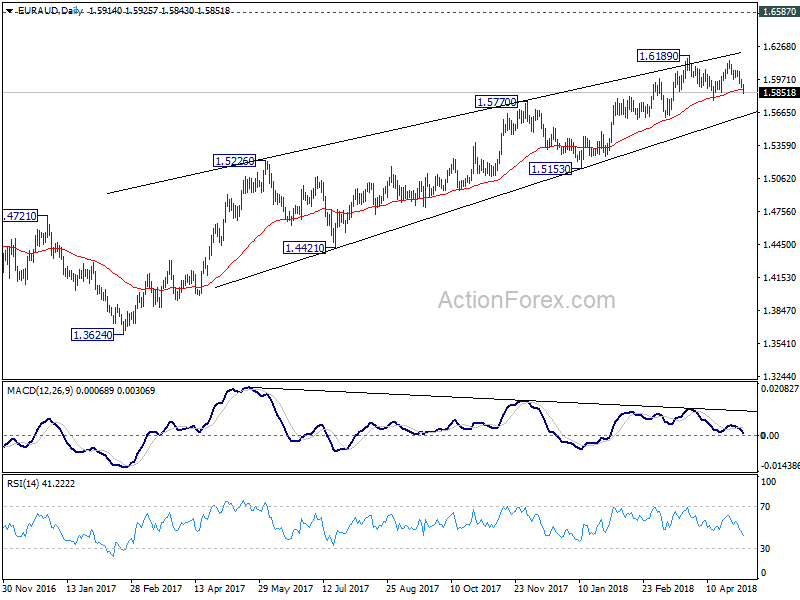
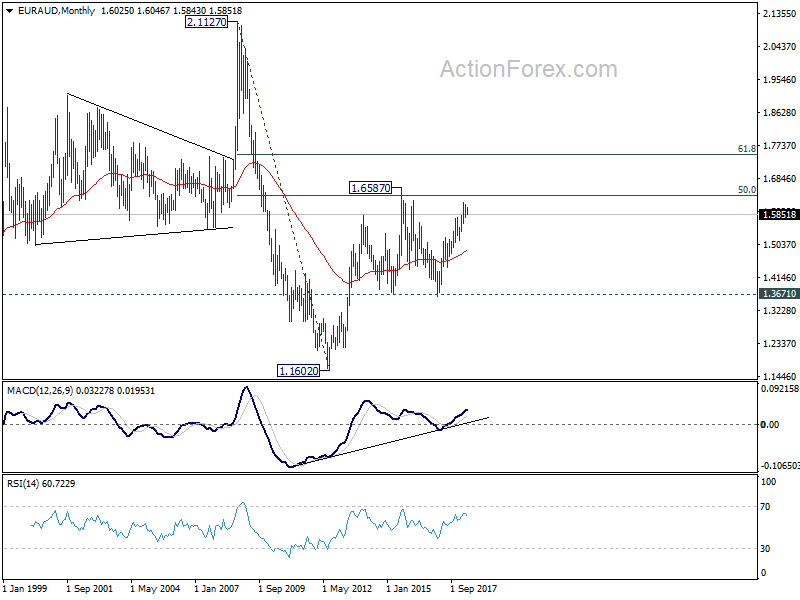
In the longer term picture, the rise from 1.1602 long term bottom (2012 low) isn't over yet. We'll keep monitoring the development but there is prospect of extending the rise to 61.8% retracement of 2.1127 to 1.1602 at 1.7488 and above. However, sustained trading below 1.3671 should indicate long term reversal and target 1.1602 long term bottom again.