Sample Category Title
EUR/CHF Weekly Outlook
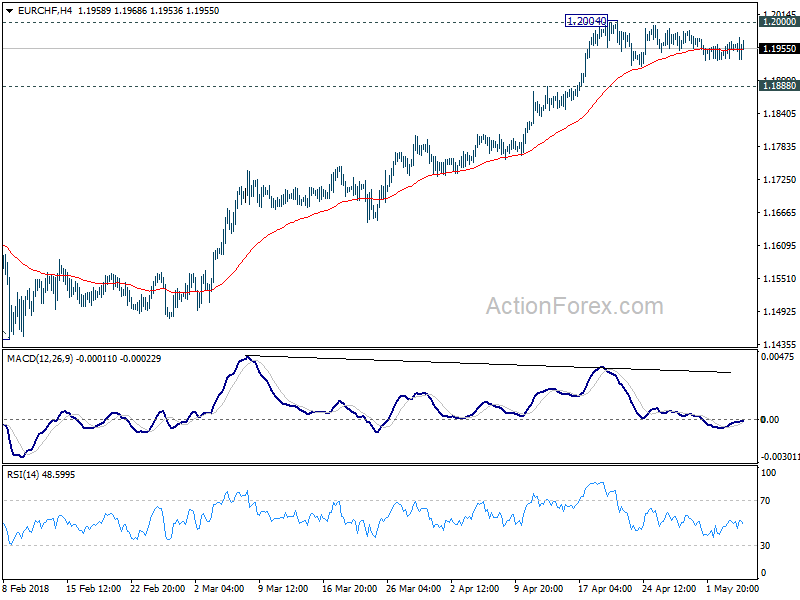
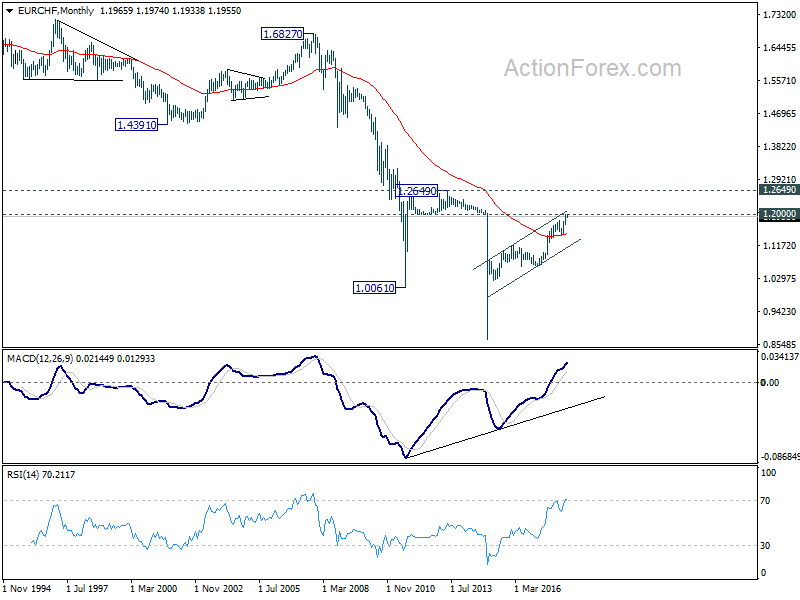
EUR/CHF's consolidation from 1.2004 continued last week as the cross stayed in very tight range. Initial bias remains neutral this week first. With 1.1888 minor support intact, further rally is expected. Sustained break of 1.2 level will extend larger up trend to 61.8% projection of 1.0629 to 1.1832 from 1.1445 at 1.2188. However, consider bearish divergence condition in 4 hour MACD, break of 1.1888 will indicate short term topping. In that case, deeper pull back would be seen back to 1.1445/1832 support zone.
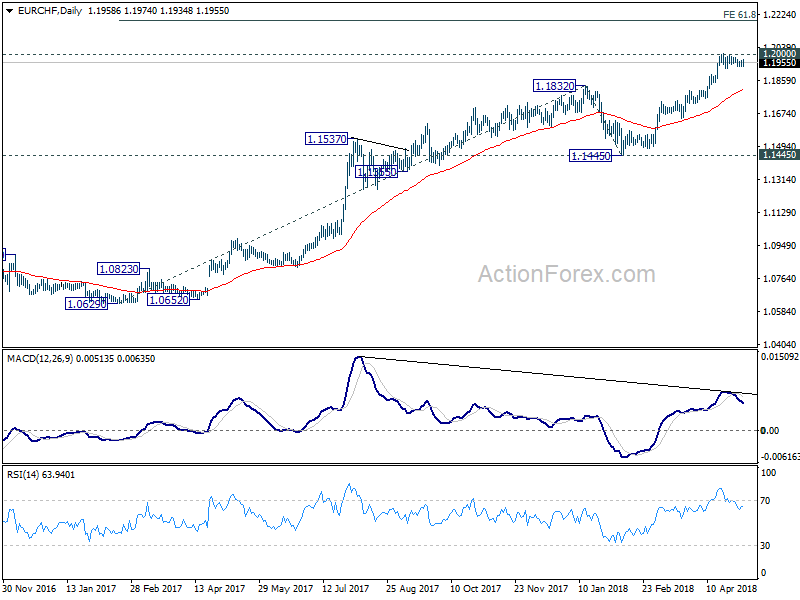
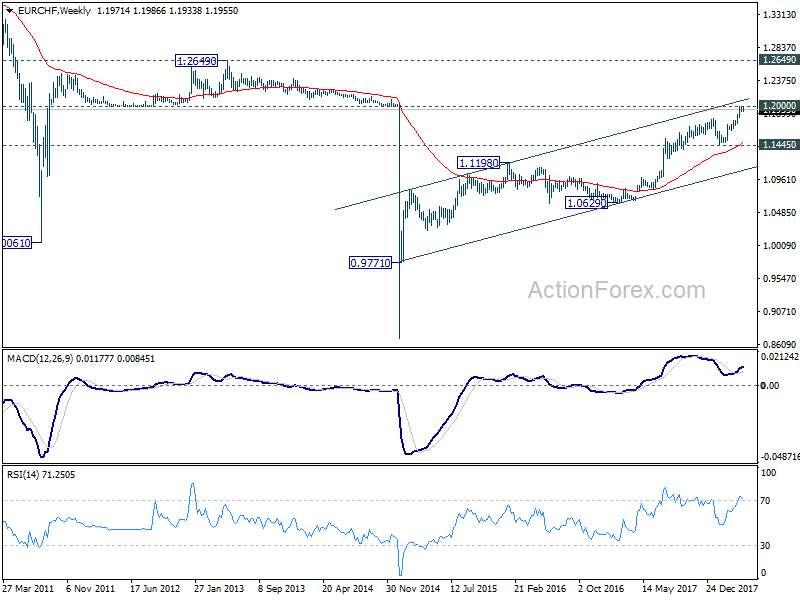
In the bigger picture, long term up trend in EUR/CHF is still in progress. Prior SNB imposed floor at 1.2000 was already met but there is no sign of reversal yet. As long as 1.1445 support holds, we'd expect the up trend to extend to 2013 high at 1.2649 next.
Yen Beat Dollar as the Strongest in Yields Driven Forex Markets
Dollar ended last week broadly higher except versus the Japanese Yen. While economic data from the US were generally disappointing, they were not bad enough to alter Fed's path of three rate hikes this year. Just that, the data didn't add to the chance of the fourth hike in December. On the other hand, data from Eurozone and UK re-confirmed the slowdown in Q1 and the lack of solid momentum in the rebound in Q2. Such development added to the case for ECB to exit stimulus later, and for BoE to delay the next rate hike. The change in ECB and BoE expectations continued to be reflected in France, Germany and UK stock markets. And equally importantly, German bund yield and UK Gilt yield ended deeply lower. Together with retreat in US treasury yields, they provided the boost to Yen, which ended as the strongest one. And not surprisingly, Sterling and Euro were the biggest losers last week.
Hawkish Fed offset data disappointment, Fed rate path pricing largely unchanged
To recap, US headline PCE accelerated from 1.7% yoy to 2.0% yoy in March. Core PCE also accelerated from 1.6% yoy to 1.9% yoy. That was the main positive set of data last week. ISM manufacturing dropped to from 59.3 to 57.3 in April. ISM services dropped to 56.8, down from 58.8 and missed expectation of 58.1. Finally, non-farm payrolls reports showed only 164k job growth in April, below expectation of 194k. Unemployment rate did drop from 4.0% to 3.9%. But wage growth was disappointing, with average hourly earnings risen merely 0.1% mom versus expectation of 0.2% mom.
Nonetheless, the FOMC statement showed slightly more hawkish tone on inflation. Fed noted that "both overall inflation and inflation for items other than food and energy have moved close to 2%". That's somewhat an upgrade fro March description that those barometers "have continued to run below 2%". Additionally, the members judged that "Inflation on a 12-month basis is expected to run near the Committee's symmetric 2% objective over the medium- term". In March, they expected inflation to "move up in coming months" and "to stabilize around the Committee's 2% objective over the medium- term". They viewed the risks are "roughly balance" in both meetings. Yet, the reference that "the Committee is monitoring inflation developments closely" was removed in May. This evidenced the members growing confidence that inflation would reach the target as expected. More in FOMC More Hawkish on Inflation, June Rate Hike a Done Deal
After a week of heavy weight events, Fed fund futures are still pricing in 100% odds of a June Fed hike. Chances priced in for September and December rates are largely unchanged. September odd at around 73-4%, December odd at only around 42-43%.
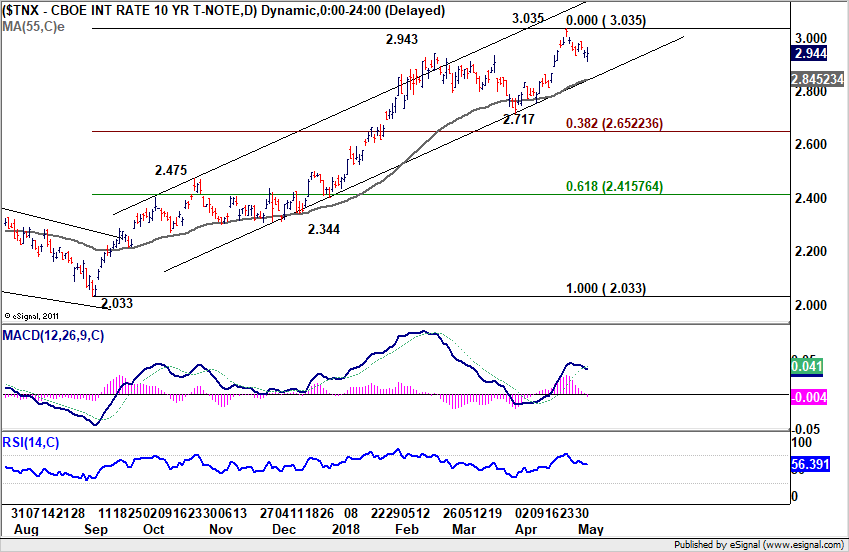
10 year yield extended retreat from 3.035
10 year yield extended the pull back from 3.035 short term top as expected. And thus, it provided little support to Dollar over the week. Stocks were also mainly driven by earnings as DOW engaged in very volatile trading inside recently established range. The pattern from 3.035 so far argues that it's only in a near term correction. That is, we're now leaning towards the case of strong support from 55 day EMA (now at 2.845), which is also close to channel support, to contain downside. Retest of 3.036 (2013 high) key resistance could be seen earlier then we originally thought.
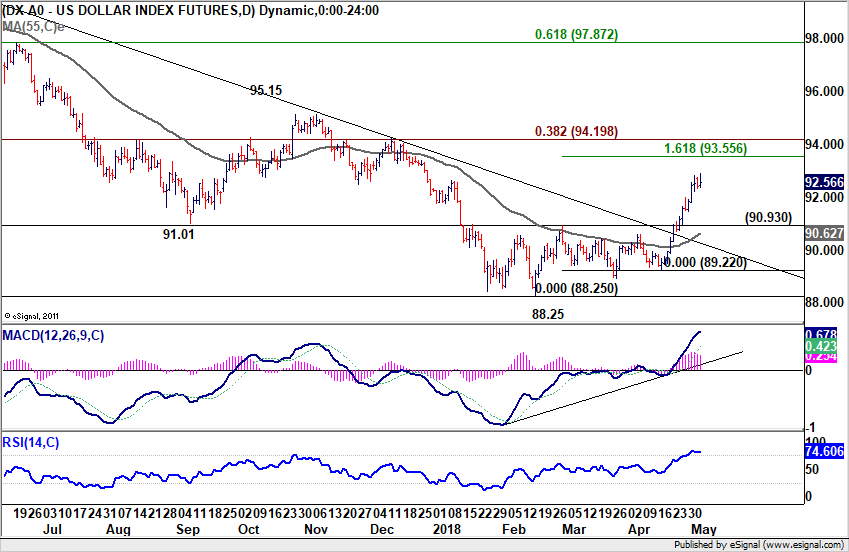
Dollar index showed impulsive rally
Dollar index's solid rally last week was mainly driven by selloff in EUR/USD. But after all, the firm break of 100% projection of 88.25 to 90.29 from 89.22 at 91.90 argues that rise from 88.25 is an impulsive move. That adds to the case of medium term trend reversal. The loss of momentum in some dollar pairs suggests that a near term retreat is possibly due in greenback. But in any case, near term outlook in DXY will remains bullish as long as 90.93 resistance turned support holds. We'd expect further rise ahead to 161.8% projection at 93.55 next. That could hinge on the April CPI figures to be released on Wednesday.
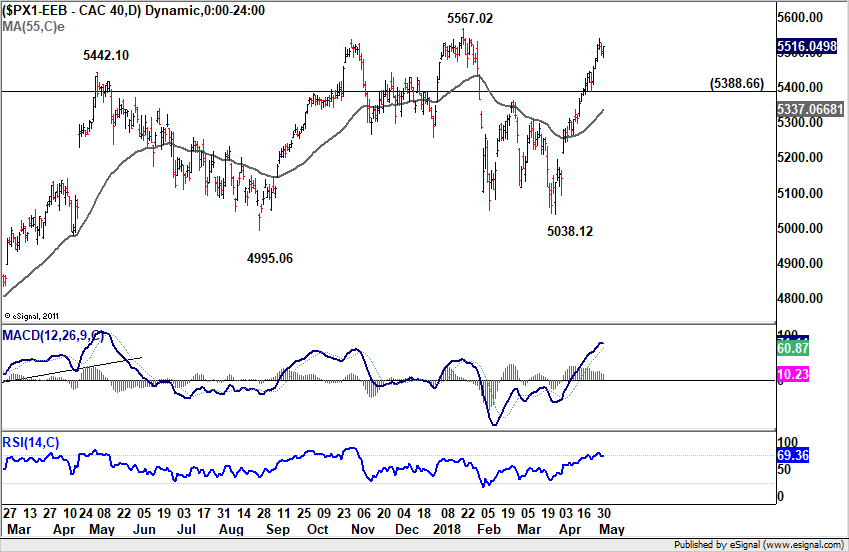
CAC and DAX surged on receding ECB exit expectations
Eurozone GDP growth slowed to 0.4% qoq in Q1, down from prior 0.6% qoq. Headline CPI slowed from 1.3% yoy to 1.2% yoy in April, below expectation of 1.3% yoy. Core CPI was even worse, slowed from 1.0% yoy to 0.7% yoy, below expectation of 0.9% yoy. Would the data give ECB President Mario Draghi and his colleagues better ideas on the factors behind Q1 slowdown? We may get some hints from their comments later. But for now, April's fall in inflation will definitely trigger some deep thinking in their minds. The questions in the markets remain. That is, will ECB stop the EUR 30B monthly asset purchase program after September? We may not get the answer in June meeting.
The speculation that ECB could extend the asset purchase program, even tapered, drove European stocks high. France CAC 40 is a clear example. It should be noted that French data were not too bad. Yes, Q1 GDP slowed more than expected from 0.7% qoq to 0.4% qoq in France. However, France PMI composite hit a 2-month high in April at 56.9. On the other hand, German PMI composite hit 19-month low at 54.6. France maybe enjoying a stronger rebound in Q2 than others in the region. And that could explain the better performance in CAC 40 than DAX.
CAC 40 extended recent rally from 5038.12 to as high as 5538.73 last week before closing slightly lower at 5516.04. As long as 5388.66 support holds, further rise is expected to 5567.02 high. Based on current momentum, CAC will likely take out this resistance to resume larger up trend.
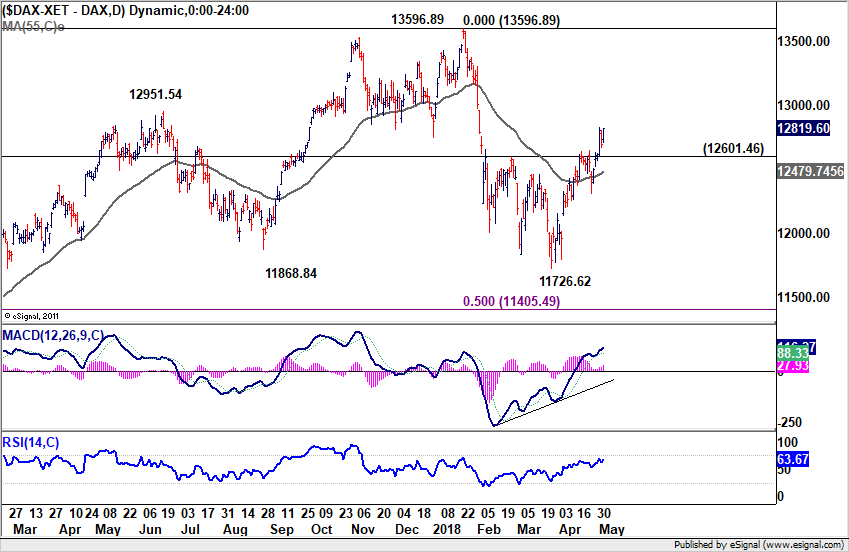
While DAX underperformed CAC, it did manage to break through 12601.46 resistance firmly. The development suggests that pull back from 13596.89 is completed at 11726.62. And further rise would be seen to retest 13596.89.
BoE projections and voting watched again
UK PMI manufacturing dropped from 55.1 to 53.9 in April, below expectation of 54.8. Construction PMI was a surprise that rose from 47.0 to 52.5 and beat expectation of 50.5. UK Services PMI rose from 51.7 to 51.8, but missed expectation of 53.5. Collectively, the PMI data suggested that rebound in Q2 was far from being strong. And as Markit noted in the release, "the three PMI surveys collectively showed only a muted rebound in business activity after being disrupted by heavy snowfall in March, failing to regain February's pace of growth to suggest that the underlying performance of the economy has continued to deteriorate." And the data will " add to expectations that the MPC will take its finger firmly off the rate hike trigger. Any further slowing will also raise questions as to whether the November rate hike may have been ill-timed."
BoE is now not expected to raise interest rate in the coming Thursday on May 10. Nonetheless, it could still be market moving. Firstly, BoE will release the quarterly Inflation Report and we'll see how the data released in the past three months affect the growth and inflation projections. Secondly, it would be interesting to see if the two known hawks, Ian McCafferty and Michael Saunders, would change their mind and refrain from voting for rate hike again.
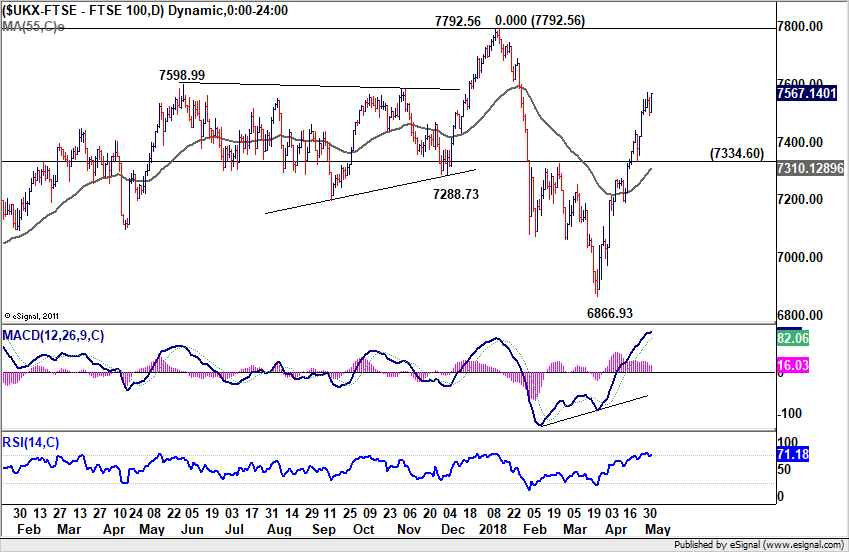
FTSE's rally from 6866.93 continued last week and reached as high as 7572.98. With the help of receding BoE hike expectation, and depreciation of Sterling, we'd expect the index to extend such rise to retest 7792.56 high next.
Falling European yields were behind steep fall in EUR/JPY and GBP/JPY
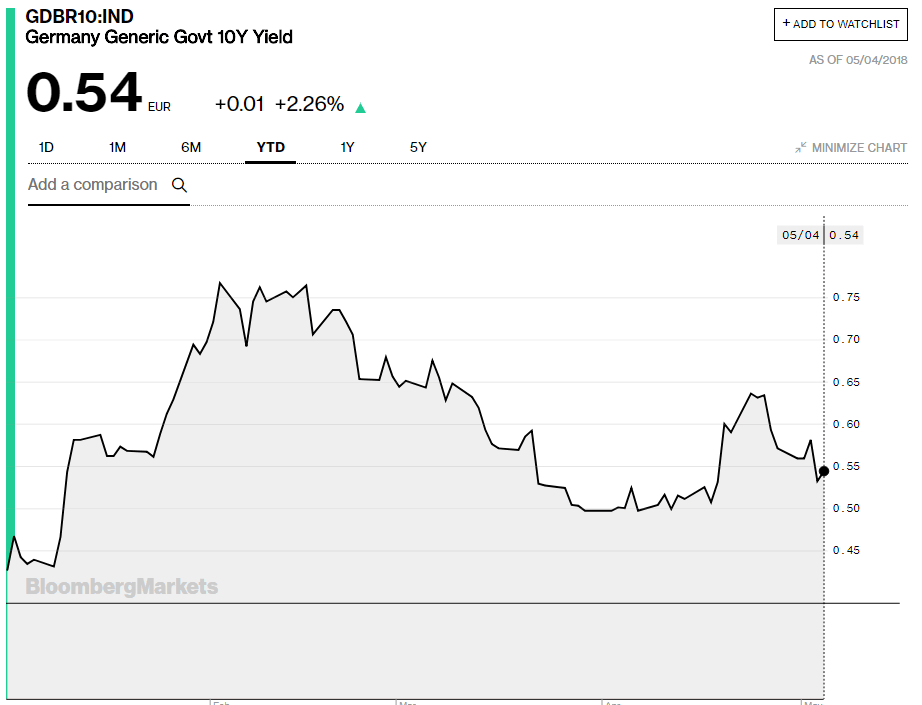
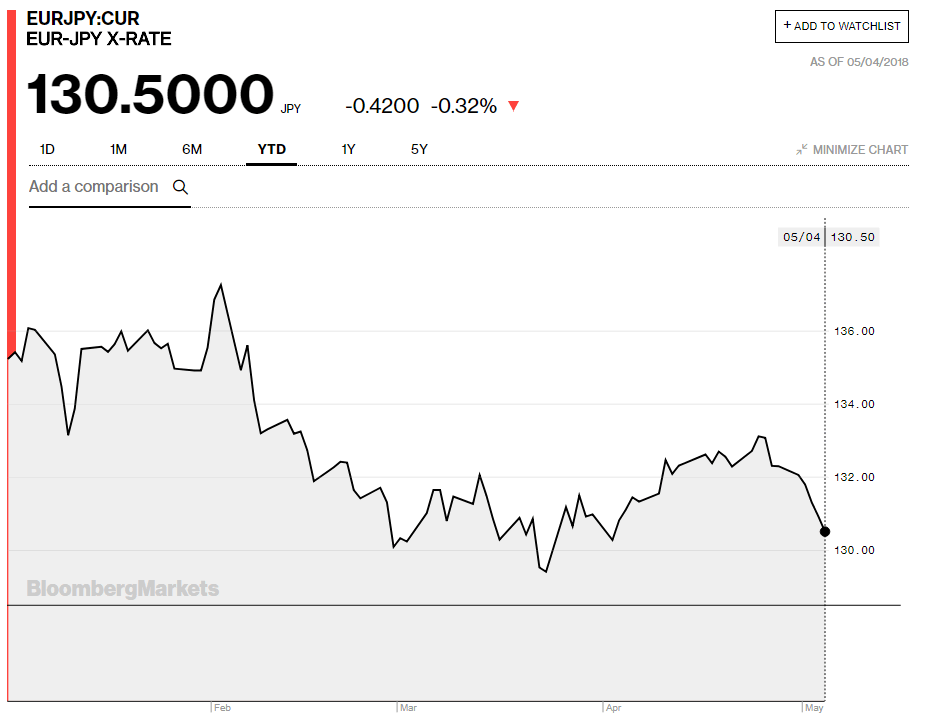
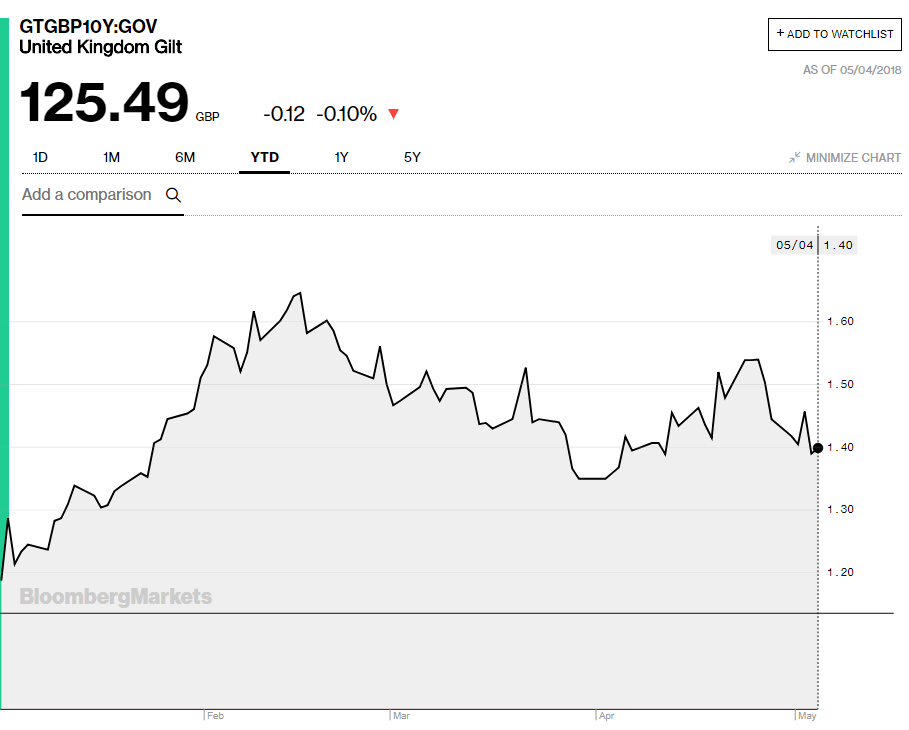
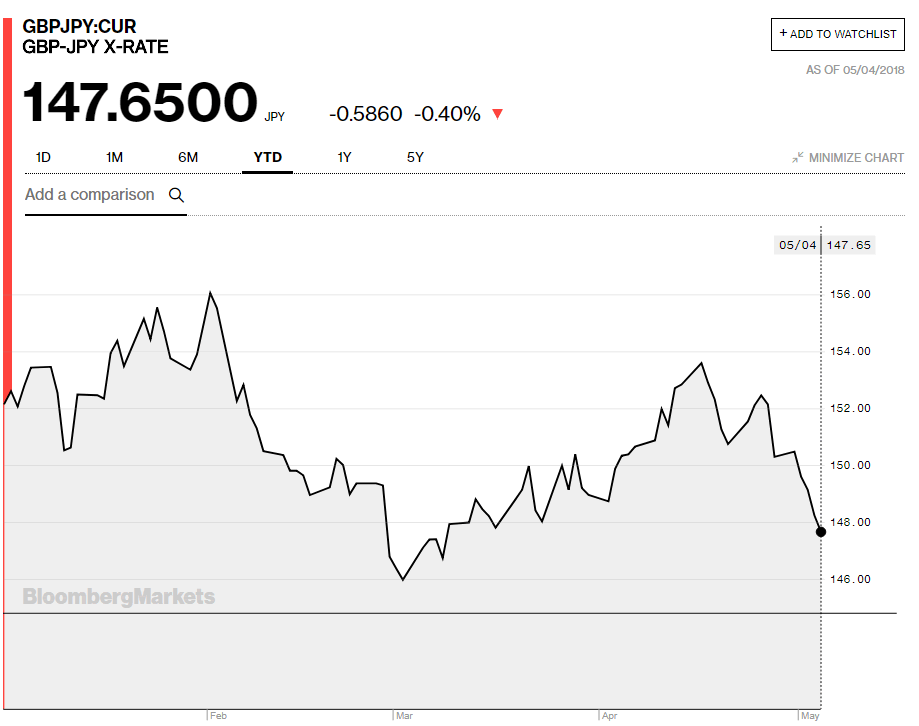
Finally, we'd like to point out that German bund 10 year yield and UK Gilt 10 year yield have been in down trend since since late May. That's very much due to weak data as well as expectations on ECB and BoE rate path. It's seems rather apparent that EUR/JPY and GBP/JPY are following the path of bund and gilt yields since the start of the year, rather than risk sentiments. And for the same reason, even though Dollar was strong, Yen was stronger as US 10 year yield retreated.
GBP/JPY Weekly Outlook
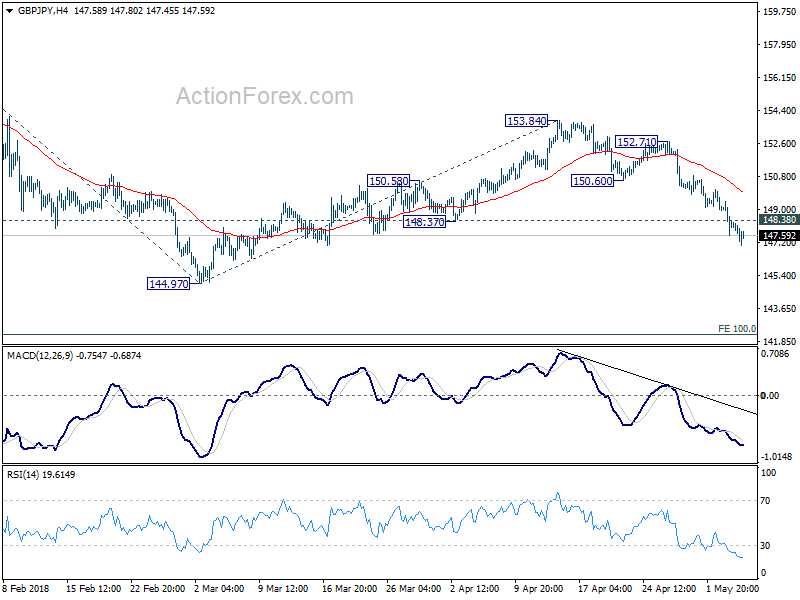
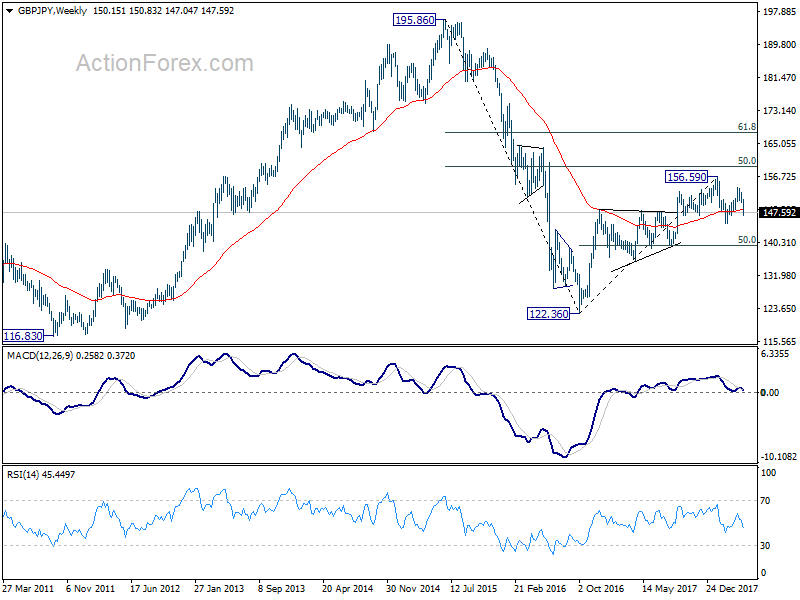
GBP/JPY's fall from 153.84 accelerated to as low as 147.04 last week. The development is in line with our view that corrective rise from 144.97 has completed at 153.84 already. And whole fall from 156.59 could be resuming. Initial bias stays on the downside this week for 144.97 low first. Break there will target 100% projection of 156.59 to 144.97 from 153.84 at 142.22 next. On the upside, above 148.38 minor resistance will turn intraday bias neutral and bring recovery. But upside should be limited well below 150.60 support turned resistance to bring another decline.
In the bigger picture, for now, we're treating price actions from 156.59 as a corrective move. Therefore, while deeper fall is expected, strong support should be seen above 139.29 cluster support (50% retracement of 122.36 to 156.59 at 139.47) to contain downside and bring rebound. There is still prospect of extending the rise from 122.36. However, considering that GBP/JPY failed to sustain above 55 month EMA (now at 153.94), firm break of 139.29 will confirm trend reversal and turn outlook bearish.
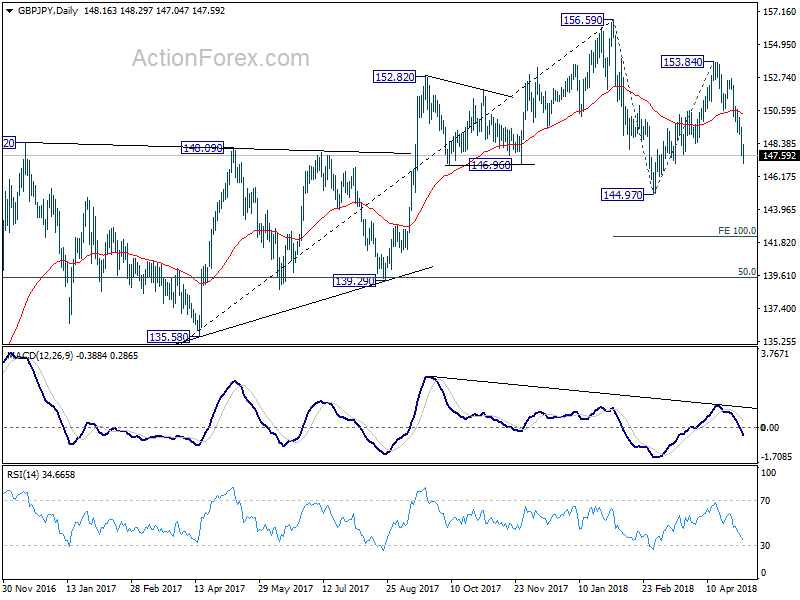
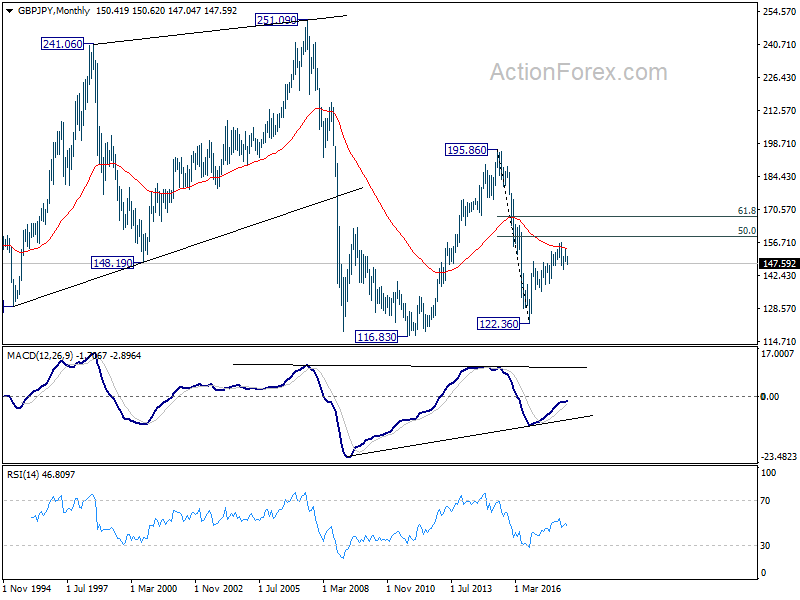
In the longer term picture, the failure to sustain above 55 month EMA (now at 153.94) is mixing up the outlook. Nonetheless, as long as 139.29 holds, rise from 122.26 is in favor to extend to 50% retracement of 195.86 (2015high) to 122.36 (2016 low) at 159.11, and possibly further to 61.8% retracement at 167.78 before completion. However, firm break of 139.29 will turn focus back to 116.83/122.36 support zone instead.
Summary 5/7 – 5/11
Monday, May 7, 2018
[php_everywhere instance="1"]
Tuesday, May 8, 2018
[php_everywhere instance="2"]
Wednesday, May 9, 2018
[php_everywhere instance="3"]
Thursday, May 10, 2018
[php_everywhere instance="4"]
Friday, May 11, 2018
[php_everywhere instance="5"]
Weekly Economic and Financial Commentary: Data Releases Mostly Come in Lukewarm
U.S. Review
Solid Payroll Gain and Jobless Rate Falls to 3.9 Percent
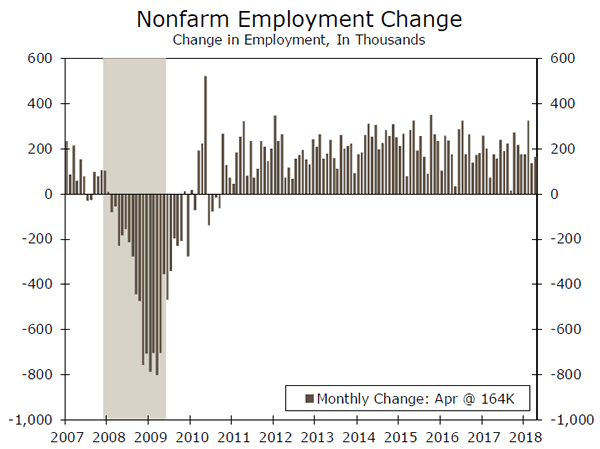
- This morning's jobs report ended a busy week of data on a solid note. The economy added 164,000 jobs in April, and the jobless rate fell 0.2 percentage points to 3.9 percent. The payroll gain was less than the consensus estimate, as we expected, but still represented a solid rebound from March and pointed to strong underlying demand for labor.
- Other reports from across the economy this week were largely supportive of our view that growth is set to pick up modestly as the year progresses and the Federal Reserve should continue to raise interest rates. We expect the next increase will be in June with two more by the end of the year.
Data Releases Mostly Come in Lukewarm
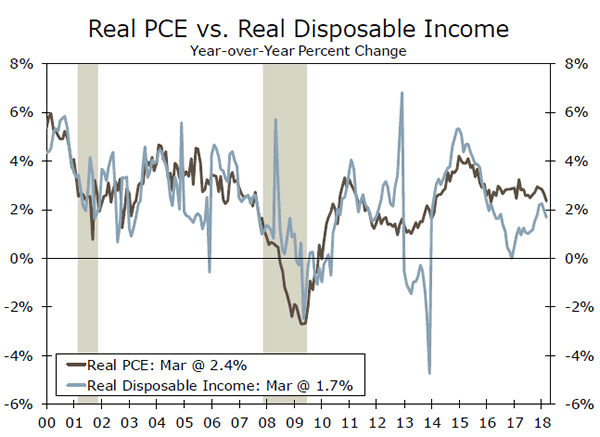
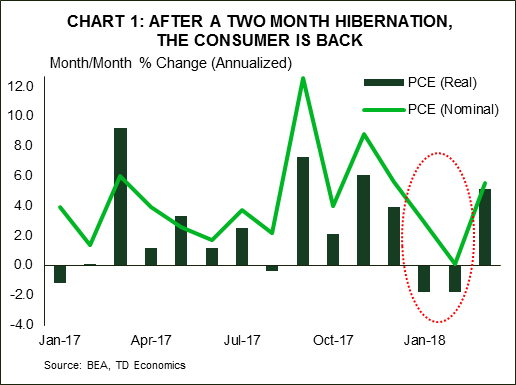
The data calendar was packed this week and largely reinforced the Fed's view that the economy is growing moderately with roughly balanced risks to the outlook. The personal income and spending report showed an encouraging spending rebound in March. Consumer spending rose 0.4 percent during the month on both a real and nominal basis. The 0.4 percent rise came on the heels of a weaker February gain, with nominal spending flat and real spending declining 0.2 percent. We already knew that consumer spending took a breather in Q1 from last week's GDP report, which showed only a 1.1 percent acceleration in Q1 PCE. The solid print in March suggests spending had solid momentum going into the second quarter, which gives us more confidence in our call for a solid bounce back. Moreover, fundamentals point to more consumption in Q2. The strong job market has supported income growth, though March's increase was a bit slower. The report also showed the PCE deflator, the Fed's preferred inflation gauge, hit the year-over-year target of 2 percent in March. That confirmation should encourage the FOMC to forge ahead with its plans to increase interest rates, and we expect the next move will be in June. Rising interest rates are likely to put further pressure on those seeking to purchase a home. Many homebuyers are facing a dearth of available inventory in their price range. Pending home sales for March showed a smaller-than-expected rise of 0.4 percent, and the number of signed contracts remained below their year-ago level for the third straight month. Residential construction spending also declined in March, contributing to the 1.7 percent decline in overall outlays. January and February's outlays were revised higher and spending remains up year to date, suggesting construction activity is still gaining momentum despite the disappointing report in March.
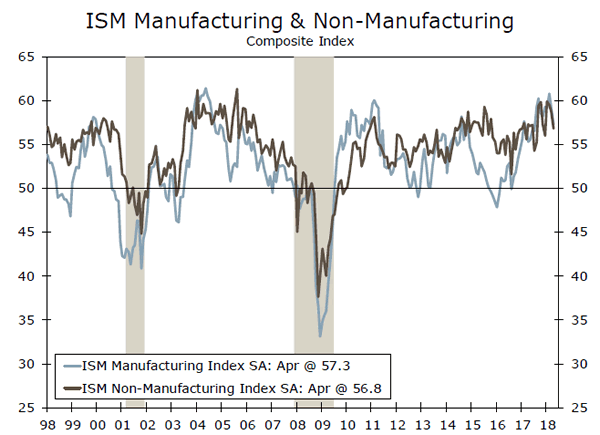
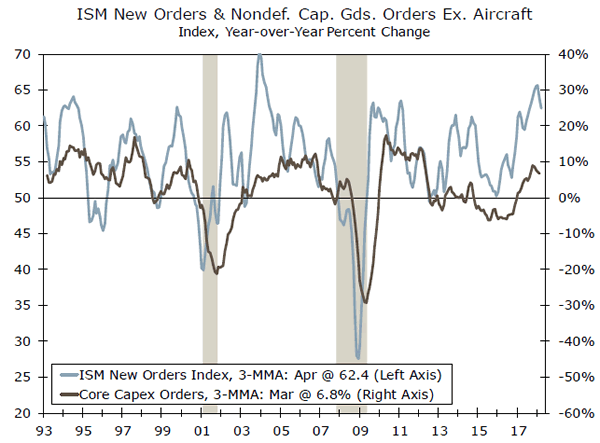
The factory sector is growing, although it may be approaching capacity as strong demand both domestically and abroad is testing production limits. The ISM manufacturing survey slipped again in April but remains close to its February high and still points to solid expansion in coming months. Responses reiterated concerns that limited labor supply and supply chain disruptions are restraining production. Delivery times have lengthened and backlogs rose to a 14-year high. This contributed to higher prices paid for many industries, which will likely push up consumer prices as costs are passed along or eat at profit margins. Headline factory orders rose in March, representing a surge in commercial aircraft orders. The underlying details were less indicative of increasing growth in business equipment spending. Core capital goods orders and shipments were down on the month. Business equipment has boosted topline GDP in each of the past six quarters, but the softening in core orders suggests the fastest quarterly growth rates may be behind us.
Non-manufacturing prices paid also increased in April to its strongest reading since 2012, excluding hurricane-induced spikes. The non-manufacturing ISM composite also eased in April but remains elevated, pointing to continued growth in the services and construction sectors.
U.S. Outlook
NFIB Small Business Optimism • Tuesday
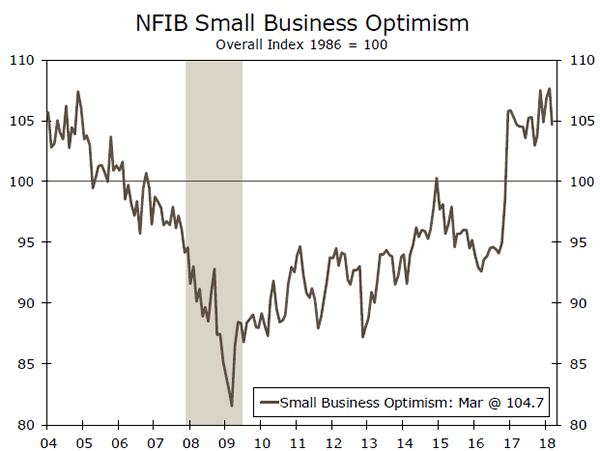
The NFIB index pulled back in March, but small businesses continue to exude a high degree of optimism about the economy. Hiring plans, capital spending expectations and the share of firms seeing stronger profits all remain near the highs of the current expansion.
The NFIB index is expected to be little changed in April, although we note some potential for weakening following another month of contentious trade talk. Other business surveys point to some softening in recent business conditions, including both ISM surveys and the latest Wells Fargo Small Business Survey. All continue to sit at fairly high levels, however, and suggest small business optimism remained strong last month.
Previous: 104.7 Consensus: 105.0
Producer Price Index • Wednesday
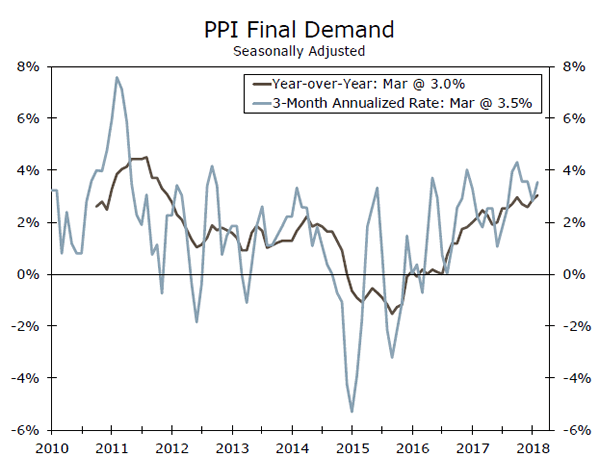
Producer price inflation came in slightly above expectations in March with a gain of 0.3 percent and has been rising steadily over the past year. The rebound in oil has helped fuel the pickup, but price growth has strengthened for core components as well. Services costs in particular have gained momentum, rising at a 3.5 percent annualized rate in the three months through March.
We expect the PPI for final demand to moderate slightly in April, with the index increasing 0.2 percent from March and 2.8 percent compared to last April. Energy costs were higher last month, but we expect some payback from an unusually large rise in food prices. Pipeline pressures also eased a touch in March, with prices for intermediate goods falling and price growth for intermediate services moderating after a strong rise in February.
Previous: 0.3% Wells Fargo: 0.2% Consensus: 0.2% (Month-over-Month)
Consumer Price Index • Thursday
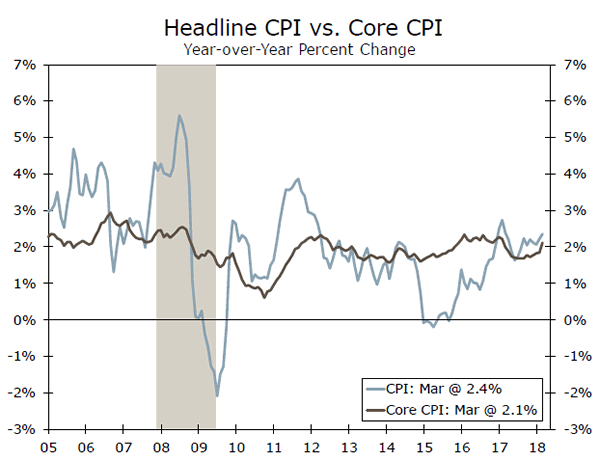
Consumer price inflation fell in March for the first time in a year. The o.1 percent drop was entirely driven by a pullback in energy costs. We expect to see a reversal of this dynamic in April. According to AAA, gasoline prices rose 6.2 percent last month, which is a bit more than usual for this time of year.
In contrast to the headline, core inflation posted another solid gain in March. The core index in recent months has advanced at the strongest pace since 2011. A revival in core goods prices has helped spur the pickup, but renewed pressure on vehicle prices and the halt in the dollar's slide suggest support from this category could fade. Core services inflation, however, remains strong, helped by higher shelter, medical and transport costs.
All told, we anticipate the CPI rose 0.3 percent last month, with the core index increasing 0.2 percent.
Previous: -0.1% Wells Fargo: 0.3% Consensus: 0.3%
Global Review
Eurozone GDP Slows in Q1; Mexico Adds to Uncertainty
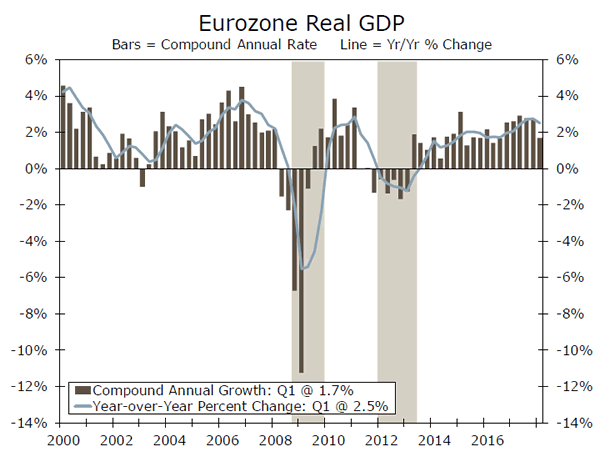
- The Eurozone economy grew 0.4 percent in Q1, not annualized, and by 2.5 percent on a year-earlier basis. This performance matched market expectations.
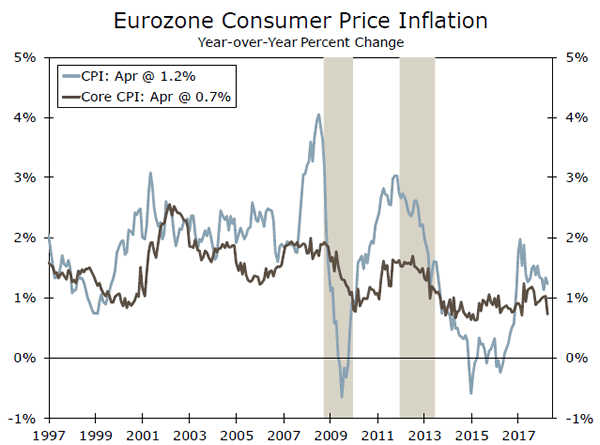
- Eurozone consumer prices increased just 1.2 percent on a yearearlier basis versus expectations of a 1.3 percent increase. This was down from a 1.3 percent print for the year ending in March.
- Large discrepancies between the seasonally-adjusted data and non-seasonally adjusted data for Mexican GDP in Q1 is adding to the political uncertainty hitting the country due to the upcoming presidential elections. Andrés Manuel López Obrador (AMLO) is expected to win if political surveys are any guide.
Eurozone GDP Slows a Bit in Q1
For weeks now, markets have been reacting to several weaker economic data points coming from the Eurozone. This is in contrast to the relatively strong pace it exhibited during the last quarter of last year. The release of the advanced number for GDP growth in the Eurozone for Q1 confirmed what markets had been pricing for a while. According to the report, the Eurozone economy grew 0.4 percent in Q1, not annualized and by 2.5 percent on a year-earlier basis. This performance matched market expectations. However, not all the news on the economy was weaker as the result for Q4-2017 was revised slightly upwards from an original 0.6 percent, not annualized sequential growth, to 0.7 percent. Meanwhile, the year-over-year gain was revised up from 2.7 percent to 2.8 percent, which makes the 0.4 percent sequential growth and the 2.5 percent print in Q1 a little bit stronger than what markets were expecting.
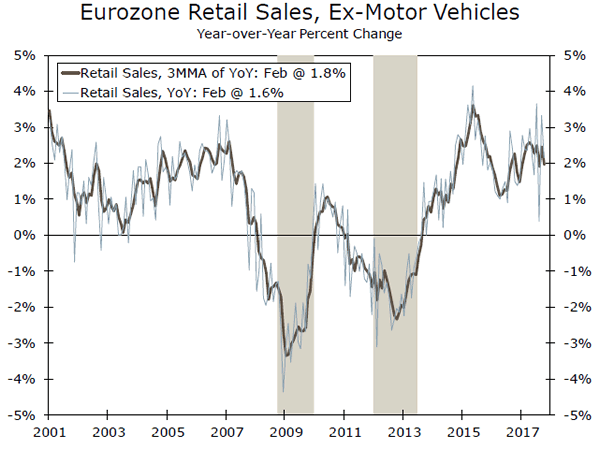
Perhaps the biggest concern for the European Central Bank (ECB) was the news on inflation, which also came in below market expectations. Consumer prices increased just 1.2 percent on a yearearlier basis versus expectations of a 1.3 percent increase. This was down from a 1.3 percent print for the year ending in March. Furthermore, the core CPI was even lower on a year-earlier basis, increasing 0.7 percent compared to a 1.0 percent rate in March, year over year. The fact that core prices are still slowing down will keep the ECB from changing monetary policy any time soon. Eurozone retail sales increased less than expected 0.1 percent in March, month on month, compared to market expectations of a 0.5 percent increase. At the same time, the year-over-year rate declined from 1.8 percent in February to just 0.8 percent in March. Markets were expecting the year-over-year rate at 1.9 percent. However, it was not all bad news as the February month-on-month print was revised up from 0.1 percent to 0.3 percent.
Mexican Economy Adds to Uncertainty in Q1.
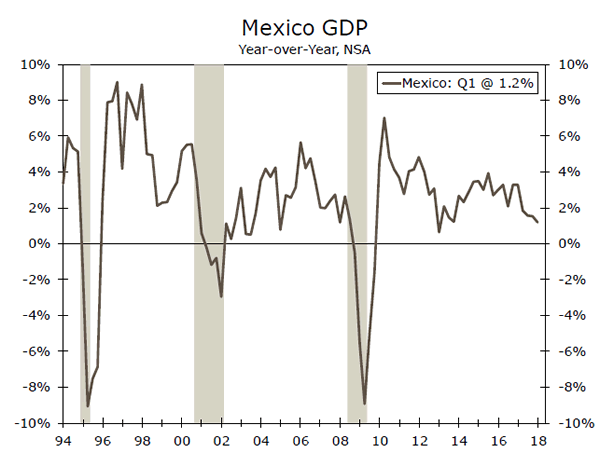
Large discrepancies between the seasonally-adjusted data and non-seasonally adjusted data for Mexican GDP in Q1 is adding to the political uncertainty hitting Mexico due to the upcoming presidential elections. Andrés Manuel López Obrador (AMLO) is expected to win if political surveys are any guide.
The Mexican economy grew a strong 1.1 percent sequentially and seasonally-adjusted in Q1 while growing 2.4 percent compared to a year earlier. However, the non-seasonally adjusted performance in Q1 compared to the same quarter a year earlier showed a weaker economy, up only 1.2 percent. The mismatch between seasonally and non-seasonally adjusted results has to do with the Easter season falling mostly in Q1 this year compared to last year. However, we believe that both numbers may not reflect the true state of the Mexican economy. That is, the economy's performance is probably not as strong as the seasonally-adjusted numbers reflect, while it is not as weak as the non-seasonally adjusted numbers show. Thus, we will wait for more information on Q2 to make adjustments to our current call on Mexican GDP growth, which stands at 1.9 percent for the whole of 2018.
Global Outlook
Australian Retail Sales • Tuesday
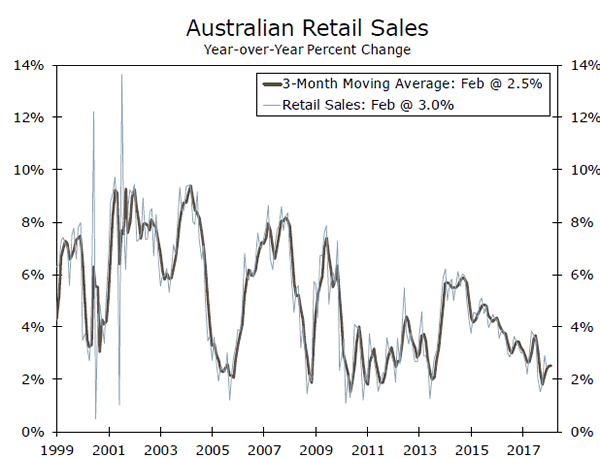
Retail sales were up 0.6 percent in February, which was the strongest month-over-month increase since November 2017. This rise in spending was broad based, with sales increasing across all major categories in February. Despite this rise in spending, household consumption continues to be a key area of uncertainty for the Reserve Bank of Australia, which had elected to keep its key lending rate unchanged at 1.50 percent at its March meeting. Weak wage growth and high household debt levels continue to weigh on household consumption. Despite expectations that inflation growth will likely remain lackluster for some time, we expect to eventually see the continued improvement in the labor market translate into higher wages. Strong competition among retailers as well as difficulty finding skilled workers will eventually cause price pressures to materialize, while fostering conditions for increased consumption.
Previous: 0.6% (Month-over-month) Consensus: 0.3%
Bank of England Meeting • Thursday
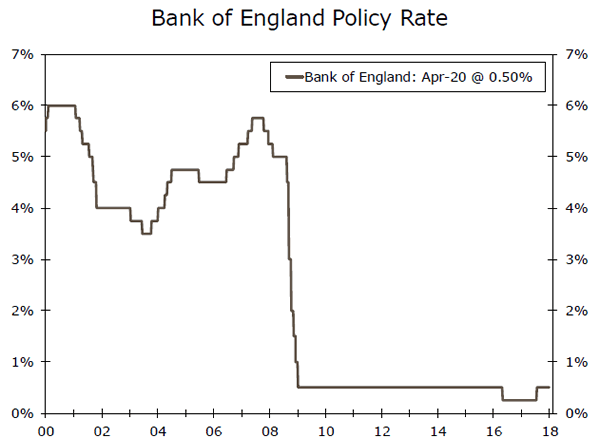
Real GDP in the United Kingdom grew just 0.1 percent in the first quarter, well below market expectations of 0.3 percent. While some of the first quarter weakness may be due to bad winter weather, the slower overall pace of growth raises questions about the underlying health of the British economy. Despite the more hawkish rhetoric of the Monetary Policy Committee (MPC) following their March meeting, we expect the weaker-than-expected first quarter GDP print to likely cause a "wait and see" policy approach of the MPC at the Bank of England. We now expect the MPC to remain on hold until August, as they examine incoming economic data in coming months prior to further tightening policy. We expect inflation to continue to recede, which should spur growth in real income and consumer spending in the quarters ahead. Conditions should foster stronger growth, which would be supportive of further rate hikes from the MPC, albeit at a gradual pace.
Previous: 0.50% Wells Fargo: 0.50% Consensus: 0.50%
Canadian Employment • Friday
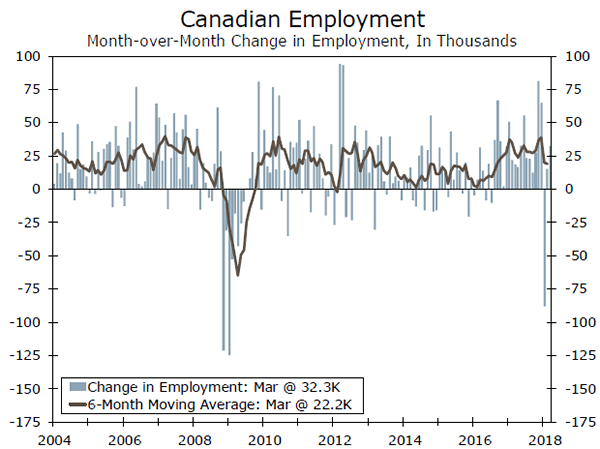
Employment growth started the year mixed in Canada. After surprising to the downside in January, by posting a flat-out decline, employment has regained strength in February and March. The 32,300 increase in new jobs in March helped keep the unemployment rate at 5.8 percent for the second consecutive month. The only other time the unemployment rate has reached this historically low level was in 2007. Average hourly earnings have also continued to strengthen since bottoming in April 2017. Canada's tight labor market conditions could begin to start seeing some signs of cooling as it nears full capacity. The economy grew a breakneck 3.0 percent in 2017 as a whole, while industrial capacity utilization rates edged up throughout the year. Conditions are supportive of rising inflationary pressures, as core measures of CPI have continued to edge higher, and will likely remain supported by resource constraints and steady wage increases.
Previous: 32,300 Consensus: 19,600
Point of View
Interest Rate Watch
Inflation, FOMC and 2-Year
Over the past week, economic information, policy pronouncements and a hypothesized link between the two year yield and dividend yields have caught the markets attention.
Compensation, Not Wages, are Focus
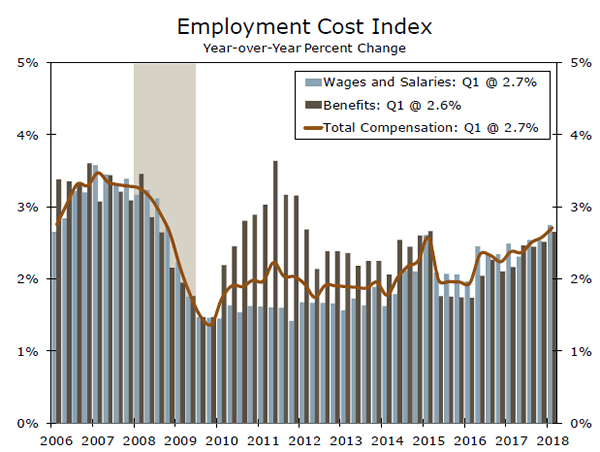
Labor costs are rising amid a tight labor market. Despite all the commentary about low/sluggish wages, the hype misses the reality. As evidenced in the top graph, labor compensation has been steadily rising since late 2016, with both benefits and wages on the upswing. In the modern labor market, wages alone do not tell the story of a tight labor market. Workers have broadened their concerns to include benefits—such as health care and pension benefits.
The Employment Cost Index for private industry is up 2.9 percent year-over-year and this rise in compensation is consistent with the drop in the unemployment rate since 2010—even though the common perception is that labor compensation is not linked to lower unemployment—benefits matter—not just wages.
FOMC and That 2% Target-A Fourth?
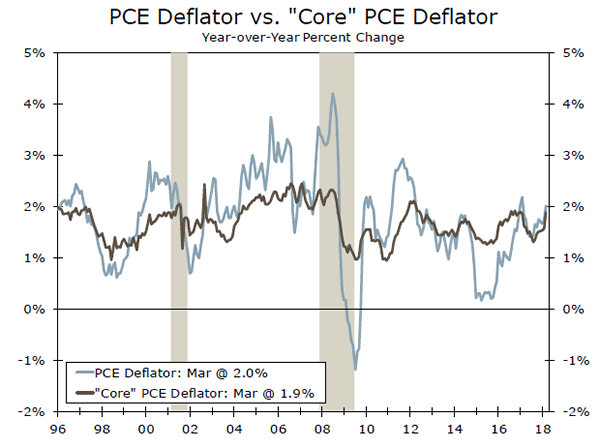
Earlier this week, the headline year-overyear PCE deflator hit the 2 percent FOMC target, as illustrated in the middle graph. Moreover, the headline PCE deflator has risen at a 2.4 percent pace over the past three months. This supports the view that the FOMC will raise the fed funds rate again in June (June 13 will be the press conference with a new dot plot).
What we will be watching, will be if the FOMC adds a fourth rate hike in 2018 and to what extent the FOMC emphasizes that their 2 percent target is flexible and will allow for a period of above 2 percent inflation.
Two-Year Rate and Dividend Yield
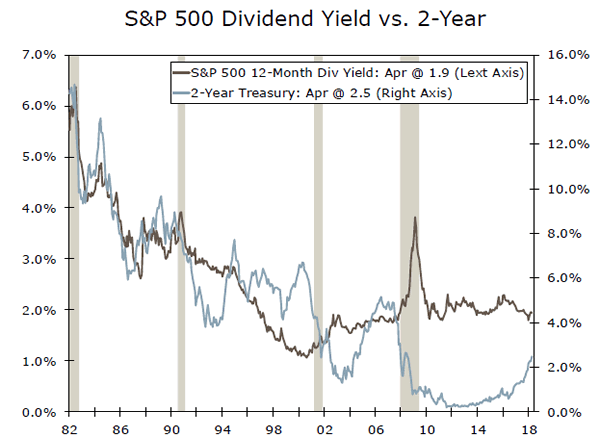
As the two-year Treasury rate has risen over the past year, there has been commentary that rising rates will be competition for equities. As illustrated in the bottom graph, there would appear to be some linkage. While the two-year yield did lead to changes in dividend yields from 1982-1999, that link has since disappeared.
Credit Market Insights
Update on the Consumer
Last week, the University of Michigan Consumer Sentiment Survey for the month of April was released. Overall consumer sentiment fell 2.6 points on the month, with the drop coming from a 6.3 point decline in consumers' assessment of current economic conditions.
Unsolicited comments from participants are kept track by the survey. Favorable views on taxes were mentioned more than three times more often than unfavorable tax reform mentions. What likely dragged down the current assessment of consumers is concern over trade policy and tariffs. Twenty-four percent of consumers mentioned trade restrictions and tariffs in a negative light in the midst of NAFTA negotiations and trade rhetoric with China.
The survey also showed that more than half of respondents noted improved household finances over the past year, with just 15 percent saying they have worsened. The improvement of household finances bodes well for sales of homes and motor vehicles. Sixty-nine percent of consumers feel that now is a good time to buy a vehicle, with just 25 percent saying now is a bad time. Similarly, 71 percent of consumers in the survey feel that now is a good time to buy a home, marking the fourth consecutive monthly increase.
Consumers essentially feel confident about their personal and household finances, but express some nervousness surrounding protectionist trade rhetoric and potential tariffs.
Topic of the Week
Till Debt Do Us Part
On Wednesday, the U.S. Treasury released its Quarterly Refunding Statement, which outlines the government's borrowing intentions over the next few months. Auction sizes for coupon-bearing Treasuries were once again increased across-the-board to help meet the federal government's rapidly rising borrowing needs.
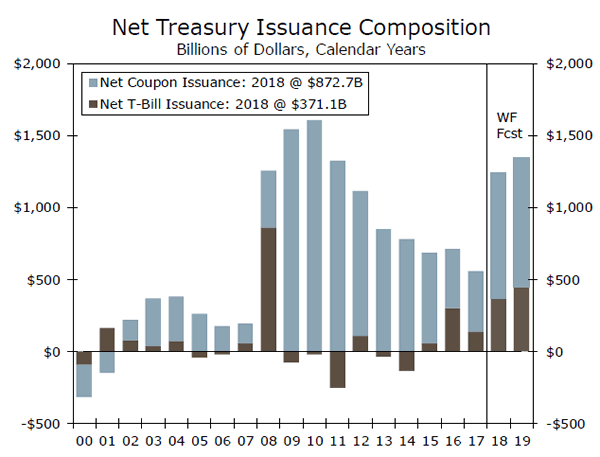
As illustrated in the top chart, we expect net Treasury issuance to skyrocket this year and next. The jump in issuance has been driven by both technical and fundamental factors. On the technical side, the Treasury operated under the debt ceiling for much of 2017, creating a backlog of debt in the pipeline that was issued in Q1-2018 once the debt ceiling was suspended. Net T-bill issuance was $333 billion in Q1, the most since Q4- 2008, when skyrocketing deficits and financial market turmoil warranted a flood of short-term, highly liquid U.S. debt.
On the fundamental side, the triple whammy of tax cuts, the recent budget deal and Federal Reserve balance sheet redemptions have significantly increased the amount of money that must be raised from the public at auction. Structural factors related to the aging of the population and rising interest rates are also contributing to underlying deficit pressures.
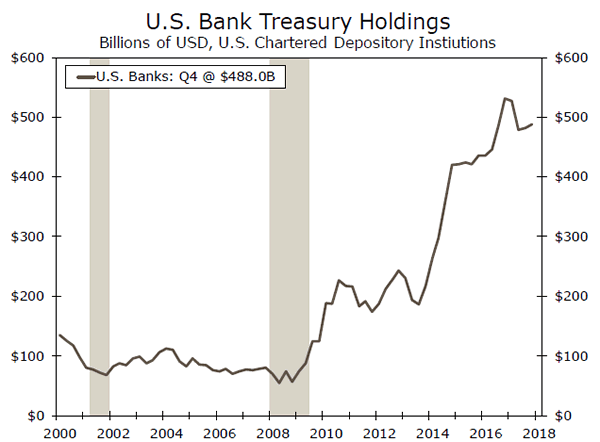
This surge in supply naturally raises the question: who will buy all this new debt, and at what price? In our view, some of the most robust sources of demand over the past few years are likely to see the pace of their purchases slow. U.S. banks, for example, were a major net buyer of Treasury securities over the past few years as financial institutions bought Treasuries to grapple with a slew of new bank regulations (bottom chart). The pace of buying appears to have slowed recently, however, and the Trump administration has signaled a desire to make financial regulation less onerous going forward.
We have written extensively on this topic from both the supply and demand side, and this series of reports is available upon request.
The Weekly Bottom Line: Fed Increasingly Confident On Inflation Outlook
U.S. Highlights
- Investors were kept busy this week with plenty of top-tier data, both internationally and domestically, alongside a Fed meeting mid-week. International PMIs suggested some slowing in global economies, largely related to trade tensions.
- U.S. PMIs also pulled-back, but other data was far more constructive. Consumer spending accelerated to 0.4% in March, setting the second quarter on a solid growth path, which should come in near 3%.
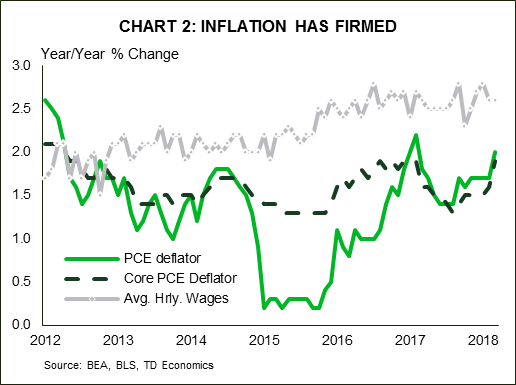
- Firming inflation was the main story this week, with the PCE deflator (and core measure) accelerating to 2.0% and 1.9%, respectively. The Fed has taken notice of this, indicating in the statement a more confident view of the inflation outlook. This should enable the Fed to raise rates at least twice more this year, with three hikes likely during 2019.
Canadian Highlights
- Economic data released this week was a mixed bag. On the plus side, GDP growth topped expectations in February. However, merchandise trade data for March confirmed that net trade is likely to be a drag on Q1 growth.
- Home sales in April dropped in Toronto, while bouncing higher in Vancouver, though quality adjusted prices declined in both markets. Looking ahead, it will likely be some time before a sustained improvement emerges in either market.
- In a mid-week speech, Governor Poloz continued to flag elevated debt as a key risk to growth, though remained optimistic on the broader economic outlook. With growth advancing largely as expected, we continue to believe the next rate hike will come in July.
U.S. - Fed Increasingly Confident On Inflation Outlook
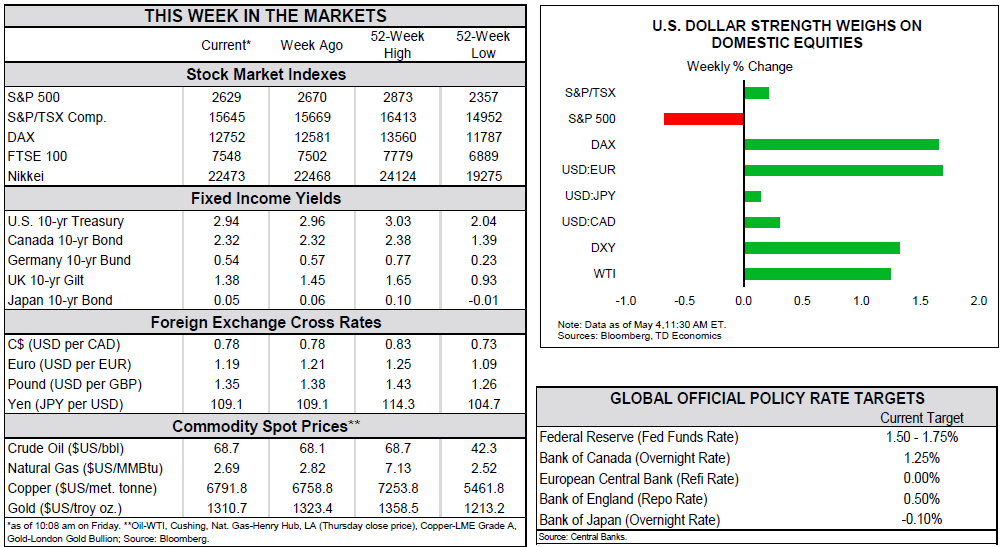
The start of May has been busy for investors with a mid-week Fed rate decision and plenty of economic data to sift through. Domestic data generally outperformed, sending the U.S. dollar and rates higher, but yields pulled back a touch towards Friday. Higher dollar and rates weighed on U.S. equities, while international stocks saw some upward movement on lower yields and exchange rates – related to somewhat weaker data.
International data this week revealed that economic momentum continued to slow in April. The most recent international PMIs softened somewhat, however much of the softness can likely be attributed to heightened trade uncertainty. Protectionist themes and tariffs have been making headlines on a regular basis, denting business confidence and stifling expansion plans. For instance, this week the Trump administration doubled down on demands for China to reduce its trade surplus with the U.S. by $200 billion.
Most critically, domestic businesses appear unable to escape the rising tide of trade protectionism. Both the manufacturing and non-manufacturing ISM indices pulled back 2 points apiece in April. However, they remain near cycle highs, and are indicative of ongoing healthy pace of growth.
Other domestic data confirms that growth remains solid despite the downside risks. Personal income rose by a healthy 0.3% in March, while consumer spending rose 0.4%, consistent with the narrative of tax cuts and rising jobs and wages motivating Americans to shop. A rebound in spending in the second quarter supports an outlook that sees economic activity expanding around 3%, a trend that we anticipate to hold through the end of the year.
The persistence of strong, above-trend growth is driving price pressures higher. Inflation strengthened in March, reaching 2% according to the PCE deflator (the Fed's preferred measure). The core PCE deflator (which strips out the most volatile components) also strengthened to 1.9%, just a hair below the FOMC target of 2%. The Fed took notice of this data during their meeting this week. Although it kept rates on hold, some notable changes to the wording were made. All told, the Fed's confidence regarding inflation and its outlook should provide it with the conviction to keep moving rates higher, assuming wage and prices rise as expected.
This morning's payroll report for April was consistent with this view despite the headline miss. Although wage growth slowed a touch, the drop in the unemployment rate to a 17-year low of 3.9% suggests that wage and price pressures should continue to gradually build.
Ultimately, inflation holding near target is consistent with our call for two more rate hikes from the Fed this year, with the next hike likely coming in June. That said, it's not out-of-the question that the Committee raises rates by another 75 basis points this year. This gradual pace of tightening should help minimize the risk of slowing activity too quickly and resulting in a recession, something the FOMC officials are keenly trying to avoid.
Canada - Economic Data A Mixed Bag For Growth
It was an eventful week on the Canadian economic calendar, with several key data releases and a speech by Governor Poloz leaving markets with plenty to ponder. The Canadian dollar trended sideways during the week despite the competing forces of a solid GDP report, comments concerning household debt by the Bank of Canada Governor and a widening trade deficit. Both the TSX and bond yields were broadly unchanged, with the latter holding near multi-year highs.
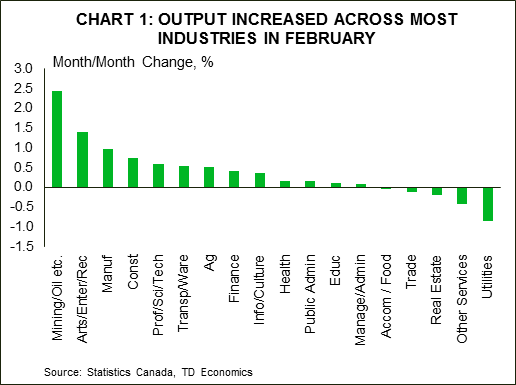
Economic data released this week was somewhat of a mixed bag. On the positive side, GDP growth topped expectations in February, rising 0.4% in the month. Goods sector output advanced at a solid rate, though part of the story was normalizing oil production after one-off disruptions at some facilities in January. Still, the broad-based gain in goods-producing industries was encouraging. Output increased at a much slower rate on the services side, as a large decline in the real estate sector partially offset growth in other services industries. All told, the majority of industries recorded higher output in the month, suggesting healthy underlying momentum (Chart 1).
Though GDP growth rebounded strongly in February, other more forward-looking indicators sent mixed signals. For starters, April home sales dropped in Toronto while bouncing higher in Vancouver. Declining activity in Toronto is somewhat disappointing, as signs of stabilization had emerged recently. In contrast, the increase in activity in Vancouver is encouraging, though given the array of actions taken by the B.C. government to cool activity earlier in the year some additional downside to sales could manifest in coming months. Looking ahead, it will likely be some time before a sustained improvement in activity emerges in either market.
Merchandise trade data pointed to net trade being a drag on growth both in March and the first quarter overall. However, details of the report were more encouraging. Although the notable increase in exports was offset by a surge in imports, the latter likely reflects healthy domestic demand (Chart 2). As such, some of the gain in imports should show up in support of domestic demand for the first quarter, offsetting the drag from trade.
All told, the data suggests that the Canadian economy continues to hum along as expected, with growth expected to pick up in the second quarter after two consecutive quarters of near-trend performance. As such, we believe that the Bank of Canada will move rates higher in July, which affords policymakers sufficient time to monitor wage and inflation dynamics and gauge the sensitivity of the economy to rising borrowing costs.
On that note, Governor Poloz delivered a speech this week focused on the threat that elevated debt levels poses to the economy. The Governor noted that debt remains at a record high relative to income, and that pockets of even greater vulnerability exist beneath the aggregate statistics. Despite the notable downside risk this poses to the economic outlook, he ended his speech by confidently reiterating that the economic outlook is "quite good" and that policymakers can "manage these risks successfully".

U.S.: Upcoming Key Economic Releases
U.S. Consumer Price Index - April
Release Date: May 10, 2018
Previous Result: -0.1% m/m, core 0.2% m/m
TD Forecast: 0.3% m/m, core 0.2% m/m
Consensus: 0.3% m/m, core 0.2% m/m
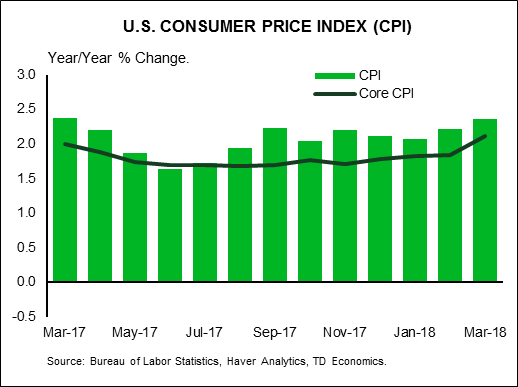
We expect headline CPI inflation to accelerate further to 2.5% y/y in April, with prices up 0.3% m/m on a seasonally adjusted basis. Gasoline prices will lend a strong boost while we expect food prices to pick up after a relatively weak showing in the prior two months. Outside of food and energy, we look for a solid 0.2% m/m print, driving core inflation higher to 2.2%. This assumes some recovery in core goods prices which fell on balance in March and continued strength in services, underpinned by shelter and medical care services.
Canada: Upcoming Key Economic Releases
Canadian Employment - April
Release Date: May 11, 2018
Previous Result: 32k, unemployment rate: 5.8%
TD Forecast: TD Forecast: 25k, unemployment rate: 5.8%
Consensus: 19k, unemployment rate: 5.8%
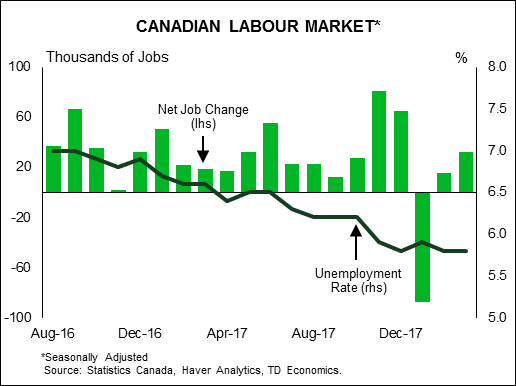
TD looks for the economy to add 25k jobs in April with job growth tilted towards full-time workers. While full-time employment has seen significant gains over the last year, its share of total employment remains below pre-crisis levels and has room to rise. April is also one of the strongest months for full-time job growth, outperforming part-time by nearly 30k on average since the crisis. Meanwhile, wages should see an uptick to 3.3% y/y on positive base-effects, matching the seven-year high and in line with the latest SEPH data. We also expect the unemployment rate to hold at the cycle low of 5.8%, with risks tilted towards an improvement to 5.7%.
Dollar Keeps Going Strong as Growth Concerns Rise in Europe
The US dollar rally continues to gather steam as it appreciated against major pairs for a third week. The U.S. non farm payrolls (NFP) provided little support with a miss in both the headline job number and the much anticipated wage growth component. The main takeaway from the jobs report was the drop in the employment rate from 4.1 percent last month to 3.9 percent. The greenback keeps plowing forward as monetary policy divergence is expected to be wider between the Fed and other central banks. The Reserve Bank of New Zealand (RBNZ) and the Bank of England (BoE) will feature this week and both are expected to keep rates unchanged. Although there are some economists that are still holding on to a possible rate hike in May by the BoE.
- BoE to host Super Thursday with a potential rate hike in the cards
- US inflation expected to rise by 0.3 percent
- Canada to add 20,000 jobs
Dollar Soldiers On Despite US Jobs Miss
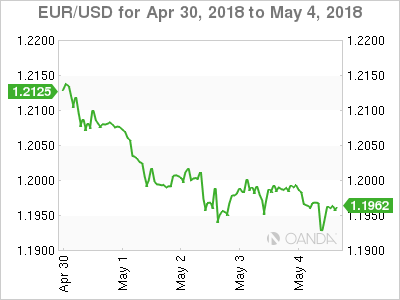
The EUR/USD lost 1.37 percent in the last week. The single currency is trading at 1.1960 after a week heavy with economic released and the release of the U.S. Federal Reserve’s rate statement. European data continues to disappoint with German retail sales shrinking by 0.6 percent and the flash inflation estimate coming short of the forecast at 1.2 percent the biggest drags on the euro. Indicators in the US were not as solid as the previous week with a disappointing ISM non manufacturing PMI and less jobs added in April that was expected.
Growth expectations in the United States remain strong, while concerns are rapidly rising in Europe given the string of soft data. The U.S. Federal Reserve is expected to hike rates 2 or 3 more times this year and with inflationary pressures the third rate hike becomes more tangible. The Fed did hold, and gave little hints of what comes next, but the market has already priced in a 25 basis points in June. In contrast the European Central Bank (ECB) has given few details on what it will do when its quantitative easing program ends in September. The gap between growth and interest rates between the US and the Europe will continue to pressure the EUR next week as several prominent members of the Federal Open Market Committee (FOMC) are scheduled to speak.
The USD continues its impressive run and is defying investor expectations. While shorting the USD became a popular trade at the beginning of the year the unwinding of those positions have also helped the USD appreciate further. The Fed under Powell has kept on the same course set by previous Fed Chair Janet Yellen. The two inflation gauges to be released during the week: Producer Price Index (PPI) on Wednesday, May 9 at 8:30 am EDT and Consumer Price Index (CPI) on Thursday, May 10 at 8:30 am EDT are expected to keep inflationary pressures going and be a positive for USD bulls.
Pound Lower Ahead of BoE Rate Statement
The GBP/USD lost 1.67 percent in the last five days. The currency pair is trading at 1.3545 awaiting the BoE’s Super Thursday. The market was pricing in a rate hike in May after the March monetary policy meeting given that there were two dissenters in the final vote to keep rates unchanged. Economic indicators have soured since then and even Bank of England (BoE) Governor has tried to lessen expectations ahead of the the release of the rate statement, the quarterly inflation forecast, the rate vote count, so called Super Thursday for the amount of information hitting markets at the same time.
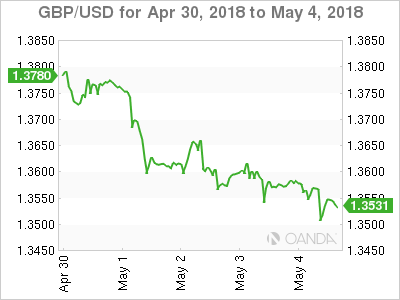
GDP data in late April was a heavy blow for rate hikes expectations with a paltry 0.1 percent gain, but hope was still alive given the role weather had to play in curtailing growth in the quarter. A leading indicator such as the Purchasing Manager Indices for construction, manufacturing and services almost took the rate hike off the table as only construction was able to beat the forecast.
The massive data releases out of the BoE will be preceded by the release of manufacturing production data and the Goods trade balance at 4:30 am EDT. The economic slowdown in the UK has reduced rate hike expectations as the central bank awaits more positive data before lifting borrowing costs.
Investors will be focusing on what previous dissenters do. If the two votes remain to hike rates with the possibility of more members joining them, or if the central bank shows a unanimous vote to keep rates unchanged.
Market events to watch this week:
Monday, May 7
- 9:30pm AUD Retail Sales m/m
- 11:00pm NZD Inflation Expectations q/q
Tuesday, May 8
- 3:15am USD Fed Chair Powell Speaks
- 5:30am AUD Annual Budget Release
Wednesday, May 9
- 8:30am USD PPI m/m
- 10:30am USD Crude Oil Inventories
- 5:00pm NZD Official Cash Rate
- 5:00pm NZD RBNZ Monetary Policy Statement
- 6:00pm NZD RBNZ Press Conference
- 9:10pm NZD RBNZ Gov Orr Speaks
Thursday, May 10
- 4:30am GBP Manufacturing Production m/m
- 7:00am GBP BOE Inflation Report
- 7:00am GBP MPC Official Bank Rate Votes
- 7:00am GBP Monetary Policy Summary
- 7:00am GBP Official Bank Rate
- 8:30am USD CPI m/m
Friday, May 11
- 8:30am CAD Employment Change
- 9:15am EUR ECB President Draghi Speaks
*All times EDT
Australia & New Zealand Weekly: RBA Firmly on Hold as Bank Funding Costs Rise
Week beginning 7 May 2018
- RBA firmly on hold as bank funding costs rise.
- Australia: Federal Budget 2018, retail sales, housing finance, NAB business survey.
- NZ: RBNZ OCR decision, inflation expectations, card spending, house sales & prices.
- China: credit growth, trade balance, FDI, CPI.
- Euro Area: Sentix investor confidence.
- US: Fed Chair Powell speaks, CPI.
- Central banks: BOE, BNM, BSP.
- Key economic & financial forecasts.
Information contained in this report current as at 4 May 2018.
RBA Firmly on Hold as Bank Funding Costs Rise
We have just received an update on the Reserve Bank's growth forecasts in the May Statement on Monetary Policy (SoMP).
The growth forecast has been held at 3¼% in 2018 and 3¼% in 2019. Given the various vacillations about this forecast over the last three months (higher than 2017; above trend) we are not imbued with a feeling that the Bank is particularly confident about this highly optimistic view. Recall that Westpac's view is that growth in 2018 will be 2.7% and in 2019 it will slow to 2.5%.
The other interesting forecast in the May SoMP is underlying inflation in 2018. In February, the forecast was 1.75%, below the 2-3% target band and following 1.6% in 2016 and 1.8% in 2017 - hardly a vote of confidence in the 2-3% target band. The May SoMP nudged this up to 2%.
The case for rate hikes has taken a further blow over the course of recent months.
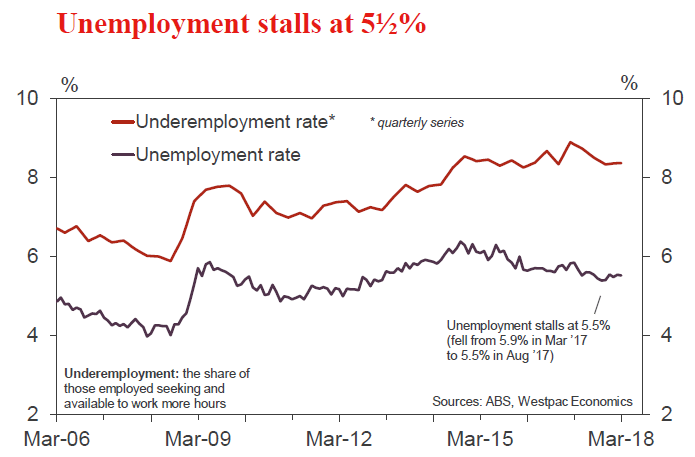
Firstly, the labour market is slowing down and the unemployment rate seems to be stuck near 5.5%. Employment growth in 2017 was 3.4%. Three month annualised employment growth in 2018 has slowed to 1.2%. The unemployment rate fell from 5.9% to 5.6% through to September last year, but has made no further progress. Reflecting the slowdown, the RBA raised its 2018 forecast for the unemployment rate from 5¼% to 5½%.
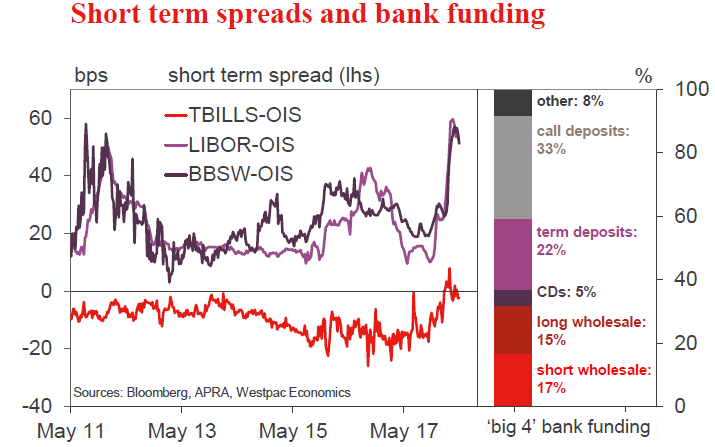
In April, the Governor referred to tightening financial conditions due to the rise in short-term USD interest rates. This represents a genuine tightening of financial conditions and the reasons for this tightening are important to understand, since there is little chance of these conditions easing significantly in the foreseeable future. Essentially there have been changes in both the supply and demand for short term USD paper.
On the supply side the US Treasury has been charged with funding a big uplift in borrowings as the US debt ceiling was lifted; tax cuts and spending increases filter through; and the US Federal Reserve continues to shrink its balance sheet by not reinvesting maturing securities. Treasury bills have traditionally traded at rates below the OIS (the imputed rate based on the expectation of Fed policy movements). This margin has generally been around 10-15bps.
Bank borrowing is generally priced relative to Treasury bills, so if these rise in rate so will bank borrowing rates (LIBOR).
There has also been a tax change in the US which means foreigners with USD assets who fund them in other currencies through a parent company (and then convert in the forwards market) no longer get a tax deduction. To qualify they must now borrow in USD. That means there has been a sharp increase in the supply of private sector issuance of USD borrowings in the US market, putting further upward pressure on short term US rates.
On the demand side we have seen a sharp reduction in the investment 'appetite' of major tech companies which had accumulated around USD$1.5tron in profits held offshore. These companies were ready investors in short term USD paper, putting downward pressure on LIBOR. With the US tax changes whereby companies can now bring these accumulated profits back onshore without paying the 32% tax rate, their appetite for bank paper has waned considerably.
Banks that issue short term paper into the USD market are now having to pay a higher yield to attract investors. The Australian banks have been large borrowers in that market given their strong needs for offshore funding. Markets are efficient, so a rise in the cost of USD borrowings also impacts the cost of AUD borrowings in the domestic market, i.e. AUD investors are also aware of banks' funding costs offshore and can extract a higher rate. For them, investing in USD paper and converting back to AUD paper is a comparable investment. This rise in USD funding costs is also affecting foreign subsidiaries who typically fund in USD and convert back to AUD.
These 'forces' (Treasury bills; tax changes in the US; tech companies moving their liquidity; domestic investors; foreign subsidiaries) have pushed the margin between the risk free rate and the banks' borrowing rate from 25bps to around 55bps.
This effect has impacted all banks' wholesale funding costs and the funding costs of businesses. Little wonder markets continue to push back on the timing of the RBA's much awaited rate hike.
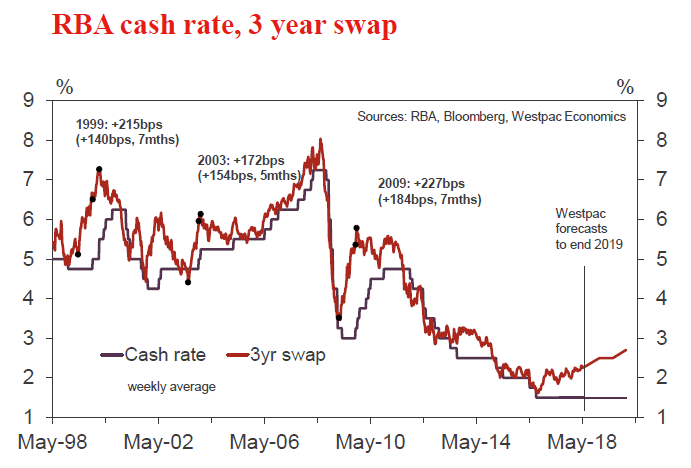
As has been the case since mid-2017 Westpac continues to expect the cash rate to be on hold in 2018 and 2019.
The week that was
The RBA has been front and centre this week, with the May meeting followed by a speech by Governor Lowe, then the release of the latest Statement on Monetary Policy (SoMP). Changes to the SoMP forecasts were subtle. Growth in 2018 and 2019 was held at 3.25%, while 2018 inflation was edged up to 2.00% (from 1.75%) following six months of 2% annualised core inflation. In contrast, the unemployment rate forecast for December 2018 was nudged up to 5.50% from 5.25%.
Broadly this implies that the RBA continue to expect growth to move above trend over the coming year and remain there. As a consequence, wages and inflation growth should accelerate - though on this point, Governor Lowe made clear in his speech that there has been very limited evidence of improvement to date. The edging higher of the unemployment rate forecast is simply a reflection of softer employment growth in February and March. They still believe the unemployment rate will move lower come 2019.
Westpac's view remains more circumspect. We see growth holding a little below trend on average through 2018 and 2019 and, as a result, anticipate little progress on wages and inflation growth. Combined with the broad-based softening of the housing market, there is little to no justification for a rate hike in 2018 or 2019. In terms of the risks: to the upside the labour market will be key; to the downside the effect of macro-prudential regulation on credit growth and housing is crucial.
Now as we end this week, for Australia, all eyes shift to next Tuesday's Federal Budget. Often key initiatives are floated ahead of the event, but in this instance little information is available. We know that strength in commodity prices and employment growth have delivered a much-improved starting point for the Budget projections. For the most part, it seems that this windfall will be spent on personal tax cuts and the cancellation of the planned increase in the Medicare levy surcharge (previously announced to fund the NDIS). Additional spending on infrastructure; health; aged care; education and the environment is also expected.
Westpac will provide a comprehensive review of the Budget next Tuesday night and the morning after.
Turning to the US, the FOMC also met this week. No change was expected. Instead the focus was on the language used, with participants wanting to know if an expected hike at the June meeting would be followed by another one (or two) moves before year end. On the whole, the Committee held to a positive view of the outlook, although the weakness in consumption in Q1 was given greater credence. We (and arguably the FOMC) are relying more on government spending and investment to drive growth than the consumer. Hence the Committee will only become concerned if the consumer weakness of Q1 becomes entrenched.
On inflation, there was an important change, with the symmetric nature of the 2.0% medium-term target being emphasised. After such a long period of underperformance, there is a willingness amongst policy makers to run the economy 'a little hot'. More broadly, it is fair to say that risks to the inflation outlook are the same as those for the overall economy - balanced. For us, this statement suggests that the FOMC will take their time with rate increases, with two more to come in 2018 and another two in the first half of 2019. This is the point where our and the FOMC's views diverge however: we foresee financial conditions cutting off growth; they expect momentum to hold up. Higher productivity and consequent wage gains are needed if the FOMC's 3.00%+ terminal rate is to be achieved.
For Asia, China's official PMI's and the Markit measures have all been released this week. In China, momentum remains robust, though external demand looks to be easing at the margin. Efficiency and profitability also remain a key focus amongst manufacturing and service firms, with employment continuing to lag activity. In the rest of Asia, developed nations look to have been harder hit by softer conditions in Europe and, to a lesser extent, the US. Japan is an exception, with further strength reported in April. Across developing Asia, the outcomes were more robust. For most, domestic demand is in good shape.
For those that would like to delve deeper into the world of economics, our latest Market Outlook publication will be released today. Covering off on key developments across the global economy and financial markets, it provides valuable insights into current circumstance and the outlook. It also includes our latest growth; foreign exchange and interest rate forecasts.
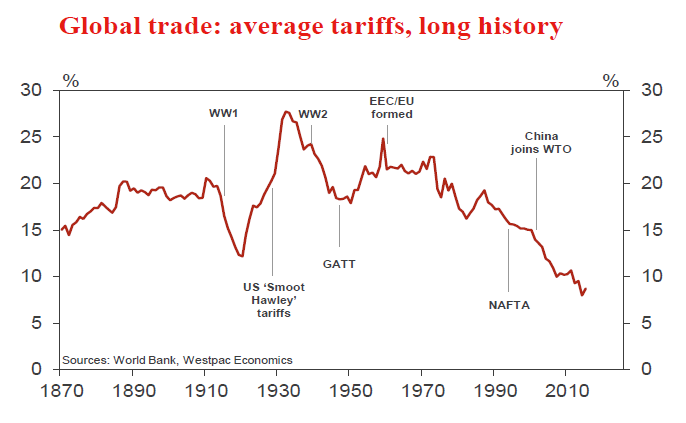
Chart of the week: Trade tariff history
Average trade tariffs have been on a declining trend since the 1970s. While we have seen a lift from time to time - most notably the 1980s - the direction has been overwhelmingly down.
As we go to press, delegates from the Trump administration are in China for negotiations following the recent inflammation in trade relations. Our monthly Market Outlook includes a review of the trade saga as it stands and assesses how it relates to Australia's exports.
New Zealand: week ahead & data wrap
This week Stats NZ delivered its battery of labour market data relating to the March quarter. It arguably deepened a key mystery - why is wage growth so low when employment is strong?
The unemployment rate fell to a fresh nine-year low of 4.4%. That was on the back of ongoing employment gains, although the pace of employment growth has slowed over the past year. Despite falling unemployment, wage growth remained muted. The Labour Cost Index (LCI) showed just a 0.3% rise for the quarter. The annual rate was 1.9%, but excluding the impact of last year's pay settlement for aged care workers, the annual increase would have been 1.6% - effectively the same rate of increase that we have seen for the last several years.
In contrast to the subdued wage growth story in the LCI, the QES measure of average hourly earnings has picked up strongly in the latest quarter, and over the last year. However, we would put less weight on this series. It has always been more volatile than the LCI (and was affected more by the aged-care workers' settlement), and the recent growth is arguably a correction from a very weak patch a year earlier.
The labour market surveys came ahead of next week's Monetary Policy Statement (MPS), which will be the first under the Reserve Bank's new mandate to contribute to maintaining maximum sustainable employment and avoid unnecessary volatility in employment. The RBNZ may consider unemployment of 4.4% evidence that employment is currently at, or even beyond, the maximum sustainable level. This is based their assertion that the non-inflationary rate of unemployment is 4.7%, and their forecast that the long-run average rate of unemployment will be 5%.
But there is a great deal of uncertainty about where employment stands relative to the maximum sustainable level. The lack of a pickup in wage growth suggests that employment is still short of the sustainable maximum. The labour underutilisation rate of 11.9% argues in the same direction. Other evidence points in the direction of employment being at or beyond the maximum sustainable level - surveys show that firms' difficulty finding labour is at a cyclical extreme, and the employment to GDP ratio is extremely high.
These issues will be hotly debated at the RBNZ, and will be discussed in detail in the MPS. However, we do not think that the move to considering the labour market will prompt a change in the OCR outlook. The RBNZ may well conclude that the labour market does not need assistance in the same way as inflation needs a boost. In that sense, moving to a dual mandate weakens the case for keeping the OCR low. However, there have long been considerations outside of inflation that have made the RBNZ wary of lowering the OCR too far. Most notably, the RBNZ didn't want to risk inflaming the housing market. Shifting the focus to the labour market probably won't increase or decrease the RBNZ's caution about keeping the OCR low.
In terms of the inflation outlook, recent developments have probably been to the positive side. The exchange rate has dropped sharply below the RBNZ's forecast, the housing market has been stronger than the RBNZ expected, and export commodity prices have risen instead of falling as the RBNZ anticipated. That is more than enough to offset the fact that GDP growth has probably been weaker than the RBNZ expected in the six months to March.
However, the recent rise in bank bills (the interest rates at which banks lend to one another) relative to the OCR is a spanner in the works. The risk is that this will spark off a round of independent mortgage rate increases. The RBNZ will probably want to see how this issue pans out before actually changing the OCR outlook.
Bringing all of this together, the RBNZ is likely to leave the OCR unchanged relative to the February MPS, meaning it will continue forecasting no change in the OCR until mid- to late-2019. If there is a change in OCR outlook it will be small, and in the direction of earlier hikes.
More uncertain is how the RBNZ chooses to communicate the OCR outlook. For over a year now it has repeated the same bottom-line: "Monetary Policy will remain accommodative for a considerable period. Numerous uncertainties remain and policy may need to adjust accordingly." The new Governor might want to stick with that phrase to emphasise continuity for markets. Or he may want to emphasise the change in regime by changing the wording. We have no way of telling which it will be, but what we can say is that a change in phraseology from the RBNZ will not necessarily be a signal to markets.
The final interesting feature of this week's labour market data was that after years of strong growth, employment in the construction sector has flattened out. This matches a general decline in business confidence in the construction sector observed over the past year and reaffirmed in this week's ANZ business confidence survey. This week's building consents data rose strongly, but the strength was restricted to the volatile Auckland apartment building sector. The general trend in consents over the past seven months has been sideways.
It is hard to tell what has caused this general flattening off in residential construction activity. It may represent a reduction in demand for building, but that would be surprising given the housing shortages that are manifest in Auckland and one or two other parts of the country. The other possibility is that construction is beset with some form of inability to grow, rather than an unwillingness. Labour shortages are probably not the constraint - we have noticed that job ads in construction have also come off. More likely, construction firms and developers are finding it difficult to access finance, and are having difficulty turning a profit with costs rising as they are. This is an issue we will look more deeply into, given that our long-run forecast is for ongoing gradual growth in construction activity.
Data Previews
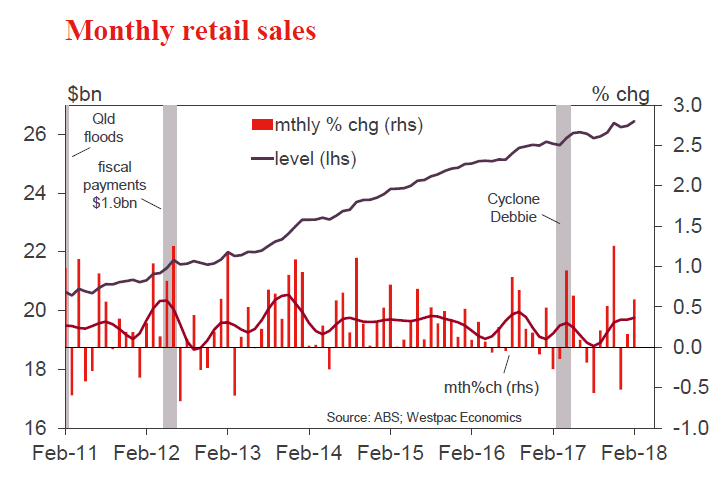
Aus Mar retail trade
May 8, Last: 0.6%, WBC f/c: 0.2%
Mkt f/c: 0.2%, Range: -0.1% to 0.6%
- Retail sales improved in Jan and Feb (+0.2% and +0.6% respectively) after a 0.5% fall in Dec that had followed a patchy second half to 2017. The detail was also mostly positive with the Feb gain led by solid rises in 'discretionary' store types. Notably, online sales continue to see strong growth, albeit from a low starting point.
- Indicators are more mixed for March. Consumer sentiment softened after a sharemarket sell-off and increased concerns about the outlook for the economy and jobs. Retail responses to private sector business surveys also point to a softening in sales although these have provided conflicting guidance in recent months. On balance we expect March to show renewed headwinds with a sub-par 0.2% gain
Aus Q1 real retail sales
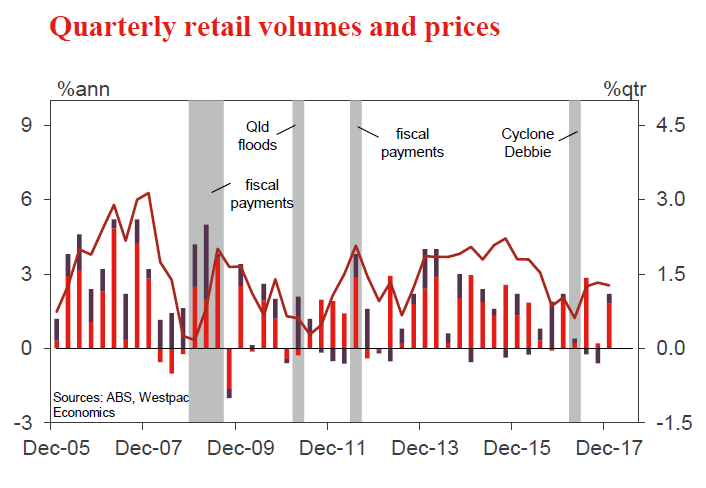
May 8, Last: 0.9%, WBC f/c: 0.8%
Mkt f/c: 0.5%, Range: -0.5% to 1.3%
- After stalling in Q3, retail volumes rebounded 0.9% in Q4, rounding off a stop start year for retail. Volume gains have also been alongside aggressive price discounting - non food retail prices down 0.9%qtr, and 2%yr, 2017 marking the biggest annual price decline since the early 2000s when a rising AUD was generating significant falls in imported goods prices.
- The Q1 update should show a further rise but at a slower pace. Nominal sales are on track to be up about 0.7% for the quarter vs 1.1% in Q4. Retail prices have again moved lower, the Q1 CPI detail pointing to a decline of around 0.2% (although this understated price weakness in Q4). Overall the mix points to a 0.8% rise in real retail sales.
Aus 2018 Federal Budget, AUDbn
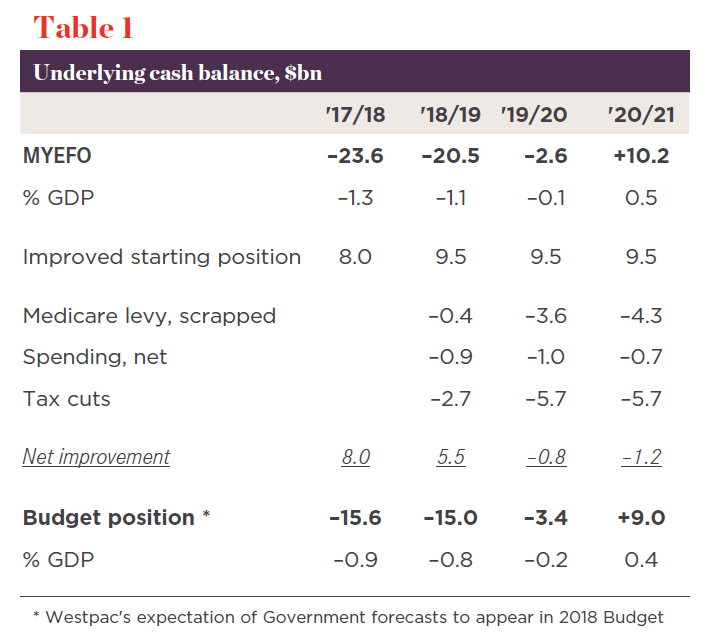
May 8, Last: -15.6(e), WBC f/c: -15.0
Mkt f/c: -15.0, Range: -23.0 to -7.5
- Federal Budget 2018 will reveal an improved budget position relative to the December MYEFO largely reflecting upside on jobs growth and commodity prices in 2017/18.
- For 2017/18, the deficit is expected to improve by $8bn relative to MYEFO, upgraded to $15.6bn from $23.6bn.
- For 2018/19, after factoring in the potential impact of new spending and personal income tax cuts, the deficit is some $5.5bn lower than in MYEFO, at $15.0bn (0.8% of GDP).
- As to the timing of the return to surplus, this is likely to remain in 2020/21, to the tune of $9.0bn, broadly in line with the MYEFO forecast of $10.2bn.
- Net debt levels remain manageable at an expected $351bn (18.4% of GDP) at June 2019.
- For more detail, see our preview bulletin.
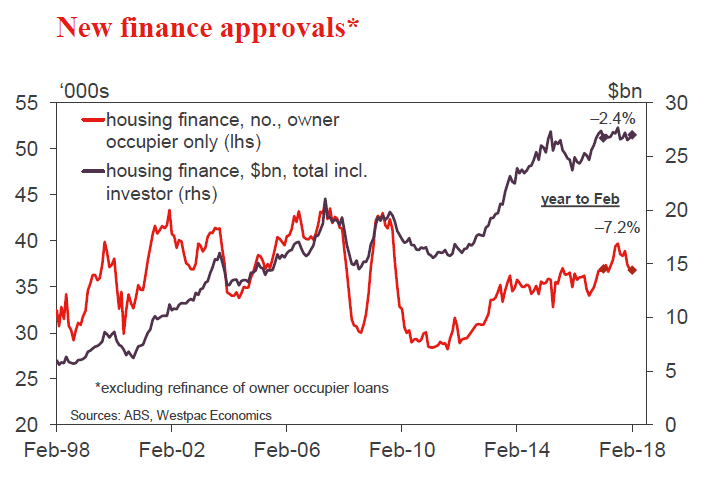
Aus Mar housing finance (no.)
May 11, Last: 0.2%, WBC f/c: -3.0%
Mkt f/c: -1.5%, Range: -3.0% to 2.5%
- Australian housing finance approvals were essentially steady in Feb, the number of owner occupier approvals dipping 0.2% and the value of investor finance up 0.5%.
- Industry figures point to a sharp fall in owner occupier approvals in March - we expect the official figures to show a 3% drop. Housing markets remained soft through the month with auction clearance rates around long run average levels in Sydney and Melbourne and prices continuing to slip lower. Buyer sentiment has steadied having lifted off its 2017 lows but remains downbeat by historical standards. Some tightening in lending criteria may also be impacting new finance activity.
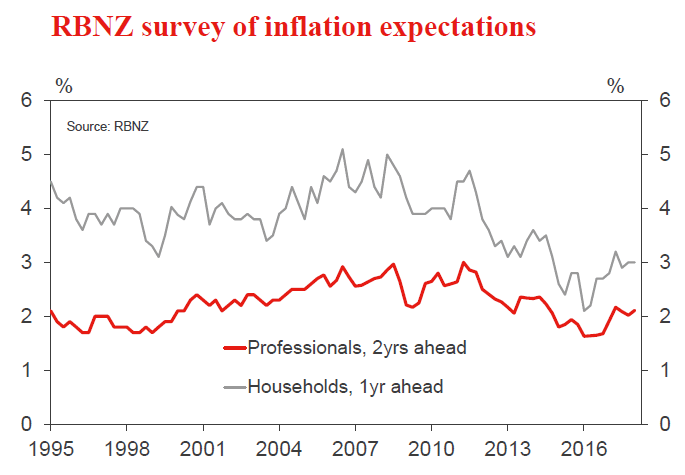
NZ Q2 RBNZ survey of inflation expectations
May 8, Two years ahead, last: 2.11%
- The latest RBNZ expectations survey was held soon after the March quarter inflation result, which saw annual inflation dropping from 1.6% to 1.1%. However, it's not clear that expectations will follow the CPI downwards. Some of the March quarter softening in inflation was due to special factors, such as the partial removal of tertiary study fees. In addition, there have been some well publicised price increases (e.g. petrol), as well as growing concern about Government policy and wage costs.
- Inflation expectations in this and other surveys have lifted from the lows we saw in 2016/17 and have now flattened off at levels around the RBNZ's 2% target mid-point.
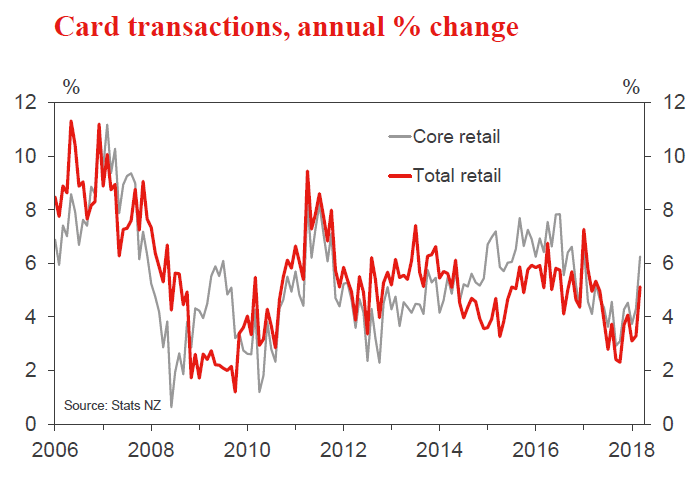
NZ Apr retail card spending
May 9 Last 1.0%, WBC f/c: -0.1%
- Retail card spending was stronger than expected in March, rising by 1% over the month. In part, that strong result was a rebound from earlier weather related weakness. Spending also appears to have received a boost from Easter holiday leisure activities and the recent firming in the housing market (which tends to affect spending on durable items).
- With weather and holiday related volatility dissipating, we expect to see a modest 0.1% easing in retail spending in April. However, given the solid gains earlier in the year and low level of retail price inflation, we wouldn't describe that as weak. Spending continues to be supported by strong population growth, low interest rates, and the recent firming in the housing market.
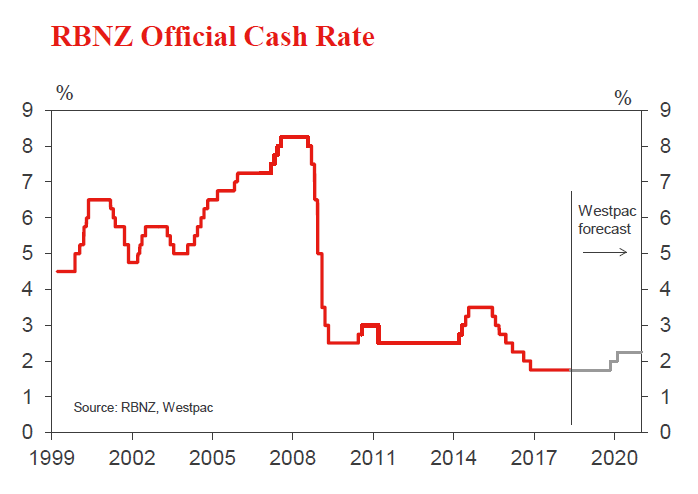
RBNZ OCR and Monetary Policy Statement
May 10 Last 1.75% WBC f/c: 1.75%, Mkt f/c: 1.75%
- This will be the Reserve Bank's first policy announcement under its new Policy Targets Agreement and under Governor Adrian Orr. We don't expect a change in the OCR outlook. But if there is a change, it will be in the direction of slightly earlier hikes than previously signalled. Recent economic developments have been, on balance, slightly positive for inflation.
- The wording of the MPS and the press release will be different from previous announcements, but markets shouldn't necessarily take that as a signal - it might just reflect the new Governor's communication style.
- The RBNZ's new labour market directives probably won't cause a change in the OCR outlook this time. However, the labour market target might matter at other points in time.
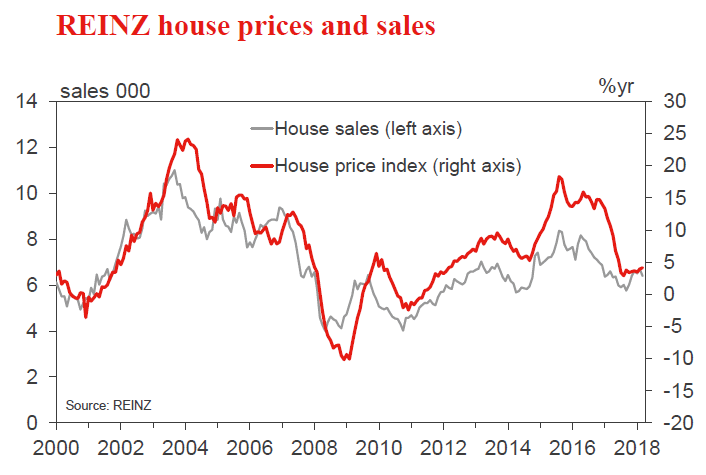
NZ Apr REINZ house sales and prices
May 11 (tbc), Sales last: -4.5%, Prices last: 4.2%yr
- New Zealand house prices have been more buoyant in recent months, although Auckland and Canterbury have remained relatively subdued. Market turnover has also picked up, albeit less emphatically. A drop in mortgage rates and a slight easing of loan-to-value restrictions have given some support to the market.
- We expect the housing market to lose momentum again over the rest of this year, as the new Government introduces a range of policies aimed at cooling housing speculation. The first step came at the end of March, when the bright- line test for taxing capital gains on investment properties was extended from two to five years.
- There is no set date for the release of the April house sales figures; we expect them to be released towards the end of the week, but they could be pushed into the following week.
UK Bank of England Bank Rate decision
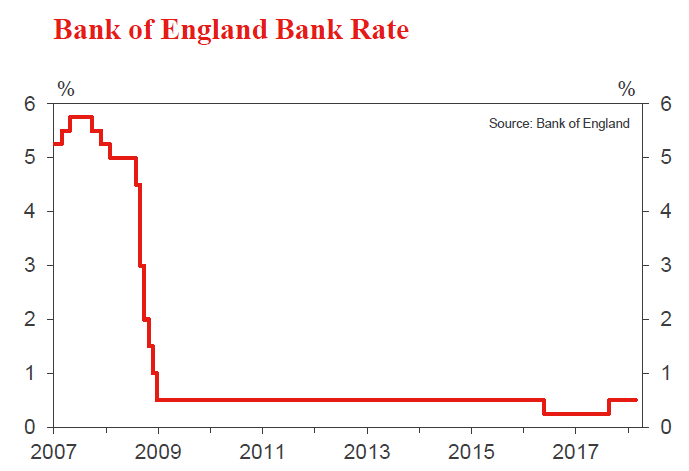
May 10, Last: 0.5%, Mkt: 0.5%, WBC f/c: 0.5%
- We expect the BOE will keep the Bank Rate on hold at 0.5% at its May meeting, and that they will maintain their gradual tightening bias. The pace of activity has been easing off, including a step down in GDP growth to a lower than expected 1.2% in March (vs. 1.4% in December). Although some of this is due to earlier inclement weather, lingering uncertainty around the economic outlook and headwinds in the household sector are also a drag. Inflation remains above 2%, but has been easing back, and some further softening is expected over the coming months.
- Reinforcing expectations for an on hold decision in May are recent comments from BOE Governor Carney. While he did note that rates are likely to rise over the coming years, he highlighted the continued uncertainty associated with Brexit and mixed tone of recent economic activity.
US Apr CPI
May 10, last -0.1%, WBC 0.3%
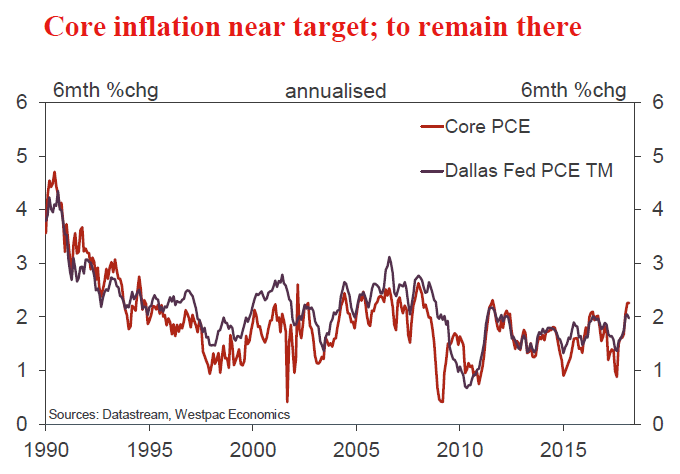
- US consumer inflation is in the process of accelerating, as base effects from March-May 2017 drop out. These weak outcomes of 2017 were due to a number of 'one-off' or 'transitory' shocks related to the pricing of mobile phone plans and physician services. These factors were responsible for the lift in annual core inflation from 1.9% in February to 2.1% in March, and further gains are expected.
- From March to April, no change is expected in the growth rate, with another 0.2% increase forecast. This is the pace that inflation has averaged since August 2017.
- Headline inflation will however be whipped around on a month to month basis, with March's -0.1% result followed by a 0.3% gain as energy prices jump.
- It remains our expectation that inflation will settle near 2.0% on a core basis in the second half of 2018.
US-China Trade Talks Set to Continue for Some Time
Two days of US-China trade talks are over. There was no big trade deal but an agreement to keep on talking instead.
Trade talks are likely to go on for a long time it seems. Some big issues are outstanding according the media reports. The interesting thing now will be whether Trump holds off from announcing details on tariffs on the additional USD100bn worth of Chinese imports or not. It will probably take some weeks before we know. He might do it to put more pressure on China, but might also hold fire as long as talks continue. He stated yesterday he might meet with Chinese President Xi Jinping soon.
Apparently, the US has asked China to reduce the trade deficit by USD200bn by end- 2020. It is very unlikely that China will agree to this, as it sees the US trade deficit with China as being due in part to low US savings, over which it has no control. According to sources, the other US requests going into the negotiations were (1) a halt to some subsidies for Made-in-China 2025, (2) to strengthen IP protection and enforcement and (3) to reserve the right to impose additional tariffs while asking China to avoid retaliatory action.
On halting subsidies in Made-in-China 2025, China will be reluctant, as this is a cornerstone in moving towards the next step in its development by improving productivity through investment in technology and innovation. China sees a case for subsidising sectors that have positive spill-over effects on the whole economy - which makes sense according to economic text books when so-called 'positive externalities' are in place. However, it is a point that both the US and Europe view as a threat. China sees the US demands partly as an attempt to hold China back, which will not be allowed.
On the second point of strengthening property protection, China is likely to meet the US. China has in fact worked on this for several years now and has taken steps to improve enforcement and increase fines for stealing property rights. With innovation being a corner stone in China now, protecting property rights are crucial for Chinese companies as well.
Uncertainty to linger for some time
On Wednesday, a Xinhua report (Chinese news agency) stated that the US should show sincerity in trade talks instead of making unreasonable demands. It might have been a response to the US wish list going into the negotiations. However, on Friday, a Xinhua article struck a positive tone while also stating that 'considerable differences still exist'.
It seems clear that the uncertainty over a potential trade war will linger for some time. Key to watch now is whether the US will actually implements tariffs on China after the hearing period is over and whether it will proceed with details on the further USD100bn worth of Chinese imports subject to tariffs. If it does so, it would lead to another escalation, as China would retaliate immediately. There are stories that China has already started to divert purchases of soy beans away from the US to other countries, which, if true, will hurt farmers in some of the important political states for Trump. We continue to look for a solution in the long term, but it is likely be a rocky road along the way and it cannot be ruled out that it could get worse before it gets better.
Week Ahead – Will BoE Raise Rates? RBNZ Meets Too; US Inflation in Focus
The Bank of England’s monetary policy meeting looks set to be the main highlight of the coming week amid a sudden reversal of rate hike expectations. The Reserve Bank of New Zealand will also be holding a policy meeting. Eurozone data will be sparse but US inflation indicators, Chinese trade figures, Australian retail sales and Canadian employment numbers should keep traders busy.
RBNZ to stand pat
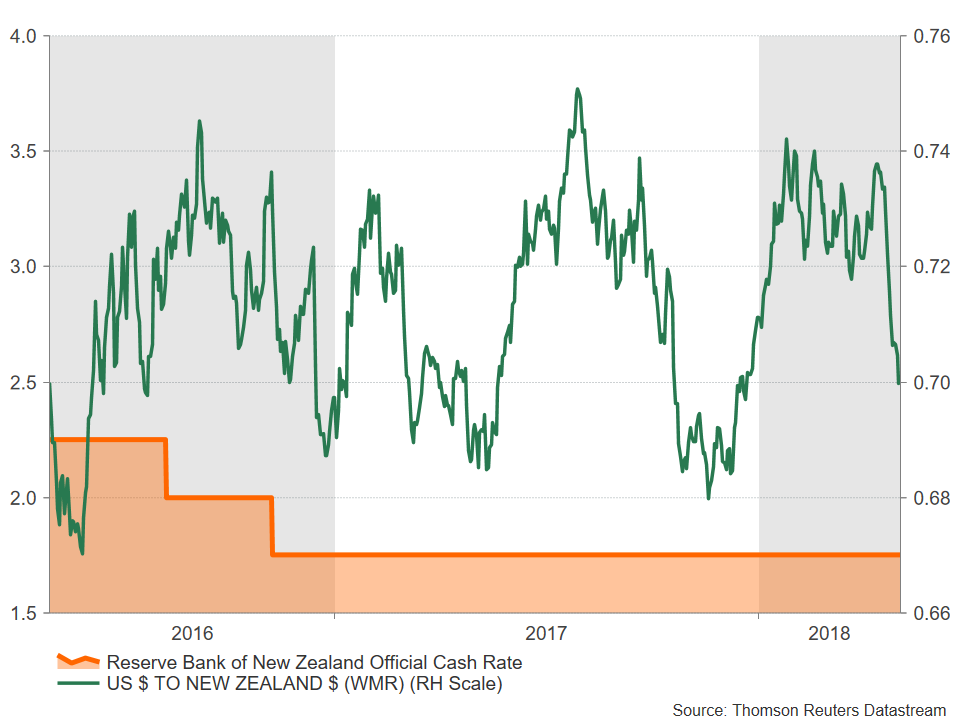
The new governor of the RBNZ, Adrian Orr, will hold his first monetary policy meeting on Thursday under the Bank’s new mandate, which now includes employment in addition to inflation targeting. While the policy statement and subsequent press conference may attract more attention than usual, Orr has already signalled that the revised mandate will not lead to a significant change in monetary policy. The RBNZ is widely expected to keep its overnight cash rate unchanged at 1.75% and will likely maintain a neutral stance.
However, with inflation currently running just above the lower band of the Bank’s 1-3% target range, the RBNZ could lower its forecasts in its latest quarterly outlook report. The New Zealand dollar, which slumped to four-month lows versus the US dollar this week, could extend its losses on any sign of a delay to how soon the Bank expects to raise rates.
The Australian dollar also fell to multi-month lows this week before rebounding on better-than-expected trade data. Retail sales figures due on Tuesday could help the aussie extend its gains if there are more positive surprises. Also to watch out of Australia next week are business and consumer confidence gauges by the NAB and Westpac on Monday and Wednesday respectively, as well as housing finance numbers on Friday.
Canadian jobs report eyed
The Canadian dollar has been forming a ceiling at C$1.29 to the greenback over the past week or so, resisting any further advances by its US counterpart. Better-than-expected monthly GDP growth was one of the factors providing the loonie with support. If Friday’s employment report shows another solid set of numbers, the loonie could find fresh impetus to strengthen to below the C$1.28 level. It would also reignite expectations that the Bank of Canada could raise rates at its May or July meetings, especially after Governor Stephen Poloz appeared to be striking a more hawkish tone in recent remarks.
Trade and inflation in focus in China
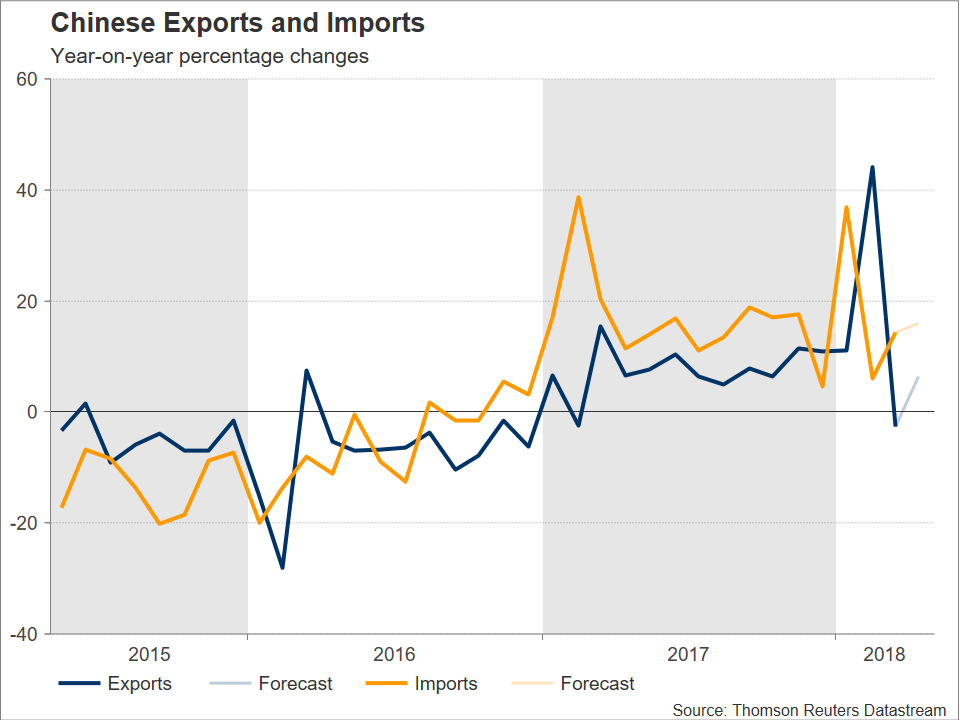
China will release trade and inflation figures next week, with the April trade data first up on Tuesday. Exports from China posted their first annual decline in 13 months in March. With Sino-US trade tensions still simmering, investors will be hoping for a strong rebound in April – analysts project a rise of 6.3% y/y – to ease concerns that the uncertainty about the trade outlook has already started to impact exports by the world’s second largest economy. On Thursday, CPI and PPI data will be watched as further easing in inflationary pressures in April could raise some doubt about the strength of domestic demand in China.
Bank of Japan to publish minutes and summary
The minutes of the BoJ’s March policy meeting are due to be published on Monday. However, these are likely to be overshadowed by the summary of opinions of the Bank’s more recent meeting in April. The summary of opinions out on Thursday will be scrutinized by analysts to learn the views of the BoJ’s two new deputy governors, particularly that of Masazumi Wakatabe, who is known to be a dove. Wakatabe disappointed some by not dissenting at the April meeting in calling for further loosening of monetary policy. However, should the summary reveal some more dovish voices, the yen could come under pressure on the expectation that further easing in the future is more likely under the new board composition if the BoJ continues to miss its 2% inflation target. In terms of data, household spending on Tuesday will be the main release out of Japan.
BoE: Will they or won’t they?
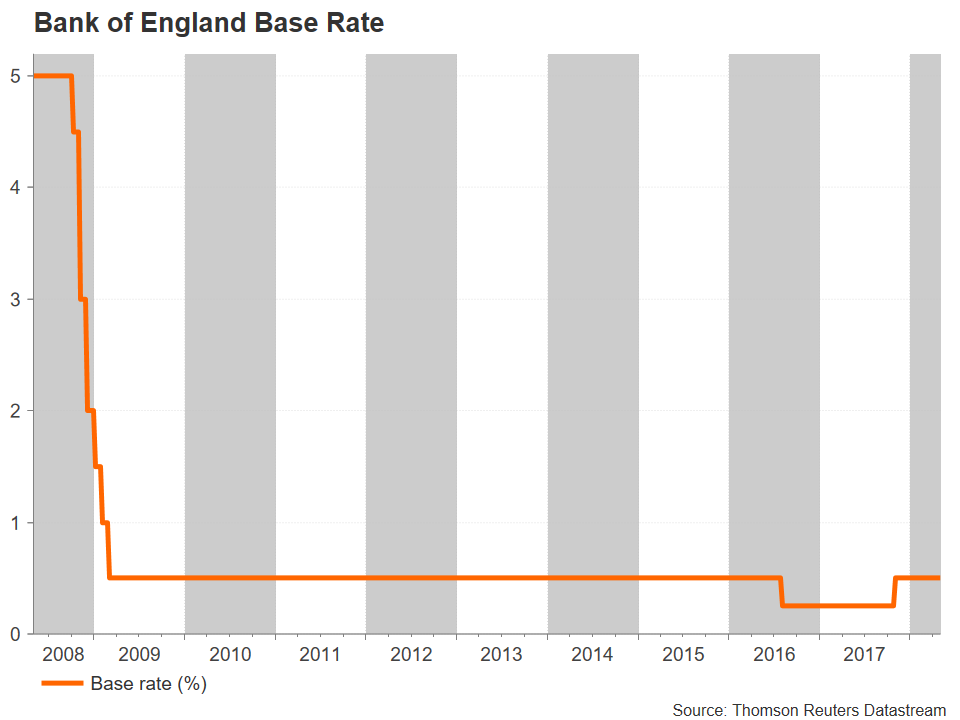
Monetary Policy Committee (MPC) members of the Bank of England will have a tricky task at their two-day meeting on May 9-10 as they try to balance the downside risks presently facing the economy with projections that inflation will struggle to fall to the 2% target in two years’ time. Having deliberately raised market expectations that a May rate hike was forthcoming, MPC members will now have to decide whether to keep to their word or postpone the move to until later in the year, as hinted recently by the Governor, Mark Carney.
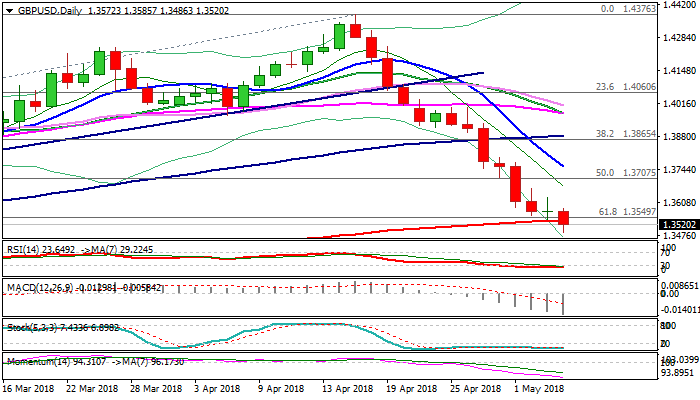
The pound has retreated by 6% from its 22-month high of $1.4376 set in April as a series of weak economic data and a faster-than-projected fall in inflation have cast doubt about the need to raise interest rates so soon. Market expectations of a May rate hike have receded dramatically, from more than 90% a month ago to below 10% currently. However, the possibility of a 25-basis point increase in the Bank rate next Thursday shouldn’t be totally dismissed as the BoE could raise in May, arguing that it is looking ahead to future inflation expectations, and pause after that. Some analysts agree with this view, with sterling anticipated to reverse sharply higher in the event the BoE delivers a shock hike.
The final possible clue to the Bank’s decision will arrive just hours before the announcement with the release of trade, industrial and manufacturing output figures for March. Positive month-on-month growth is forecast for both industrial and manufacturing production in March.
Germany and France will also publish industrial output data next week, on Tuesday and Wednesday respectively. But otherwise, the euro area calendar will be unusually light, with the Sentix index due on Monday being the only major Eurozone release.
After Fed, US inflation back in spotlight
The Federal Reserve may have eased concerns of a faster pace of rate increases at this week’s FOMC meeting but US inflation data due in the coming days could keep expectations of a fourth rate hike during 2018 alive. Producer price figures out on Wednesday will likely show factory prices easing somewhat in April. However, the consumer price index is forecast to edge up further on Thursday. The annual rate of CPI is expected to rise from 2.4% to 2.5% in April, which would be the highest since February 2017. A stronger-than-expected reading could help the dollar re-challenge the 110-yen barrier after flirting with the level this week.
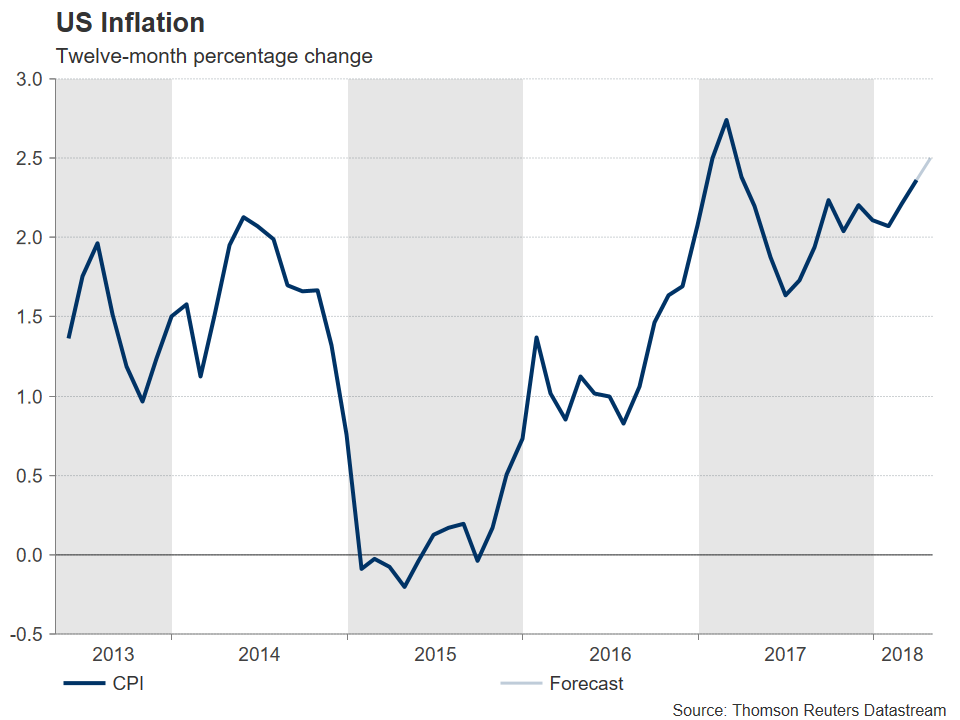
In other data, April import and export prices should be watched on Friday, along with the University of Michigan’s consumer sentiment index. The preliminary reading of the consumer sentiment index for May is forecast to rise to 99.5 from 98.8 in April.
GBPUSD Breaks Below 200SMA on Fresh Bearish Acceleration Post US Data
Cable spiraled through 200SMA and cracked psychological 1.35 support after dollar was briefly lower on overall disappointing US data, but quickly regained traction and extended its strong three-week rally. Weaker that expected rise in new jobs in April (164K vs 189K in March) and especially miss in average hourly earnings which rose by 0.1% in April, missing 0.2% forecast, were negative signals. But US unemployment surprised positively on dip to the lowest in18 years at 3.9%, beating 4% forecast. Despite the data may look bad at the first sight, overall figure is still satisfactory and may keep Fed on track for rate hike in June, despite the central bank was not hawkish enough as market participants expected after its policy decision earlier this week. All these keep dollar bulls steady and signal fresh extension of an uninterrupted rally since mid-April. On the other side, sterling came under increased pressure after recent disappointing data from UK which sidelined hopes for rate hike in May (expectations dropped to 18% from 58% last week) which adds to cable's strong bearish sentiment. Bears look for fresh negative signal on close below 200SMA today, with firm break below 1.35 handle to open way for test of pivotal support at 1.3442 (Fibo 38.2% of 1.1930/1.4376 recovery) and fresh bearish extension which could travel to 1.3354 (Fibo 76.4% of 1.3038/1.4376 ascend). Strong bearish momentum maintains pressure while bears continue to ignore oversold conditions which suggest some corrective action in the near-term. The pair is also on track for the third straight strong bearish weekly close, the sequence not seen since post-Brexit vote bearish acceleration, which adds to strong bearish environment. Selling upticks is seen as favored scenario with solid barriers at 1.3711 (former low of 01 Mar) and 1.3756 (falling 10SMA) expected to cap.
Res: 1.3534; 1.3585; 1.3605; 1.3629
Sup: 1.3486; 1.3442; 1.3400; 1.3354