Sample Category Title
Weekly Focus: And Now Back to Economic Indicators
Market Movers ahead
- This week Weekly Focus covers the coming two weeks due to the Danish bank holiday next week.
- In the US, we estimate core CPI for April increased from 2.1 to 2.2% y/y.
- The BoE will meet next week. In lieu of dovish comments and disappointing economic indicators, we think the hike will be postponed to the August meeting.
- On Wednesday 16 May, we will get the final euro area April HICP figures. Core inflation surprised on the downside in April, falling back to 0.7%. We will be looking at the details to determine how much of the decrease was driven by one-offs.
- In Scandies, we have a number of inflation releases coming up. Notably in Sweden, we expect yet another undershooting of the Riksbank's forecast, although we have raised our forecast for H2 on the back of the recent SEK weakening. In addition, we expect Swedish house prices to show weakness after a few months of stabilisation.
- In Denmark, we expect inflation to have come down even further in April.
Global macro and market themes
- The trade war is still being slowly fought but the coming weeks will be important.
- More signs that growth has peaked but we are not heading for a downturn, in our view.
- The Fed is on autopilot and EUR/USD has moved below the 1.20 mark.
Sunset Market Commentary
Markets:
Global core bonds traded listless going into the US payrolls report, ignoring some softer than expected, but second tier, EMU eco data. The US Note future slightly outperformed. US payrolls were a mixed bag, but we retain softer than expected earnings. Core bonds spiked higher, but didn’t really gain traction despite this week’s solid performance on the back of a cautious Fed and disappointing ISM’s. Today’s initial market reaction suggests that the upward rate momentum isn’t completely broken yet. We now look forward to comments from Fed-governors to determine the short term direction of core bonds. German yields increase by 0.3 bps (2-yr) to 1.2 bps (5-yr) at the time of writing. Changes on the US yield curve vary between -1.5 bps (5-yr) and +0.3 bps (2-yr). 10-yr yield spread changes versus Germany are close to unchanged with Greece underperforming (+9 bps).
Today, the US payrolls were also the key driver for USD trading. EUR/USD held a sideways range in the upper half of 1.19 big figure in the run-up to the payrolls release. USD/JPY hovered in the 109 area. The payrolls were a mixed bag, at best. The decline in the unemployment rate to 3.9% was an eye-catcher, but payrolls’ growth and earnings/wages were mediocre and below market expectations. The dollar lost temporary a few ticks against the euro and the yen upon the publication of the payrolls. However, the US currency showed remarkable resilience given the slightly disappointing outcome of the report. USD/JPY soon returned to the 109 area. EUR/USD even set new short-term correction lows. The rejected topside attempt after to payrolls apparently pushed more stale EUR/USD longs out of their position. US equities also declined upon the release. The subsequent decline in EUR/JPY probably also added to the downside momentum in EUR/USD. The pair currently tests the 1.1915/35 support area. Today’s price action confirms that recent improvement in USD sentiment. However, some underlying euro weakness is probably also still at work.
Today there were no new market themes to guide EUR/GBP trading. The stalemate/division within the UK Conservative Party on the Brexit strategy persists. Over the previous weeks/days markets have also given up expectations for a May BoE rate hike after a series of soft UK eco data, indicating that the soft patch in the UK economy might continue into the second quarter. There were no important eco data in the UK today. Sterling held near recent lows against the euro and the dollar. EUR/GBP currently hovers in the 0.8825/30 area. Cable returned to the 1.35 area, but part of this move was due to further USD gains this afternoon.
News Headlines:
US payrolls printed mixed. The US economy added 164k jobs in April, below 193k consensus. However, March payrolls were upwardly revised by 30k, balancing the below-consensus headline print. The unemployment rate unexpectedly declined from 4.1% to 3.9% in April, a new cycle low, but the participation rate dropped in lockstep from 62.9% to 62.8% (vs 63% expected). Wages were the biggest drag on the labour market report. They rose by a meagre 0.1% M/M and 2.6% Y/Y, below forecasts, and the March numbers faced a downward revision.
The US handed China a lengthy list of demands on trade as part of this week’s talks, from cutting the trade imbalance by $200 bn to halting Chinese government support for advanced technologies—requests Beijing called “unfair.” (WSJ).
EMU eco data disappointed today. The final April services PMI faced an unexpected downward revision from 55 to 54.7. March retail sales rose by 0.1% M/M and 0.8% Y/Y (vs 0.5% M/M & 1.9% Y/Y consensus). The data are the latest to show weakness in Q1 2018 when bad weather and higher than usual rates of illness encouraged customers to stay at home.
Jobs and Wages Support Consumer, Fed Move in June
April job gains came in at 164,000—below the three month average but enough to maintain momentum in a tight labor market as wages rise and the unemployment rate fell to 3.9 percent. Fed to raise rates in June.
Job Gains Broad-Based with April Jobs at 164,000
Nonfarm payrolls rose 164,000 in April with the three-month average at a solid 208,000 jobs. The broad-based character of the labor market is evidenced by the rise in the diffusion index to 64.0, continuing an uptrend since early 2016. Current job gains are consistent with 2.5-3.0 percent economic growth in the current quarter and an FOMC June rate hike.
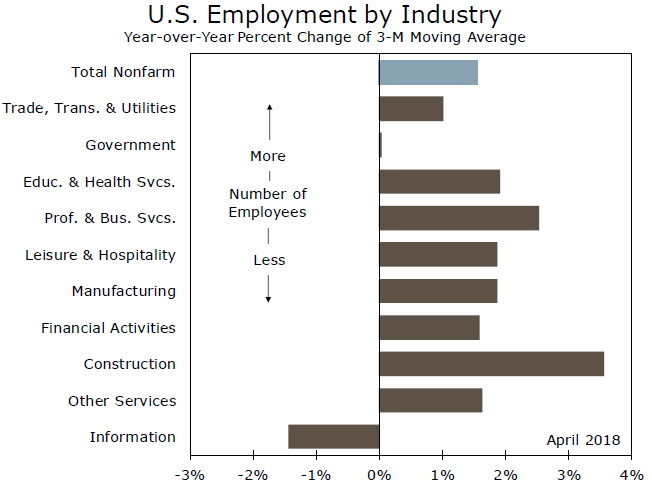
Jobs gains appeared broad-based, with most sectors experiencing gains over the month (top graph). Manufacturing jobs continue to show upward momentum—up 24,000 in March and up an average of 26,000 over the past three months. Construction jobs also showed a gain of 17,000 and are up 25,000 on average over the past three months. Over the past three months, aggregate hours worked are up 2.6 percent, annualized, which is very solid and consistent with continued growth in personal income and consumption.
Diversity in Wage Growth -A Different Look
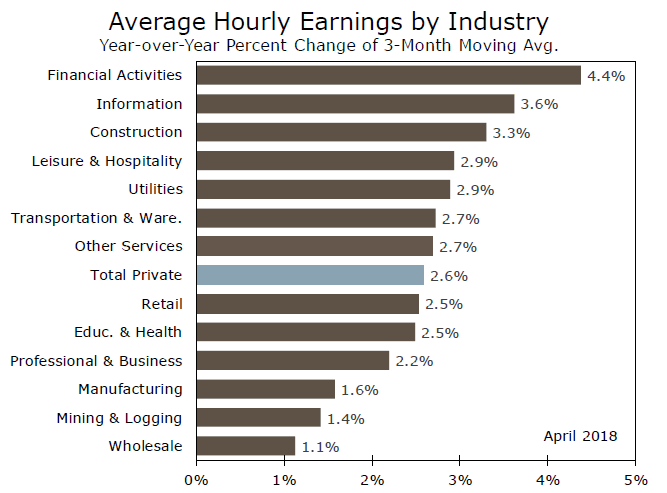
The theory that workers and employers respond to higher inflation is revealed in the rise in wages, consistent with the recent rise in inflation. However, there is a significant diversity in wage gains (middle graph). Not surprisingly, the service sectors of finance and information appear at the top. What is interesting is that the common perception of low-paid service jobs in leisure & hospitality show evidence of good gains over the past year. Also encouraging are the gains in earnings for construction workers. Last week's Employment Cost Index report offered further support for the case that total labor compensation is showing good gains in a tight labor market.
Labor Market Slack Continues to Diminish
After six months at 4.1 percent, the unemployment rate broke through the four percent level and declined to 3.9 percent. That puts it at the lowest level in 18 years. The efficacy of the traditional unemployment rate as a measure of labor market slack has been questioned in the current cycle, given the substantial drop in labor force participation and higher rates of under-employment since the recession. While the headline unemployment rate continues to paint a brighter picture of the labor market, other measures point to the issue of slack largely disappearing in the labor market.
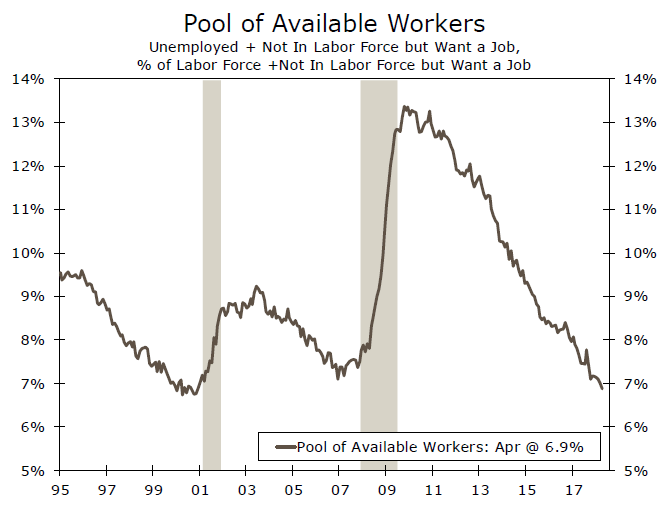
The share of workers employed part time but repot wanting full time work is nearly back to its pre-recession level. The total pool of available workers, which includes both the unemployed and workers not officially in the labor force but report wanting a job, has improved more substantially and is back to a rate not seen since before the 2001 recession (bottom graph). The dwindling rate of available workers suggests labor force participation may, as we saw in today's report, struggle to rise unless greater opportunities and/or higher compensation can lure more workers into the labor market.
US Job Growth Remains Solid in April Despite Headline Disappointment
U.S. non-farm payrolls rose 164k in April, below consensus of a 193k gain. Revisions over the prior two months saw an additional 30k jobs tacked onto first quarter job growth.
The goods producing sector added 49k jobs in April, mainly due to ongoing robust hiring in the manufacturing sector, while hiring in the construction sector rebounded. The private services sector added 119k jobs, with professional and business services (+54k), and the education and health industries (+31k) contributing most to the sectoral aggregate.
After five consecutive months of remaining unchanged at 4.1%, the unemployment rate fell to 3.9%. The labor force fell by 236k, the second consecutive month of decline. As a result, the labor force participation rate ticked down a tenth of a point to 62.8%, while that of the core-working aged (25 to 54) participation rate ticked down by the same amount to 82%. The participation rate for core-working aged men has ticked up to 89.3% and is back to its post-crisis peak, but the volatility in core-working aged women's participation rate is keeping a lid on the aggregate (see our recent report on the importance of boosting the core-working women's participation rate up). About 95.7 million Americans are not in the labor force, a new all-time high, and likely a reflection of the retiring baby boom cohort.
Wage growth decelerated in April, rising just 0.15% (previously: +0.2%). On a year-on-year basis, average hourly earnings held steady at 2.6%.
Key Implications
Although weather-related volatility at the start of the year may still be unwinding, April's payrolls suggest that the U.S. job market still remains fairly hot. Today's report may have disappointed market expectations, but are those rooted in reality? A 164k gain in jobs remains above the roughly 100k jobs need to absorb the average growth in the labor force.
A sub-4.0% print for the unemployment rate best exemplifies how tight the demand for labor is getting in the U.S. With the economy performing better than expected in the first quarter and likely to expand at a 3% average pace over the next few quarters, wage pressures should gradually build.
Although the FOMC decision this week was largely uneventful, the focus of the Committee is likely to remain on the evolution of wage and prices. There are broad signs that both are heating up, and a stimulus-fueled economy should only encourage further firming in these measures. So long as downside risks fail to materialize, we anticipate that the FOMC is on pace to continue to raise rates. We expect two more 25 basis point hikes in 2018.
U.S. April Employment Rebounds Modestly
Highlights:
- April payroll employment rose 164k though this was less than the 193k expected going into the release. However, this shortfall was offset by March’s gain being revised up to 135k from 103k.
- The unemployment rate dropped more than expected to 3.9% from 4.1% in March. The April rate was expected to drop though more modestly to 4.0%
- The annual increase in wages in April held steady for the third consecutive month at 2.6% after jumping to 2.8% in January. Tight labour markets are expected to return this rate to an upward trend.
Our Take:
Payroll employment growth rebounded as expected in April though the reported 164k increase was below the 193k expected going into the report. Tempering this downward surprise was March’s initially-reported gain of 103k was revised up to 135k. Though the average increase over the two months is down from the 186k monthly average achieved over the previous twelve months, the slowing is likely more an indication of increasing difficulty securing new hires with labour markets operating at capacity rather than any weakening in demand for workers. The larger-than-expected reported drop in the unemployment rate to 3.9% from 4.1% provides additional evidence of tightening labour markets. This rate is significantly below what the Fed has characterized as full employment within a range of 4.3% to 4.7%. Broader measures of unemployment, such as the U6 measure, also dropped to 7.8% in April. That is down from 8.0% in March and below pre-2008/09 recession levels for the first time this cycle. Tightening labour markets argue that the current highly stimulative monetary conditions are no longer warranted and reinforces our forecast that the fed funds range, currently at 1.50% to 1.75%, will continue to be hiked 25 basis points each quarter through next year finishing 2019 at 3.25% to 3.50%.
JPY is strong, but USD is not bad
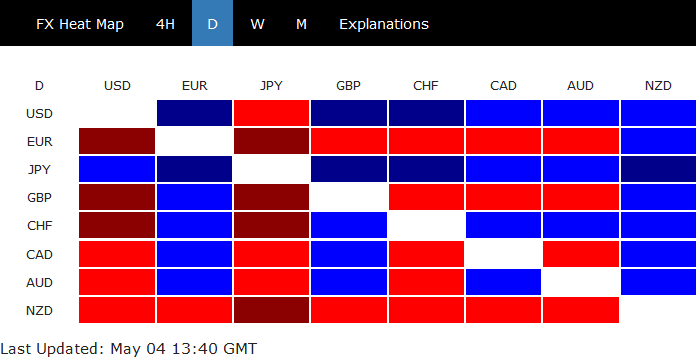
While JPY is strong after US NFP miss, USD's performance is not bad. It's closely following JPY as the second strongest one for the day. And indeed, USD is trading above yesterday's high against EUR, GBP, CHF.
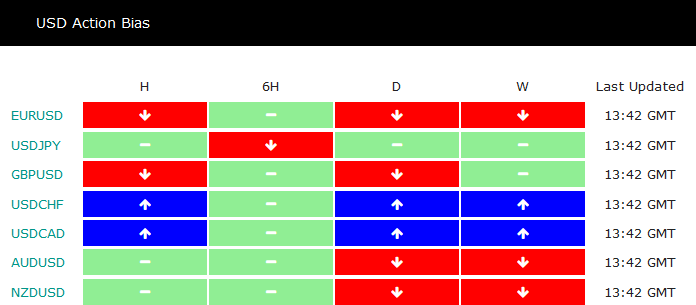
Looking at USD Action Bias table, D Action Bias show USD is in uptrend against EUR, GBP, CHF, CAD. 6H Action Bias, being neutral, suggest that these pairs were in consolidation. And H Action Bias argues that the trend might be resuming.
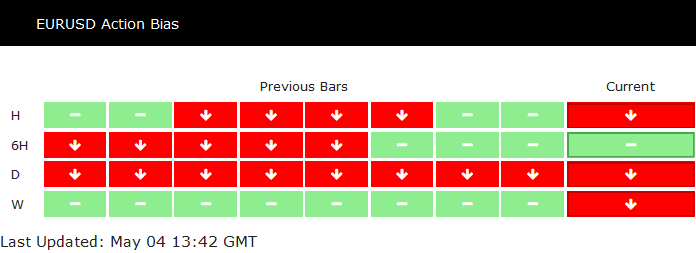
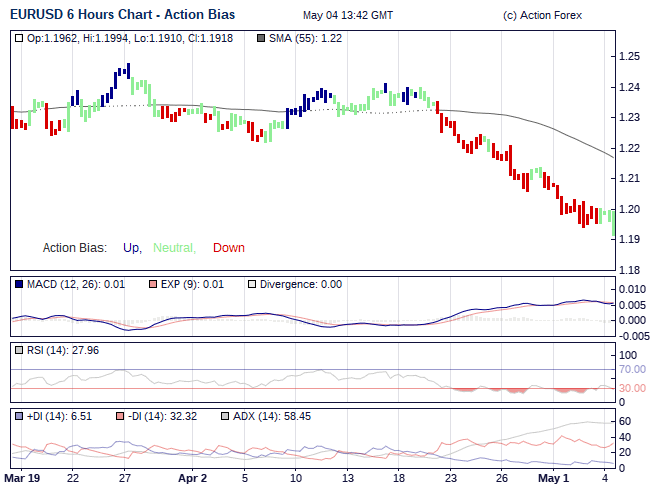
Of course, we'll have to look at the individual pairs too. There isn't much problem with the bearish view as seen in EURUSD action bias table. Now, we just have to wait for 6H Action Bias to turn red to confirm return of downside momentum.
US 30 Index Losing Steam, Cautiously Negative Bias in Place
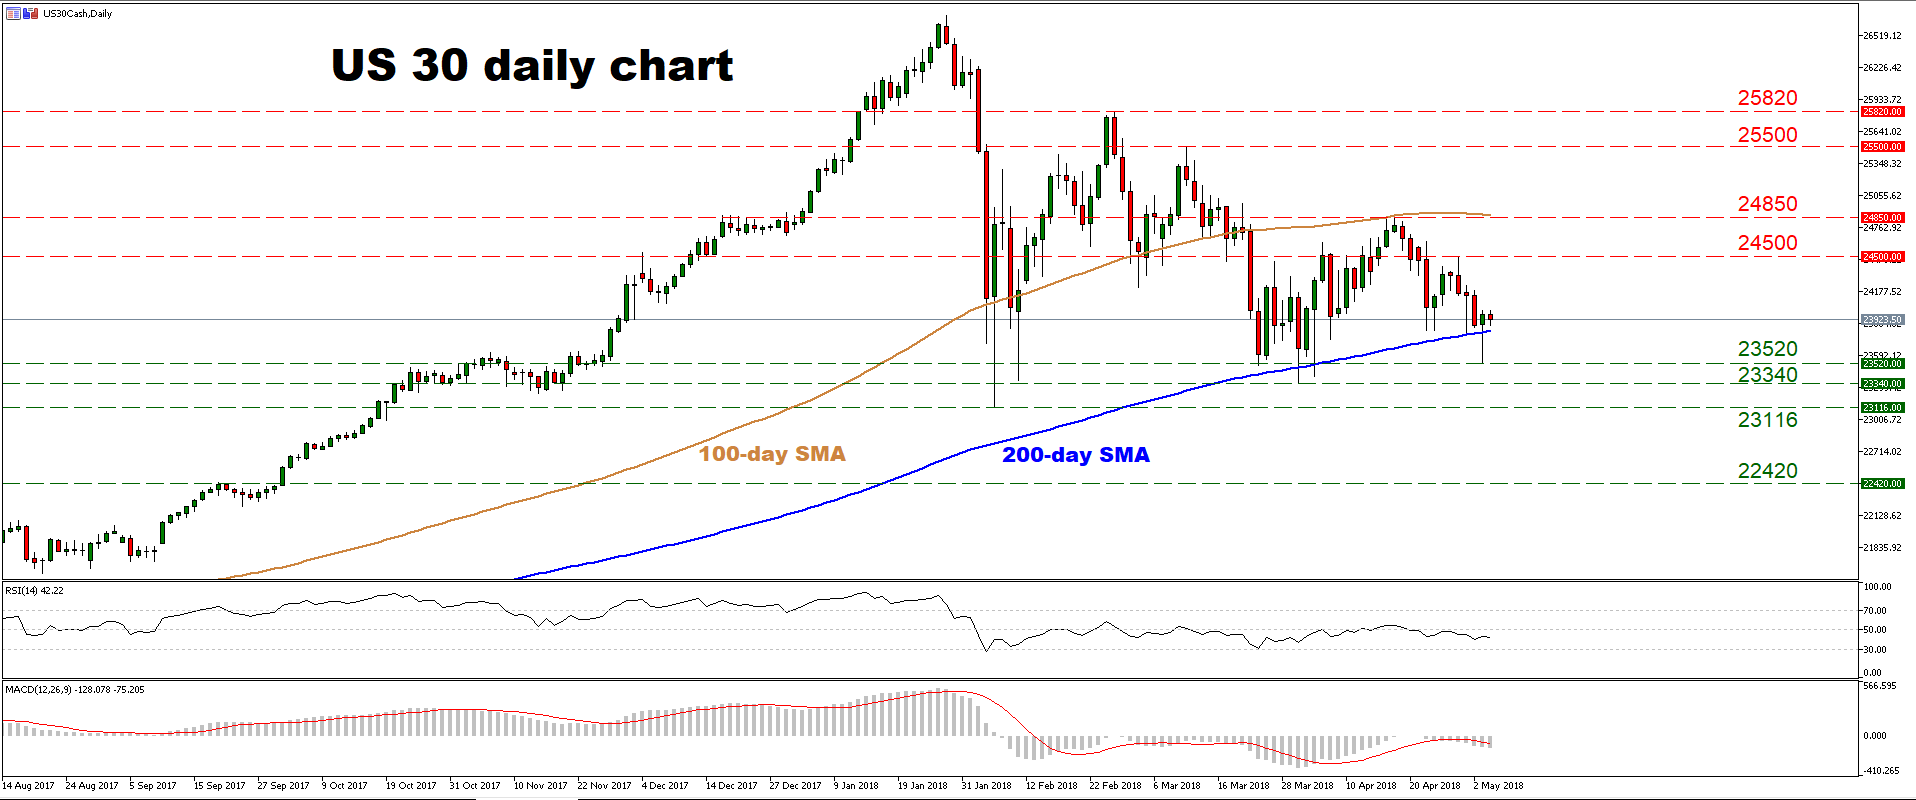
The US 30 index has been losing steam recently. It was rejected from its 100-day moving average (MA) on April 18 and has edged lower since, finding support near the 23,520 zone on May 3, and subsequently rebounding to close the day just above its 200-day moving average.
A cautiously negative picture is also supported by the index’s short-term oscillators. The RSI is currently below 50, detecting negative momentum, and is also pointing to the downside. The MACD, already negative, has just crossed below its red trigger line and looks to be heading lower as well.
In case of further declines in the short-run, immediate support may be found near the 200-day MA, which rests at 23,730. A downside break could open the way for another test of the 23,520 area, with steeper declines possibly aiming for the 23,340 territory, marked by the low of April 2. Further down, support may be found at 23,116, the trough from February 6. A potential break of that area too would mark a lower low on the daily chart, increasing the probability for further declines, perhaps towards the September 20 high of 22,420.
On the upside, advances in prices could encounter resistance at 24,500, the index’s peak from April 30. If buyers manage to overcome that zone, the 24,850 hurdle may come into view – notice that the 100-day MA is not far above, at 24,890. Higher still, sell orders may be found initially near the round figure of 25,500 – which is also the high of March 12 – and subsequently at 25,820, the top of February 27.
U.S. Adds 164,000 Jobs in April; Unemployment Falls to 3.9%
By the numbers:
- April non-farm payroll (NFP) +164K vs. +192Ke
- Change in private payrolls: +168K vs. +190Ke
- Change in manufacturing payrolls: +30K vs. +20Ke
- Birth-death adjustment: +260K vs. +65K prior
- US March payrolls revised to +135K; Feb Revised to +324K
- Prior change in private payrolls revised higher from: +102K to +135K
- April unemployment rate: +3.9% vs. +4.1%
- Apr Average Hourly Earnings +0.15%, or +$0.04 to $26.84; Over Year +2.6%
- Apr Average Workweek Unchanged at 34.5 Hours
- US Apr Labor-Force Participation Rate 62.8%
The jobless rate in the U.S fell to +3.9% in April, touching the lowest mark since December 2000. U.S employers added +164k jobs, a pickup from March and more than enough to keep up with population growth.
Nevertheless, workers’ wages continued to grow sluggishly despite the historically low unemployment rate. Wages grew +4c over the month and +2.6% over the past year.
Employers have stepped up hiring this spring – they have added an average +208K jobs over the past three-months, well above last year’s monthly average of +182K.
For rate ‘hawks,’ signs of a tightening labor market may push the Fed to consider raising short-term interest rates slightly more aggressively this year than they have signalled to date.
Hourly pay for private-sector workers rose, on average, rose +0.15% from a month earlier to +$26.84 in April. That figure was +2.6% above the year ago level.
The dollar is little changed on the market miss and U.S equity futures have pared declines after the release. U.S 10’s are trading a tad shy of +2.93%.
EUR/USD Mid-Day Outlook
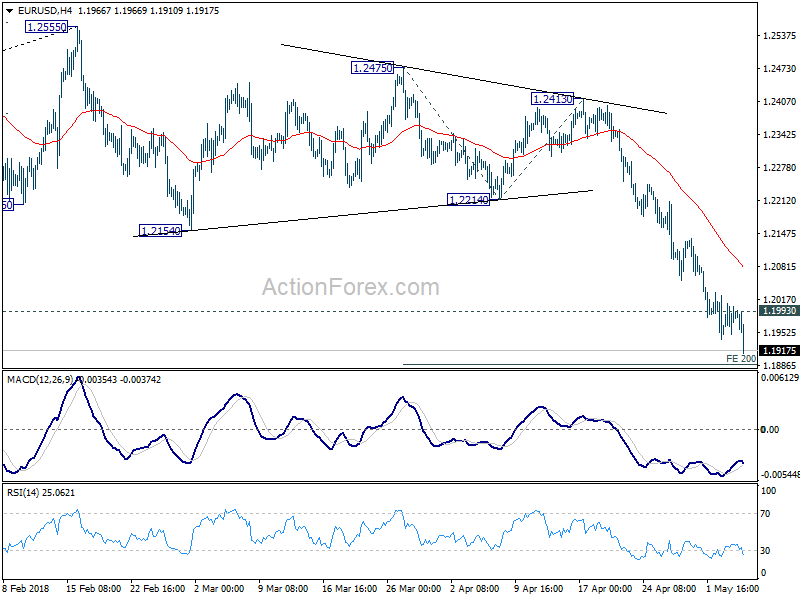
Daily Pivots: (S1) 1.1954; (P) 1.1981 (R1) 1.2015; More....
EUR/USD's decline extends in early US session and reaches as low as 1.1916 so far. Intraday bias remains on the downside for 200% projection of 1.2475 to 1.2214 from 1.2413 at 1.1891. Break will target 261.8% projection at 1.1730. On the upside, though, break of 1.1993 minor resistance will indicate short term bottoming and bring stronger rebound back to 4 hour 55 EMA (now at 1.2086) or above.
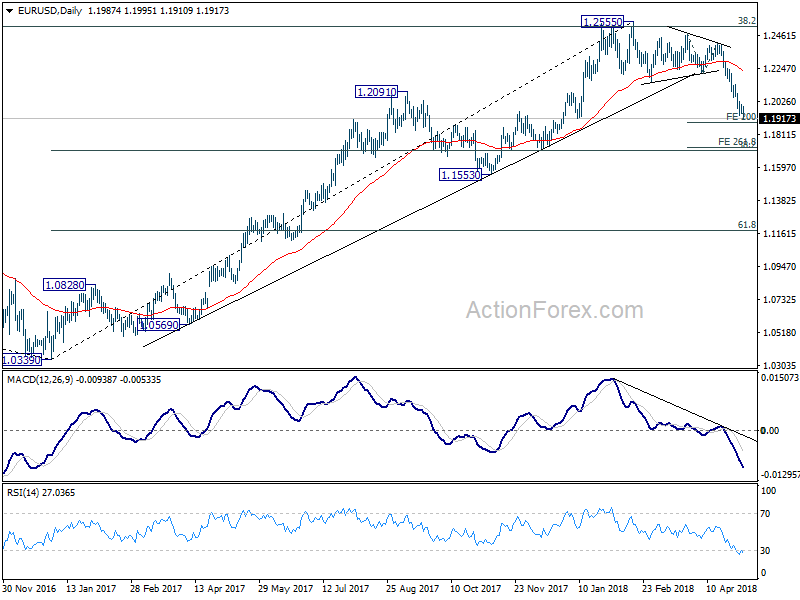
In the bigger picture, current decline and firm break of 1.2154 support confirms rejection by 38.2% retracement of 1.6039 (2008 high) to 1.0339 (2017 low) at 1.2516. A medium term top should be in place at 1.2555 and deeper decline would be seen back to 38.2% retracement of 1.0339 to 1.2555 at 1.1708 first. With current downside acceleration, there is prospect of hitting 61.8% retracement at 1.1186 before completing the decline. But still, we'll need to look at the structure to before deciding if it's a corrective or impulsive move.
GBP/USD Mid-Day Outlook
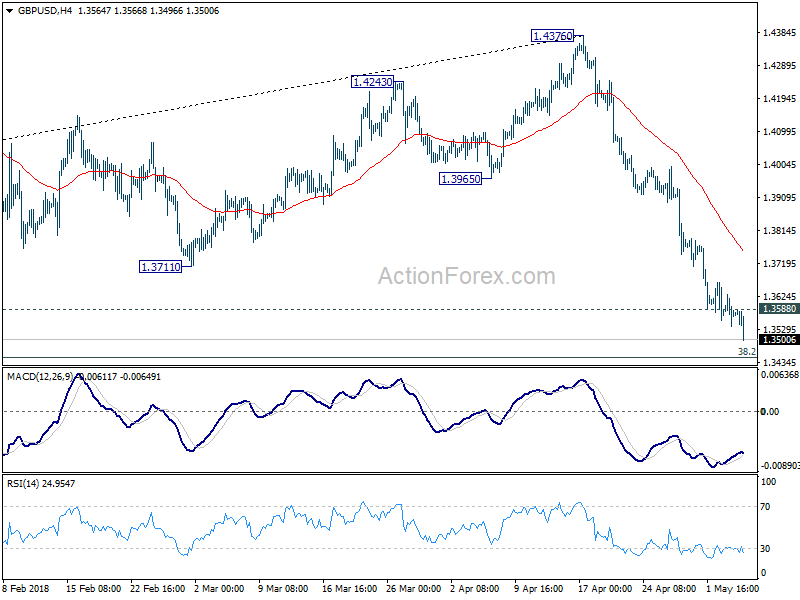
Daily Pivots: (S1) 1.3532; (P) 1.3580; (R1) 1.3624; More...
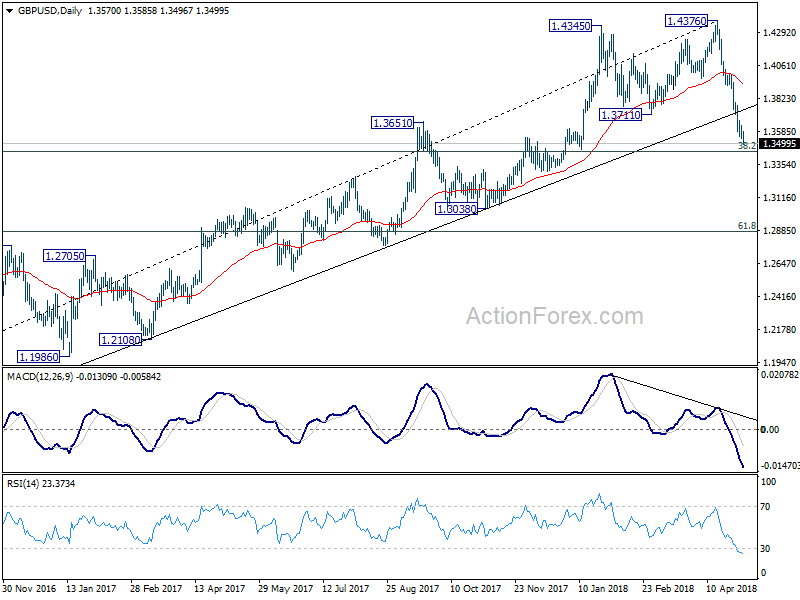
GBP/USD's decline extends in US session and reaches as low as 1.3519 so far. While downside momentum is unconvincing as seen in 4 hour MACD, intraday bias is staying on the downside for 1.3448 fibonacci level next. On the upside, above 1.3588 minor resistance will argue that a short term bottom is formed. In that case, stronger recovery could be seen back to 4 hour 55 EMA (now at 1.3753) and above before staging another fall.
In the bigger picture, current development suggests that whole medium term rebound from 1.1936 (2016 low) has completed at 1.4376 already, with trend line broken, on bearish divergence condition in daily MACD, after rejection from 55 month EMA (now at 1.4248). Deeper decline should be seen to 38.2% retracement of 1.1936 (2016 low) to 1.4376 at 1.3448 first. Break will target 61.8% retracement at 1.2874 and below. Outlook will stay bearish as long as 55 day EMA (now at 1.3955) holds, even in case of strong rebound.