Sample Category Title
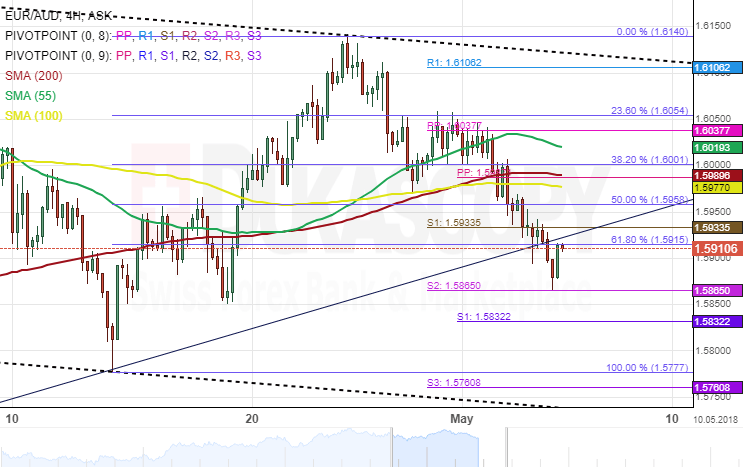
EUR/AUD 4H Chart: Bears Likely To Prevails
The common European currency has been trading in several patterns against the Australian Dollar. The most important of which is a junior descending channel which is presently moving down to the lower boundary of a dominant ascending pattern.
After hitting the 23.60% Fibonacci retracement level, the exchange rate began to fall. However, this decline has been stopped by the monthly pivot point at 1.5865.This retracement can be measured by connecting the low at 1.5777 and the high at 1.6140.
As for near future, it is expected that bears continue to take control of the market during the following trading sessions. Thus sending the currency exchange rate for a test of the lower boundary of the dominant pattern.
GBP/AUD 1H Chart: Reaches Support Cluster
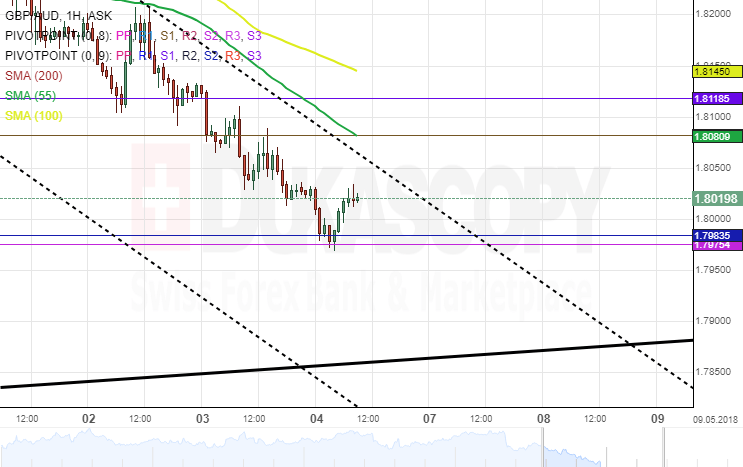
The British Pound has depreciated substantially against the Australian Dollar during the past one week. This bearish momentum has pushed the currency pair towards the lower boundary of a dominant ascending channel.
At the time of this analysis, a strong support cluster set by the combination of the weekly and the monthly pivot point near 1.7983 was providing support for the rate from falling.
Everything being equal, the GBP/AUD exchange rate is likely to make a corrective move north during within this day. Meanwhile, technical indicators favour bears to grow stronger during the following trading session.
EUR/USD: US ISM Non-Manufacturing PMI
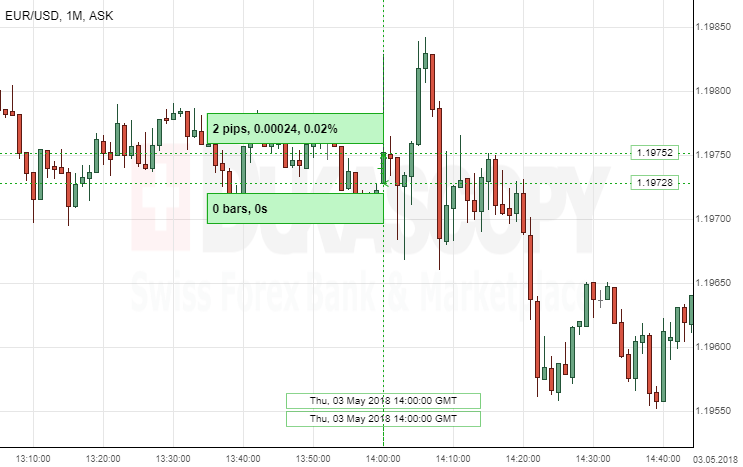
The Greenback weakened against the Eurozone's single currency, following US ISM Non-Manufacturing PMI data release on Thursday. The EUR/USD currency pair gained only two pips, or 0.02%, however reversed later on and continued to go downwards, thus strengthening US dollar.
The Institute for Supply Management released lower-than-expected Non-Manufacturing Purchasing Managers' Index data of 56.8 for the month of April.
"The trade tensions are impacting purchasing of steel and are causing suppliers to send letters of concern," a respondent from the construction industry said.
USD/CAD: Canadian Trade Balance
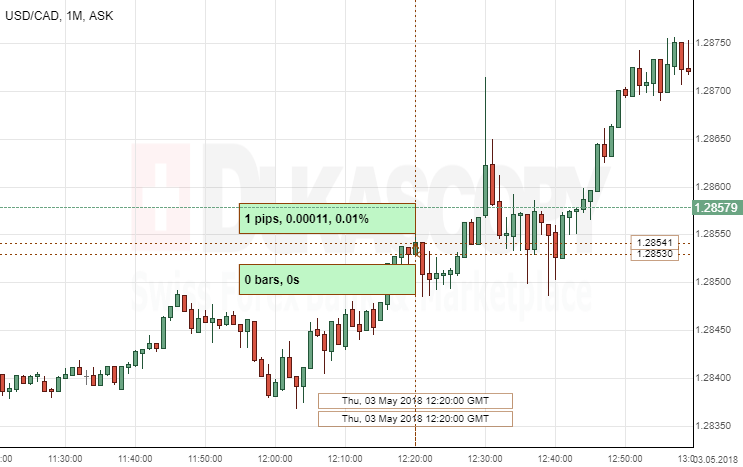
The Canadian Dollar weakened against the Greenback, following Canadian Trade Balance data release on Thursday. The USD/CAD currency pair gained only one pip, or 0.01%, and later on was seen to continue to go upwards, thus weakening the Canadian Dollar even more.
The Statistics Canada released lower-than-expected Trade Balance data of negative 4.1B for the month of March. The trade balance continued to stay in the deficit zone.
"In what was expected to be a mundane release, the trade deficit widened to a record level in March," says Royce Mendes, an economist at CIBC Capital Markets.
GBP/USD: UK Services PMI
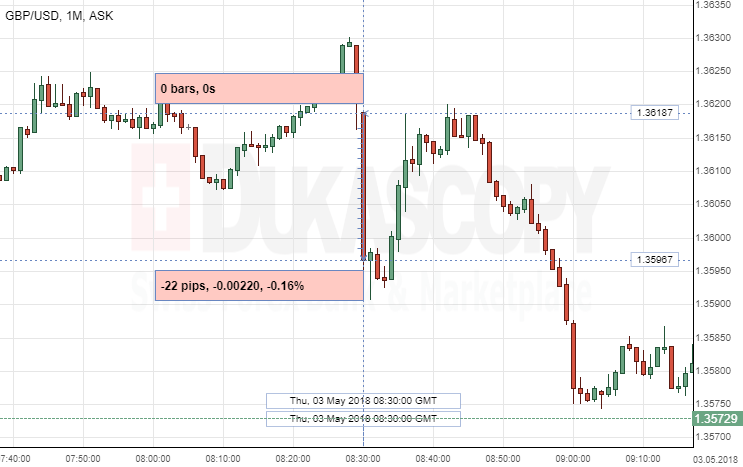
The British Pound weakened against the Greenback, following the UK Services PMI data release on Thursday. The GBP/USD currency pair lost 22 pips, or 0.16%, to continue fluctuating in the 1.3596 area.
The Markit released Services Purchasing Managers' Index that came out lower-than-expected of 52.8, compared to the 51.7 in the previous period.
"The services survey adds to signs that the rate of economic growth remained disappointingly subdued at the start of the second quarter," said Chief Economist at Markit Chris Williamson.
Spot Gold Trades Between 10 And 200SMA Ahead Of US Jobs Data
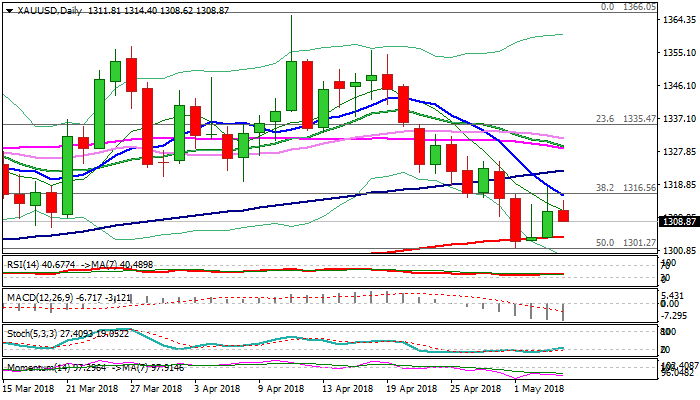
Gold price eased in early Friday’s trading after previous day’s rally was strongly rejected at $1318 (falling 10SMA), signaling limited recovery, following multiple downside rejections as rising 200SMA contained bear-leg from $1355 high (18 Apr).
Negative momentum and bearish setup of daily MA’s, keep broader bears intact and risk shifted lower.
Eventual break below 200SMA ($1304) and psychological $1300 support would be bearish signal for continuation of the bear-leg from $1355 towards next strong support at $1285 (Fibo 61.8% of $1236/$1366 ascend).
Bullish scenario needs close above falling 10SMA to ease existing bearish pressure and signal stronger retracement of $1355/$1301 bear-leg).
US jobs data are expected to provide stronger direction signals. Upbeat results from jobs sector in April would boost dollar and put the yellow metal’s price under increased pressure, while miss would give a breather to gold’s bears and allow for stronger correction.
Res: 1314, 1316, 1323, 1325
Sup: 1308, 1304, 1300, 1289
WTI Oil – Positive N/T Tone Above 10SMA But Triple-Doji On Weekly Chart Warns
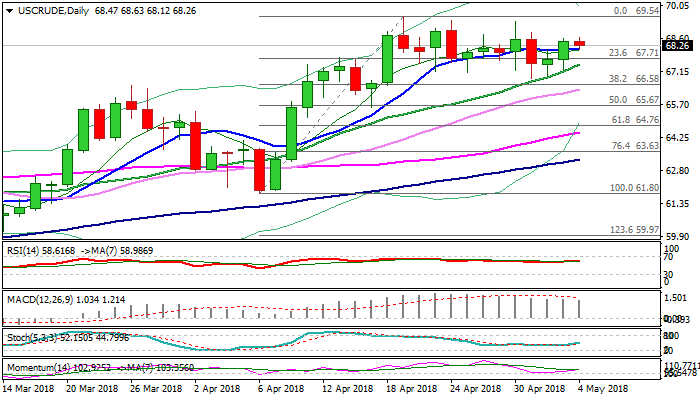
WTI oil price holds around the mid-point of larger $67/$69.54 congestion on Friday, following Thursday’s rally and close above 10SMA ($68.11).
Daily MA’s are back to full bullish setup and 14-d momentum is heading north, supporting near-term bullish stance, which requires confirmation on weekly close above 10SMA.
Such configuration would keep focus at the upside for possible renewed attacks at recent recovery high at $69.54 (19 Apr) and psychological $70 barrier on break above near-term range.
On the other side, oil is on track for the third consecutive weekly Doji which signals strong indecision and warns of pullback as bulls were repeatedly rejected under $70 barrier in past three weeks.
Overbought slow stochastic and weakening momentum studies on weekly chart support the notion.
Sideways-moving 10SMA marks immediate support at $68.11, followed by rising 20SMA ($67.45) and key supports at $67.00 zone (range floor) and $66.58 (Fibo 38.2% of $61.80/$69.54 upleg).
Res: 68.58, 68.87, 69.32, 69.54
Sup: 68.11, 67.71, 67.45, 67.20
More Signs Growth Has Peaked As Trade Talks Drag On
Today's key points
- The trade war is still being slowly fought but the coming weeks are important.
- More signs that growth has peaked but we are not heading for a downturn.
- Fed is on autopilot and EUR/USD has moved below the 1.20 mark.
- EUR/USD may move lower nearterm; medium term still set to move higher
Trade war is still being slowly fought
As we argued back in March, the trade war is being fought very slowly and is more verbal than economic at this stage, see Strategy: Slowly fought trade war amid increasing Libor/OIS spread,, 23 March. The development over the past couple of weeks supports this but the coming weeks are going to be important. The Trump administration has decided to extend the exemption period of steel and aluminium tariffs on the European Union, Mexico and Canada until 1 June to allow for further negotiations. Also, a US delegation with prominent names such as US Trade Representative Robert Lighthizer, Commerce Secretary William Ross and Treasury Secretary Steven Mnuchin went to China in order to find a solution to the trade dispute at the negotiation table. Also, President Trump is going to meet President Xi Jinping in the ‘not too distant future' to discuss trade. While we do not know the outcome of the talks yet at the time of writing, it seems this will be only the first meeting of a series of meetings, and the US has signalled that the negotiations may take a year or so. A full-blown trade war between the US and China remains the biggest risk factor for markets and the economy.
More signs growth has peaked
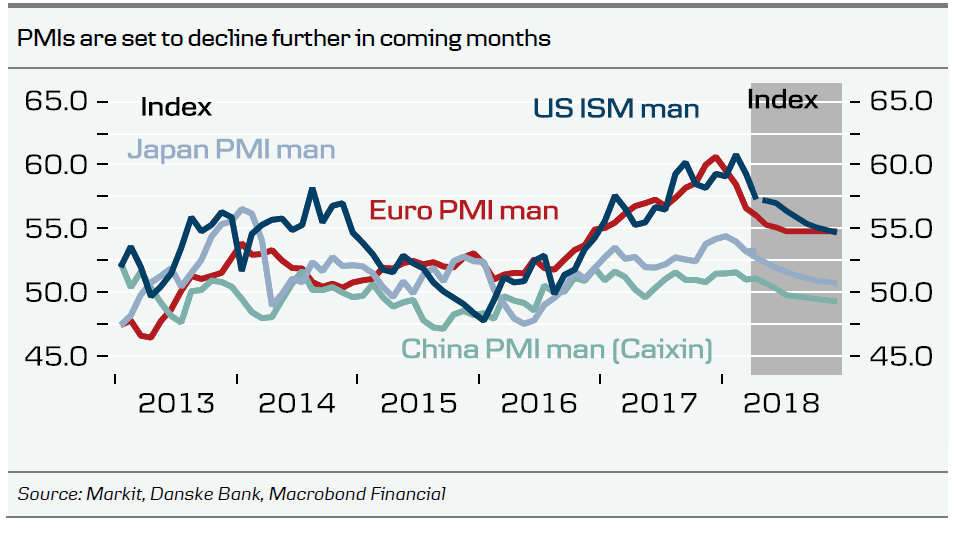
During the week, we have gathered more data supporting our view that the business cycle (in terms of growth) has peaked, which we outlined recently in Research: Global business cycle is moving lower,, 19 April. It is not because we believe we are heading for a downturn, just that economic growth is going to be slightly slower than it was in the second half of last year. In the US, the ISM manufacturing index declined from 59.3 to 57.3, which was more than expected. While it was not a big surprise the ISM dropped, as it has been too high compared to other indicators and hard data for quite some time, we still believe it will move further down in three-six months. Also, in Europe, where the manufacturing PMI came out stronger than expected, we believe we will see further declines over the same horizon. The first estimate of euro area Q1 GPP slowed growth slowed from 0.7% q/q in Q4 17 to 0.4% q/q in Q1. While the ECB is likely to end the QE programme this year, we still think the first ECB rate hike is far away, as inflation remains subdued.
Fed on autopilot while EUR/USD may move lower near term
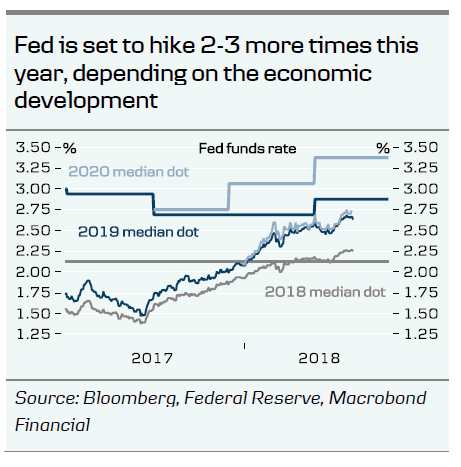
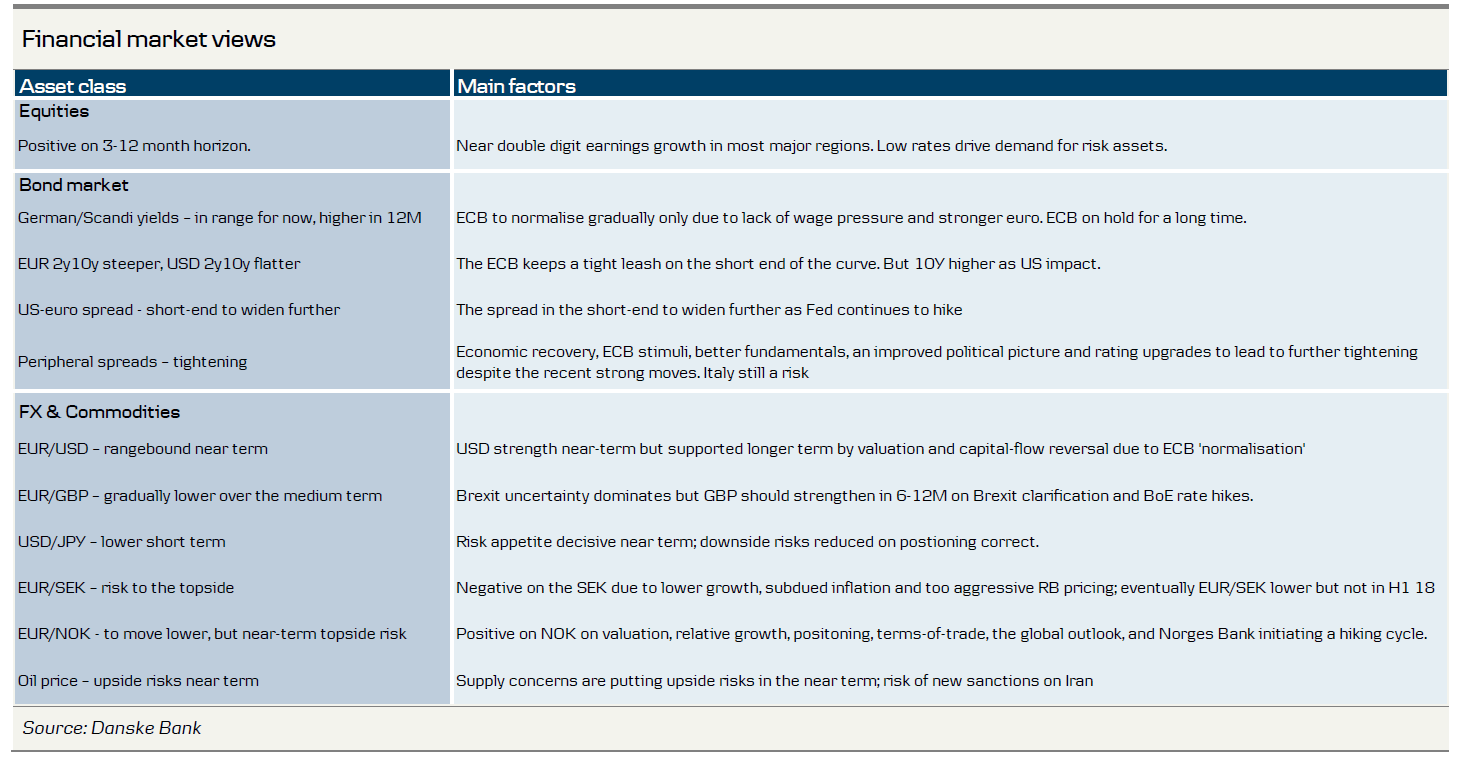
As expected, the Fed maintained the target range at 1.50-1.75% at this week's meeting but made a couple of interesting changes to the statement, which otherwise does not change much from meeting to meeting. Firstly, the Fed now says that inflation is running near the 'symmetric' 2% inflation target, meaning that it will allow inflation to move slightly above 2% (as it also projected back in March). Secondly, it no longer says that it is monitoring inflation closely. In our view, despite the market reaction, we think the Fed was slightly hawkish increasing the probability of three additional hikes this year. Our base case is two-three more rate hikes this year, which is in line with market pricing and the Fed's own view, as the FOMC members were divided between two and three more hikes in the latest projection update in March. As the hiking cycle is likely to continue next year, we are likely to see the US 2Y10Y curve continuing to flatten, although we do not expect it to invert. Markets are becoming more aware of the spread, as it is seen as one of the best recession indicators. In Europe, we expect a steeper yield curve, as the ECB maintains a relatively tight grip on the short end of the curve, but the 10Y segment of the curve is set to be pushed up by higher US yields, the end of ECB QE and pricing of ECB rate hikes in 2020.
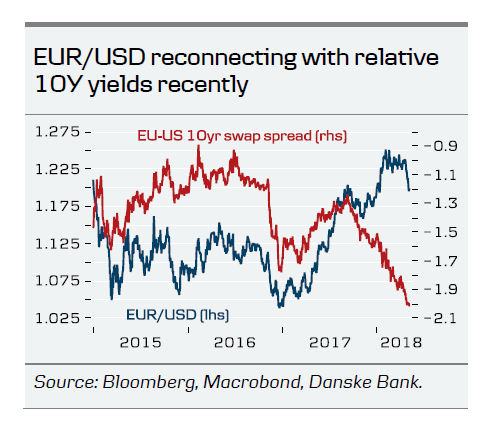
This week EUR/USD broke below the 1.20 mark. In the near term, we may see EUR/USD moving lower on relative rates, flows and positioning, also from a technical point of view with the recent break of the 200D moving average. While relative rates – notably not in the shorter end of the curve – have seemingly failed to move EUR/USD over the past few years, we have seen a clearer reconnect of the 10Y spread with the EUR/USD spot. As US yields are set to increase more than European ones, this should be USD supportive near term. Albeit investors have reduced EUR/USD longs, positioning remains an argument for limited upside in EUR/USD.
However, our medium-term story remains unchanged. A turn in the capital tide from USD to EUR is brewing as the relative attractiveness of EU versus US assets is on the rise. We expect 1.28 in 12M.
GBPJPY Strongly Bearish, Holds Near 6-Week Low Of 147.58
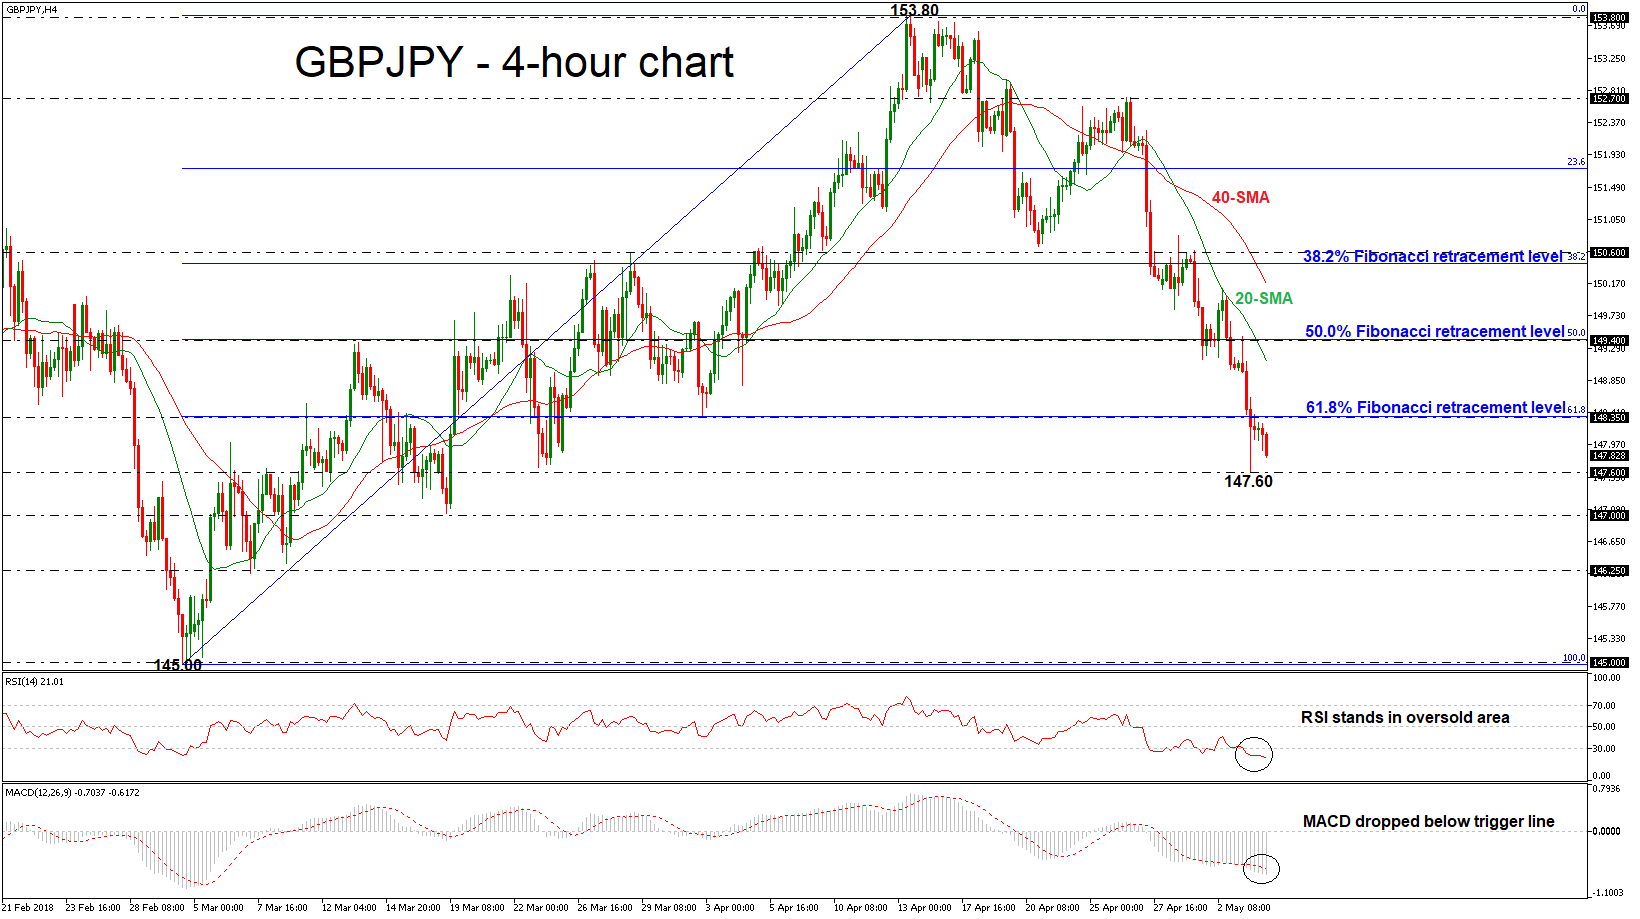
GBPJPY has been underperforming following the bounce off the 153.80 resistance level on April 13 and during Thursday’ssession it reached a new six-week low of 147.58. The aggressive sell-off drove the pair below the 61.8% Fibonacci retracement level of the upleg from 145.00 to 153.80 suggesting a crucial bearish movement.
In the 4-hour chart, the technical indicators dropped to their oversold levels, confirming the negative attitude on price. The RSI indicator slipped below the 30 level and is still sloping down, while the MACD oscillator declined below its trigger line.
In case of further losses below the six-week low (147.58) should see the March 19 trough of 147.00 acting as a major support barrier. A fall below this level would reinforce bearish structure in the medium-term and open the way towards the next key support level of 146.25.
In the event of an upside reversal, the 61.8% Fibonacci mark, which overlaps with the 148.35 barrier could act as a key level before being able to re-challenge the 50.0% Fibonacci of 149.40. Also, above this level, the 38.2% Fibonacci mark of 150.45 would be a significant obstacle for the bulls. Further gains would lead the way towards the 23.6% Fibonacci of 151.75.
Overall, GBPJPY continues the negative pressures and more declines are expected in the near future.
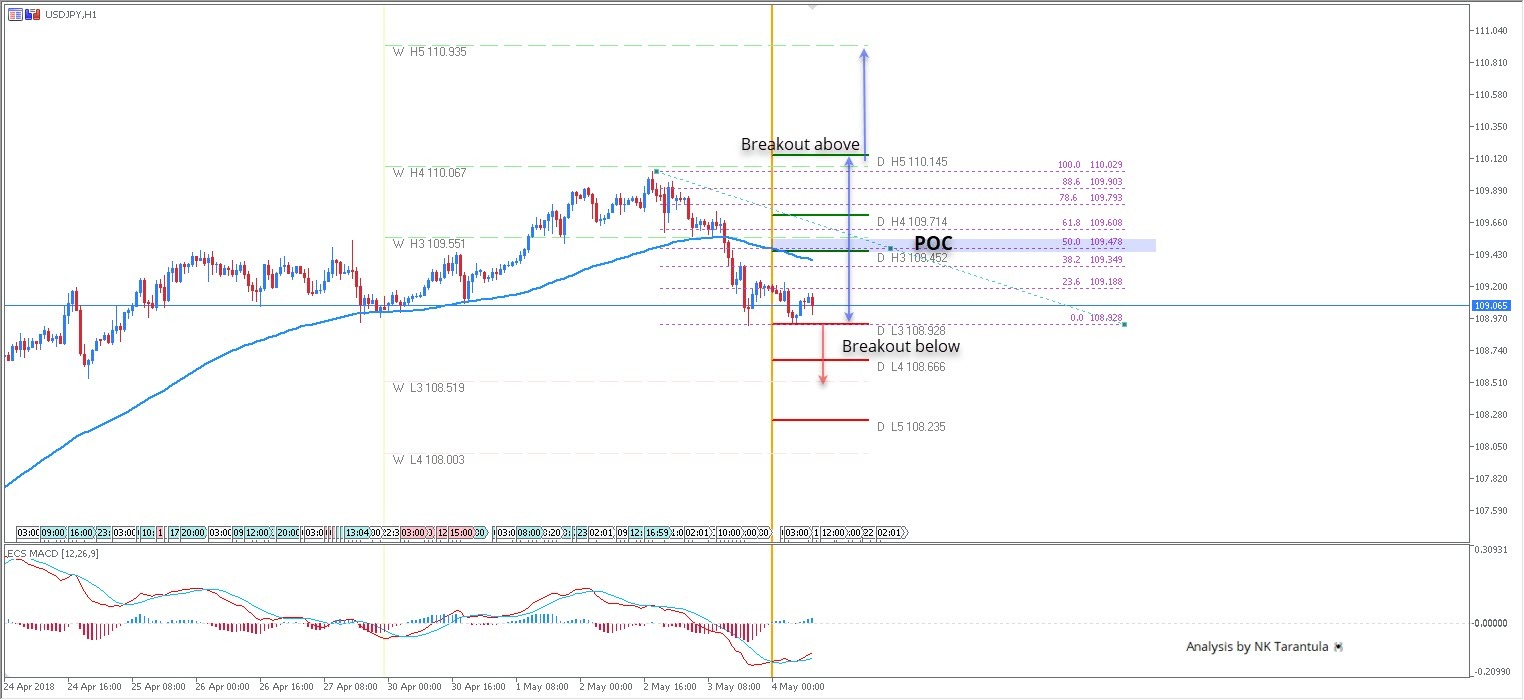
Pre NFP Analysis: USD/JPY Make It Or Break It
Today's focus will be the NFP with all related data such as the Average Hourly Earnings (wages). This will be the main driver for today and possibly the next week too.109.45-55 is the important zone to watch for further reaction from the USD/JPY. Above 109.55 the price could bounce to 109.71and 110.14. Only above 110.14 the target is 110.93, and that might only happen during next week. I don't think it will happen today due to the ATR of the USD/JPY. Below 109.45 targets are 109.2- followed by 108.92. Below 108.90, the target is 108.50. Watch for the US data today and be careful with placing positional trades prior to NFP.