Sample Category Title
GBP/USD Bearish Trend Loses Momentum Near 1.35 And NFP
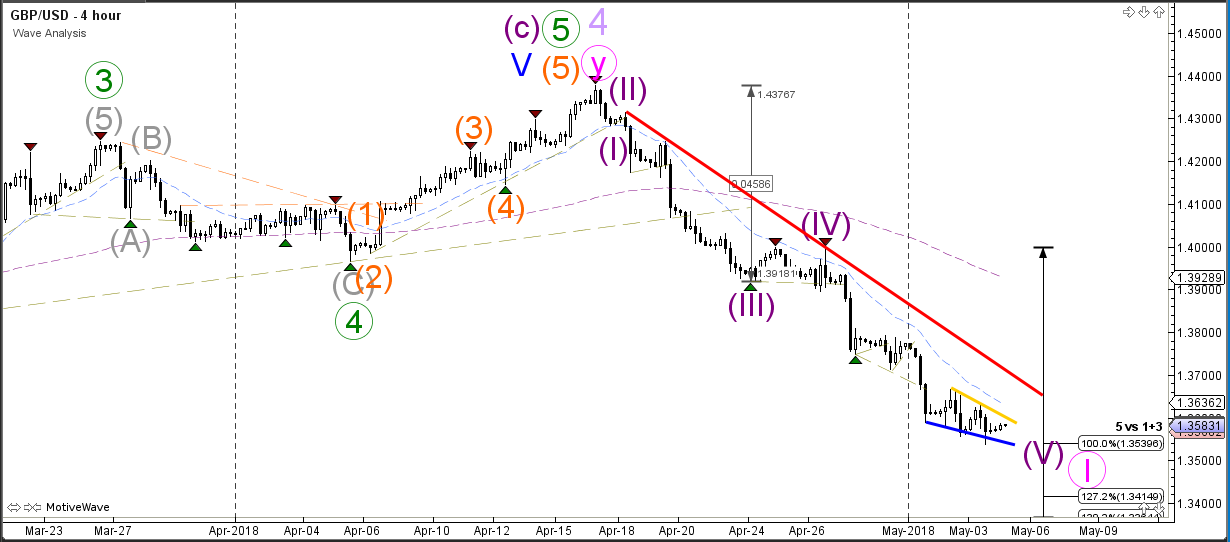
The GBP/USD bearish trend continued yesterday with a new lower low but price action seems to be slowing down. Price action looks more corrective in the most recent channel (orange/blue lines) as price approaches the critical 1.35 round level, which could be a new bounce or break spot. Price remains bearish as long as price stays below the resistance trend line (red) but a bullish break above the resistance would indicate the completion of wave 1 (pink) and the start of wave 2. Please note that today's NFP event could impact price action.
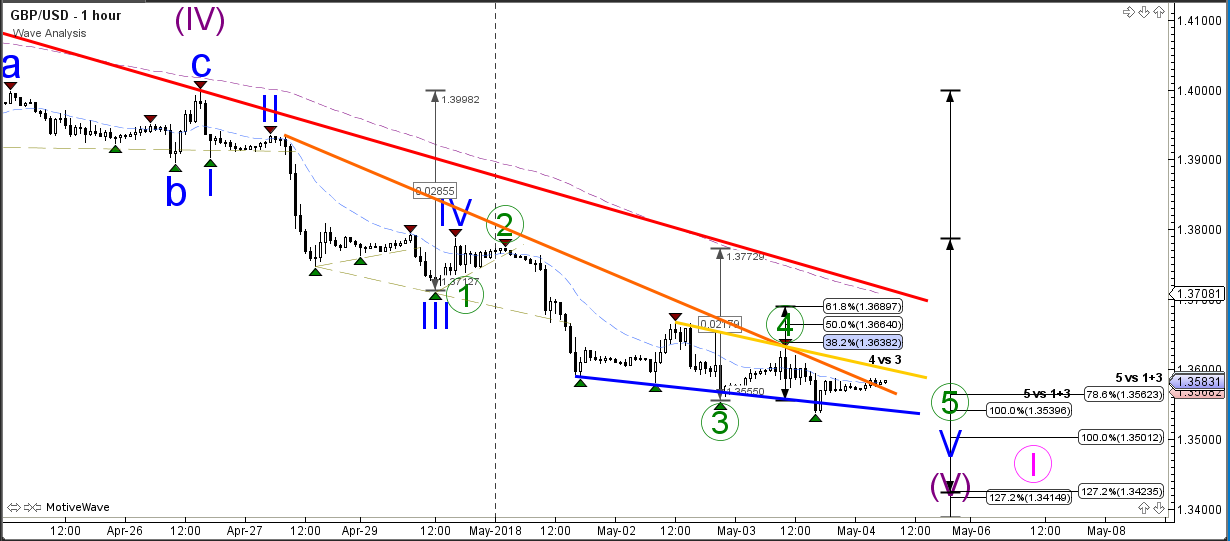
The GBP/USD has either completed the wave 4-5 (green) correction or is still expanding the wave 4 (green) correction. This will depend on whether price will respect the Fibonacci levels and make a bearish bounce or will it break above the 61.8% Fib and resistance trend line (red).
Bitcoin Approaching The 9800 Range
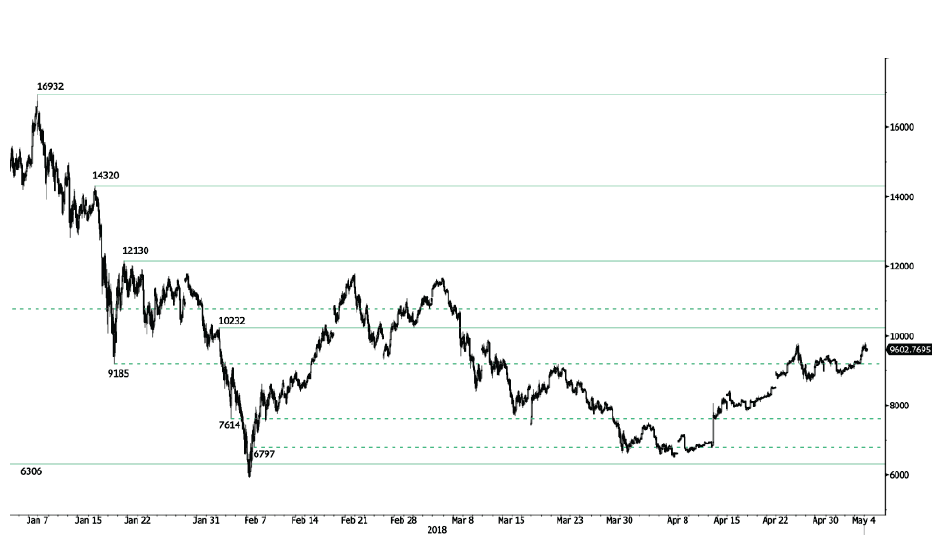
Bitcoin rise started in mid-April continues, currently trading above 9600 and heading along the 9800 range. Bitcoin bearish pattern started in March 2018 weakens. The pair is contained between hourly support and resistance given at 6306 (13/11/2017 low) and 10232 (01/02/2018 high). The technical structure suggests further short-term increase.
In the long-term, the digital currency has had an exponential growth but also presented important downturns. There is decent likelihood that the currency could stabilize between 7'000 - 12'000 in 2018. Bitcoin is trading slightly above its 200 DMA (8300 range).
Dips As Opportunity To Reload EUR/USD Longs
We remain negative on the USD and see dips as opportunity to reload EUR/USD longs
How the song has changed – just weeks ago, the dollar was dead. Now analysts are scrambling over each other to make lower calls: major US banks are predicting 1.16 euros near term. Stronger growth and quicker inflation has sent interest rates up, generating speculation that the Fed will speed up tightening. Plus, President Trump’s successes internationally in China and Korea are helping. The US Federal Reserve is very likely to raise rates again in June meeting, and we see the probability of additional hikes above the current 2.50%. However, we suspect that yields’ differentials have shifted so much as to redefine FX pricing. Prior to the break of 2.90% in US 10-year treasuries, currency sensitivities to yields changes were non-existent. Carry trading was extremely unprofitable. Now that USD bears have been squeezed out, further USD strength will depend on deeper weakness in Europe and Asian on a relative value standpoint.
Evidence that the US late-stage economic acceleration goes unabated will be today’s US payroll report. After a soft March, April’s non-farm payrolls is likely to rebound. The real focus will be on wage growth: average hourly earnings is expected to have risen 0.2%, putting the annual rate to a solid 2.7%.
Turkey struggles to contain inflation
As the USD/TRY continues to depreciate, rising by 5.55% since last week, we see no reason to turn the trend. Currently at 4.2668, the pair is headed to 4.2830 short-term. Lira dumping will continue.
Financial market volatility and ongoing trade disputes between US and China are not welcomed by emerging economies who suffer from continuous currency depreciation. Facing a slowdown in April economic confidence due to less optimistic business conditions, the Turkish economy slackened amid swelling inflation. April headline and core consumer price indexes are estimated at 10.85% and 12.24% annually (prior: 10.23% and 11.44%), due to increases in transport, clothing and furnishing while the impact of food and oil imports remained low. The Central Bank of Turkey (TCB) has yet to deliver a clear, determined money tightening to the market.
CRUDE OIL Decreasing
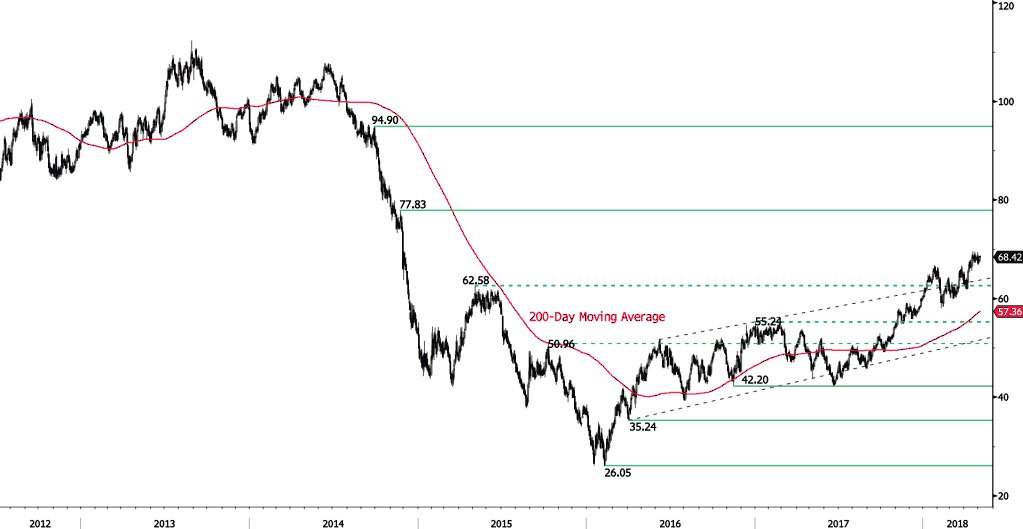
Crude oil is decreasing following recent rise from 68.66 high, heading along the 68.10 range. Crude Oil is currently trading at December 2014 levels. The bullish pattern started in mid- February 2018 is maintained. Hourly support and resistance are given at 65.56 (17/04/2018 low) and 69.54 (12/01/2014 high). The technical structure suggests short-term downward moves.
In the long-term, crude oil has recovered after its sharp decline last year. However, we consider that further weakness is very likely. For the time being, the pair lies in an upside trend since June 2017. Support lies at 42.20 (16/11/2016) while resistance is located at 77.83 (20/11/2014). Crude oil is trading largely above its 200 DMA.
SILVER Increasing
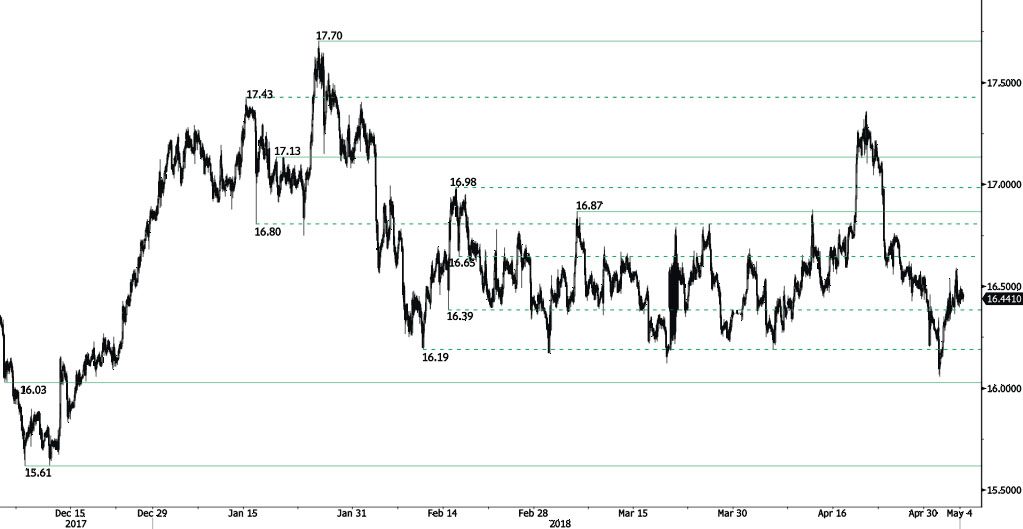
Silver recovery phase from 16.06 (01/05/2018 low) continues, trading above 16.40 and heading along the 16.50 range. Hourly support and resistance are given at 16.03 (05/12/2017 low) and 16.87 (06/03/2018 high). The technical structure suggests further short-term increase.
In the long-term, the trend remains negative/ sideways. Further downside is very likely. The pair is trading below its 200 DMA. Resistance is located at 21.58 (10/07/2014 high). Strong support can be found at 11.75 (20/04/2009).
GOLD Maintained At 1312
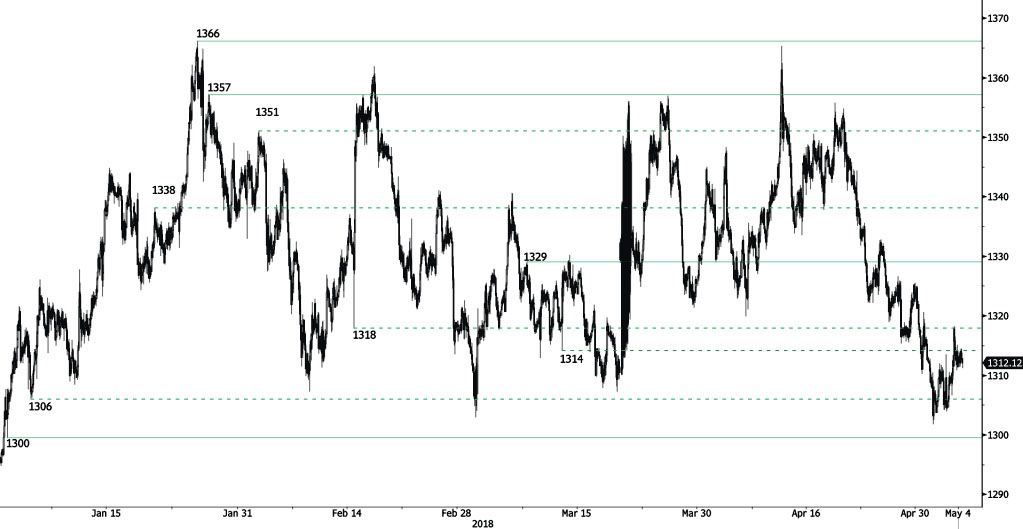
Gold is trading sideways at the 1312 range, heading along the 1313 range. Hourly support and resistance are given at 1300 (29/12/2017 low) and 1329 (08/03/2018 high). The technical structure suggests short-term sideways trading moves.
In the long-term, the technical structure suggests that there is a growing upside momentum. A break of 1'392 (17/03/2014) is required to confirm it. A major support can be found at 1'045 (05/02/2010 low).
EUR/CHF Trading Sideways
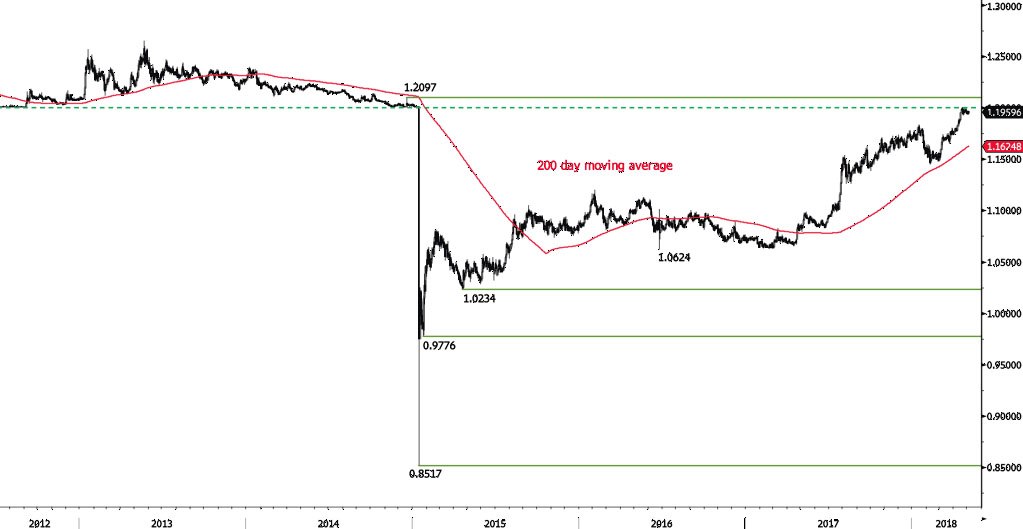
EUR/CHF is maintained at the 1.1955 range, trading sideways. Strong resistance at 1.20 remains. Hourly support given at 1.1842 (11/04/2018 low) is distanced. The short-term technical structure suggests further short-term sideways trading moves.
In the longer term, the technical structure has reversed. Strong resistance at 1.20 (level before the unpeg) is now at reach. The ECB's slowing QE program is likely to cause buying pressures on the euro, which should weigh in favour of the EUR/CHF. Support and resistance can be found at 1.0624 (24/06/2016 low) and 1.2097 (18/12/2014 high).
EUR/GBP Bearish Consolidation
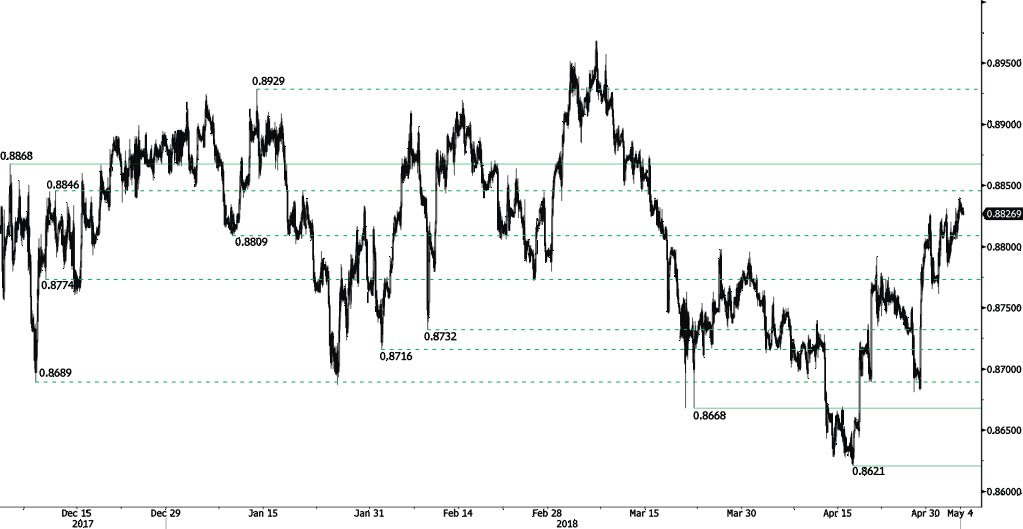
EUR/GBP is pausing, trading along 0.8828 and approaching the 0.8825 range. EUR/GBP bearish pattern started in March is weakening. Hourly support and resistance are given at 0.8668 (22/03/2018 low) and 0.8868 (05/12/2017 high). The technical structure suggests short-term sideways trading moves.
In the long-term, the pair has largely recovered from 2015 lows. The technical structure suggests further upside pressure. Strong resistance can be found at 0.9500 (psychological level) while support remains at 0.8304 (05/12/2016 low). The pair is trading below its 200 DMA.
AUD/USD Neutral
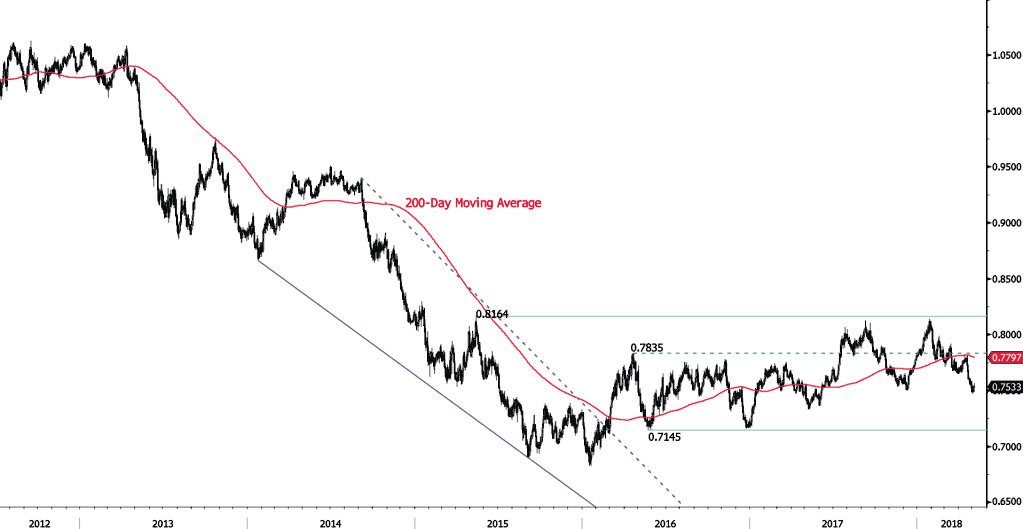
AUD/USD bearish pattern from 0.7813 (19/04/2018) pauses after reaching 0.7473 (01/05/2018 low), trading along 0.7530 and approaching the 0.7532 range. Hourly resistance at 0.7879 (28/02/2018 high) remains. The technical structure suggests short-term sideways trading moves.
In the long-term, the upward trend slows down after failing to reach key resistance at 0.8164 (14/05/2015 low). Key support stands at 0.6009 (31/10/2008 low). A break of the key resistance at 0.8164 (14/05/2015 high) is needed to invalidate our long-term bearish view.
USD/CAD Weakening
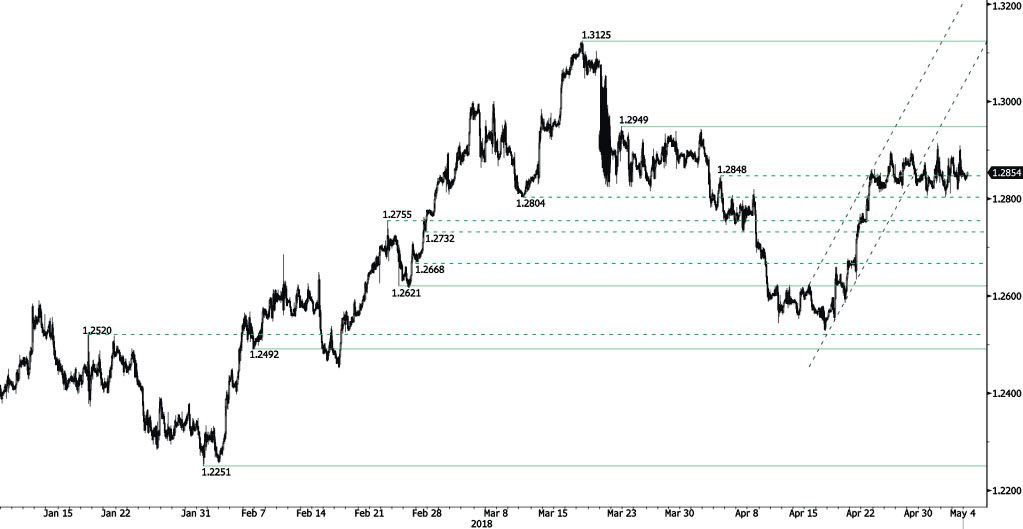
USD/CAD bullish trend stops, trading sideways since end-April. The pair is trading higher, heading along the 1.2865 range. Hourly support and resistance are given at 1.2621 (23/02/2018 low) and 1.2949 (22/03/2018 high). The technical structure suggests short-term upward moves.
In the longer term, the pair is trading between resistance point at 1.3805 (05/05/2017 high) and support at 1.2128 (18/06/2015 low). Strong resistance is given at 1.4690 (22/01/2016 high). The pair is likely to head lower. The pair is trading above its 200 DMA.