Sample Category Title
USD/CHF Daily Outlook
Daily Pivots: (S1) 0.9952; (P) 0.9976; (R1) 1.0017; More...
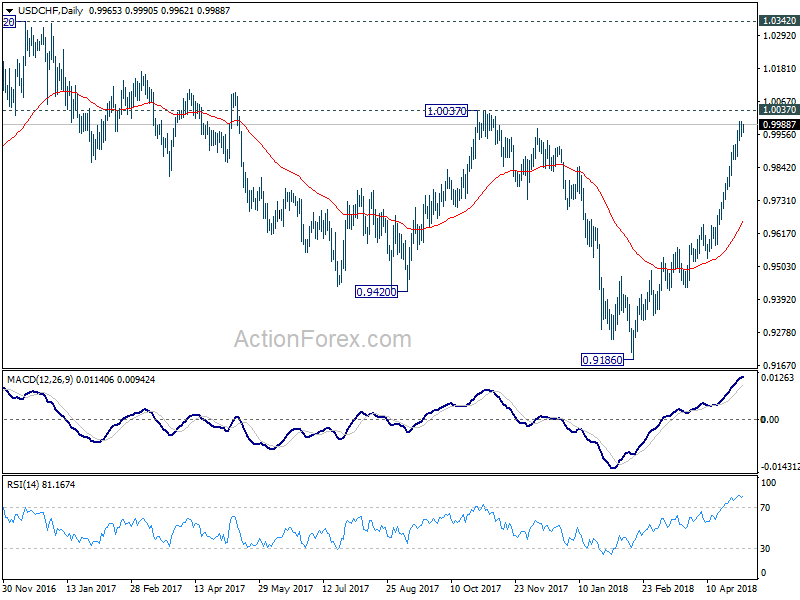
USD/CHF continues to lose upside momentum as seen in 4 hour MACD. But there is no sign of a pull back yet. Hence, intraday bias remains on the upside for 1.0037 resistance. Decisive break there will extend the whole rally from 0.9186 towards 1.0342 key resistance On the downside, though, below 0.9937 minor support will indicate short term topping. And, in that case, deeper retreat could be seen to 4 hour 55 EMA (now at 0.9886) or below before staging another rise.
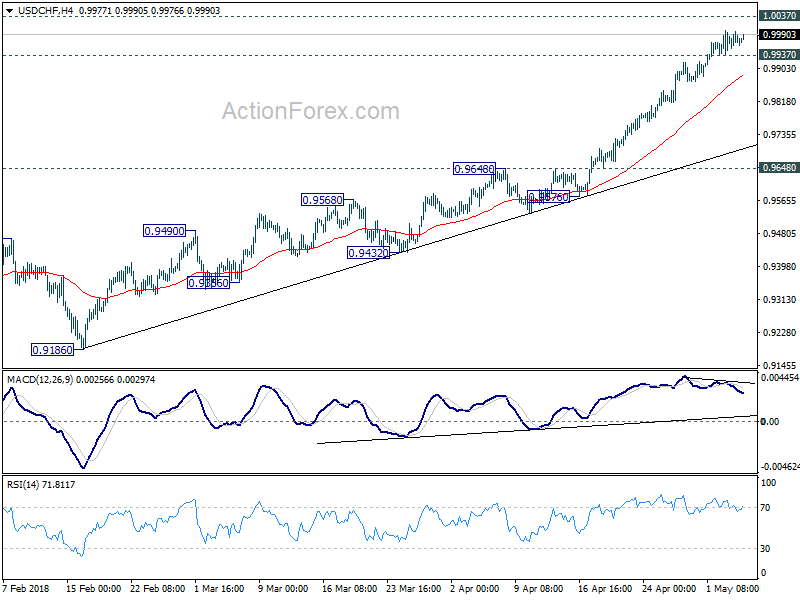
In the bigger picture, medium term decline from 1.0342 has completed with three waves down to 0.9186. Rise from there is currently viewed as a leg inside the long term range pattern. Hence, while further rally would be seen, we'd be cautious on strong resistance from 1.0342 to limit upside. For now, further rise is expected as long as 0.9648 resistance turned support holds, even in case of pull back.
USD/JPY Daily Outlook
Daily Pivots: (S1) 108.78; (P) 109.33; (R1) 109.74; More...
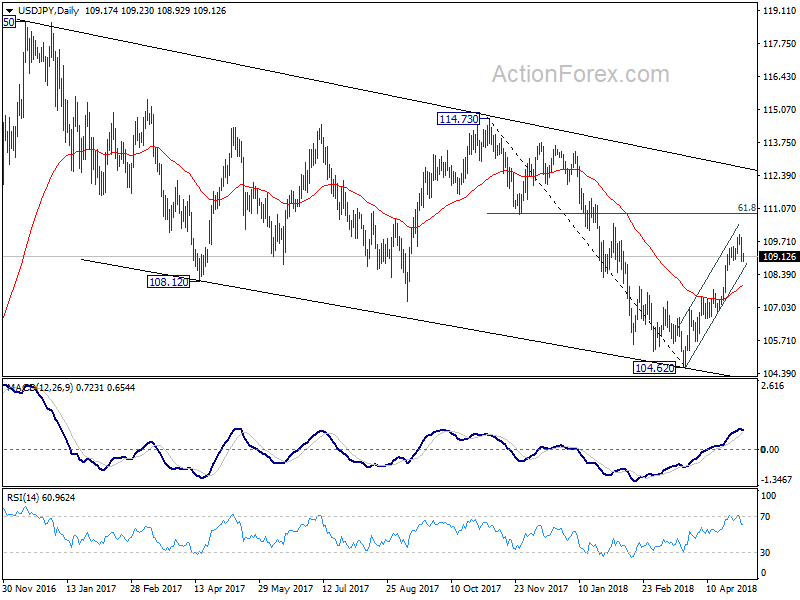
Intraday bias in USD/JPY remains mildly on the downside for the moment. Correction from 110.02 short term top could extend to near term channel support (now at 108.61) and possibly below. But we'd expect strong support from 38.2% retracement of 104.62 to 110.02 at 107.95 to contain downside and bring rebound. Break of 110.02 will resume the rise from 104.62 to t 61.8% retracement of 114.73 to 104.62 at 110.86 next.
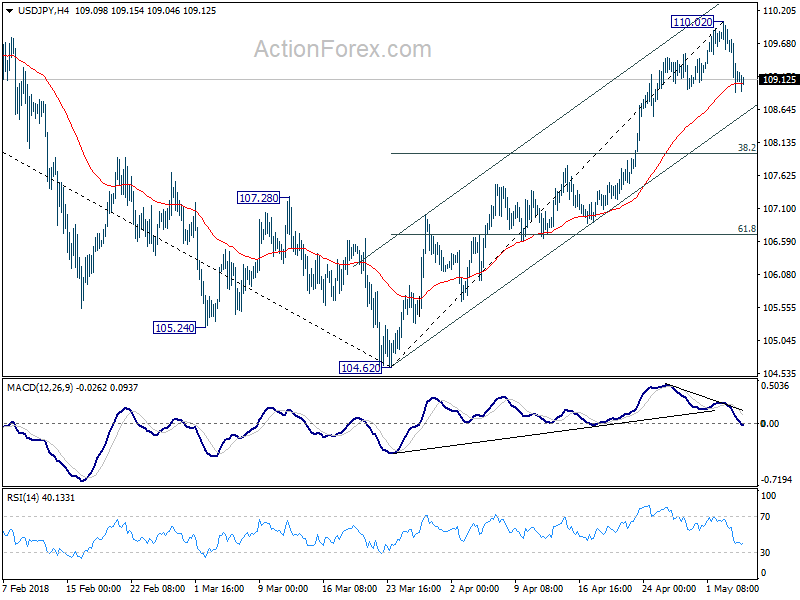
In the bigger picture, break of 108.12 support turned resistance now suggests that corrective fall from 118.65 (2016 high) has completed with three waves down to 104.62. And, rise from 98.97 (2016 low) could be resuming. Focus is back on 114.73 resistance and break there will pave the way to 118.65 and above. This will now be the preferred case as long as USD/JPY stays above 55 day EMA (now at 107.97).
USD/CAD Daily Outlook
Daily Pivots: (S1) 1.2827; (P) 1.2857; (R1) 1.2912; More....
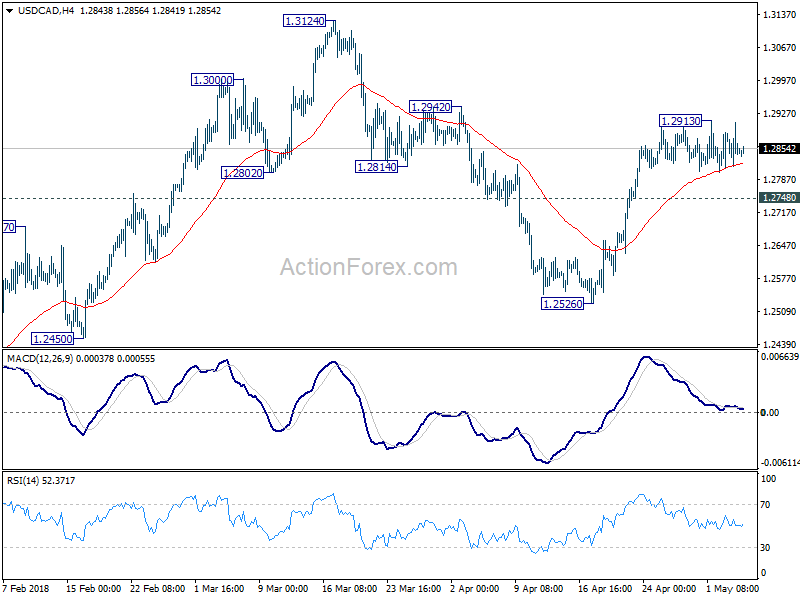
USD/CAD is still bounded in range below 1.2913 temporary top and intraday bias remains neutral. More consolidation could be seen. But another rise is expected with 1.2748 minor support intact. On the upside, break of 1.2913 will resume the rise from 1.2526 and target 1.3124 high. However, break of 1.2748 will turn focus back to 1.2526 support instead.
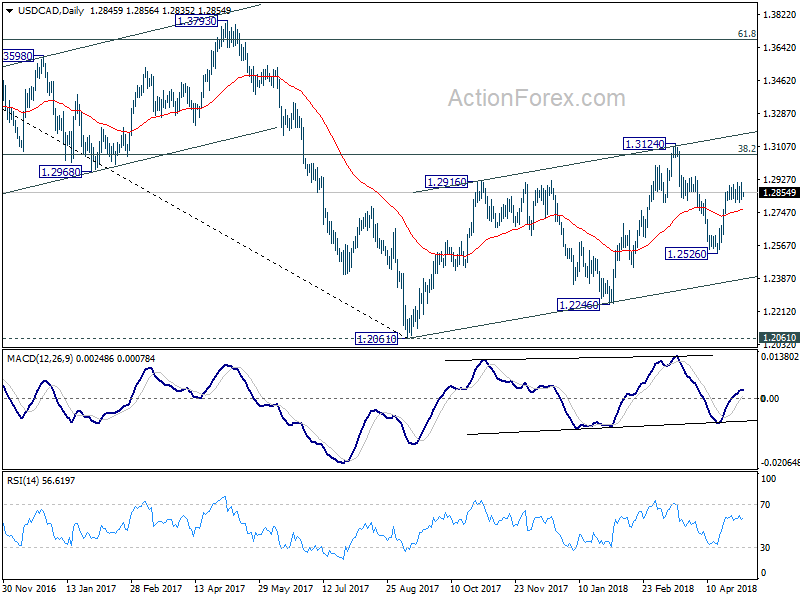
In the bigger picture, current development suggests that rebound from 1.2061 has not completed yet. Focus is back on 38.2% retracement of 1.4689 to 1.2061 at 1.3065. Sustained trading above there will confirm medium term bullish reversal. That is, down trend from 1.4689 has completed at 1.2061 already. In that case, next target will be 61.8% retracement at 1.3685.
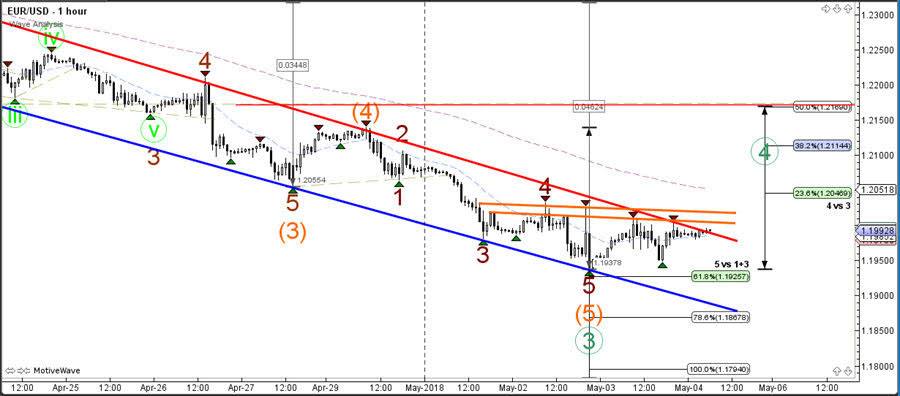
EUR/USD Bearish Channel Retesting Key 1.20 Resistance Zone
The EUR/USD is making a slight pause within the downtrend channel prior to the NFP news event later today. Price is now testing a key resistance zone of the channel and local resistance. A bullish breakout however will probably soon find new resistance spots at the Fibonacci levels of wave 4 (green).A bearish bounce could see price fall towards the Fibonacci targets of wave 3 (blue) whereas a bullish breakout above the 50% Fib could put the downtrend into question.
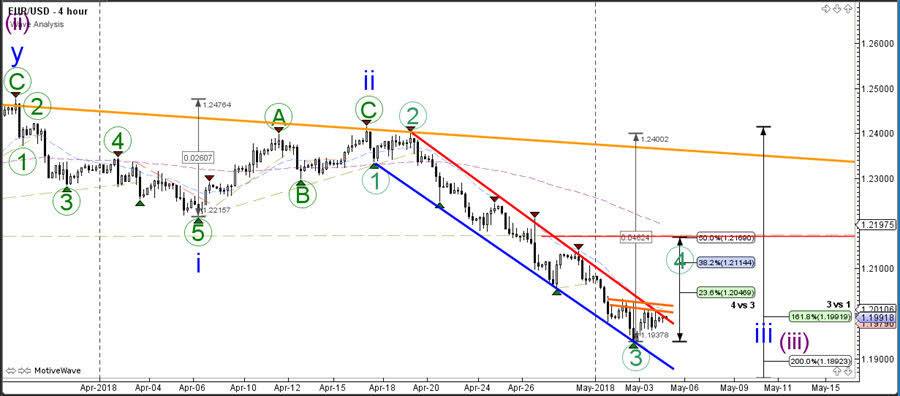
The EUR/USDis hitting multiple resistance levels, which is a new bounce or break spot. Depending on how the NFP event develops, price will either continue with the downtrend or build a larger correction.
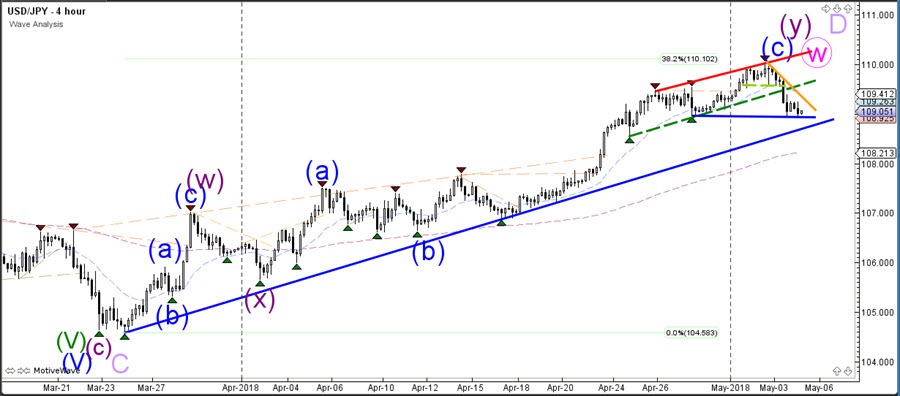
USD/JPY Shows Bearish Bounce At 110 Resistance Zone
The USD/JPY made a stronger bearish bounce at the 110 round level and 38.2% Fibonacci level of potential wave D (light purple). The bearish price action could lead to a larger bearish correction for wave X (pink) but price would need to break below the support trend lines (blue) and remain below the 110 resistance spot. A break below 109 could see price fall towards 108 and 107.50 support levels.
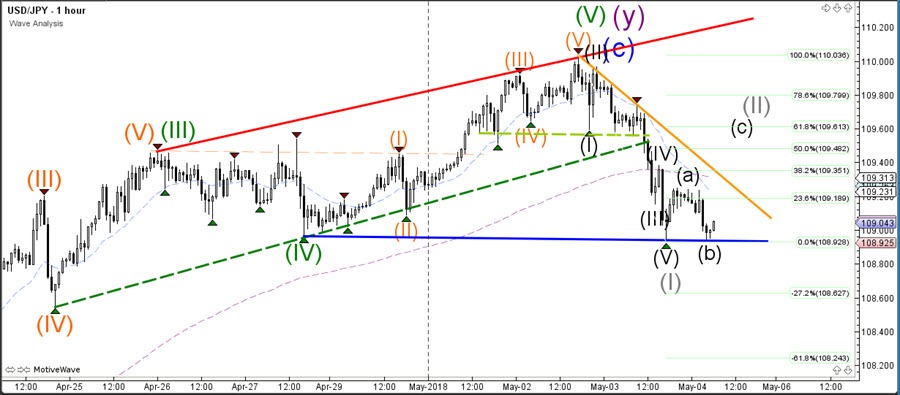
The USD/JPY is vulnerable due to the NFP event but for the moment it seems likely that price is building a wave 1-2 (grey) pattern. If that is true then price must stay below the origin (top) of wave 1 which is the 100% Fibonacci level.
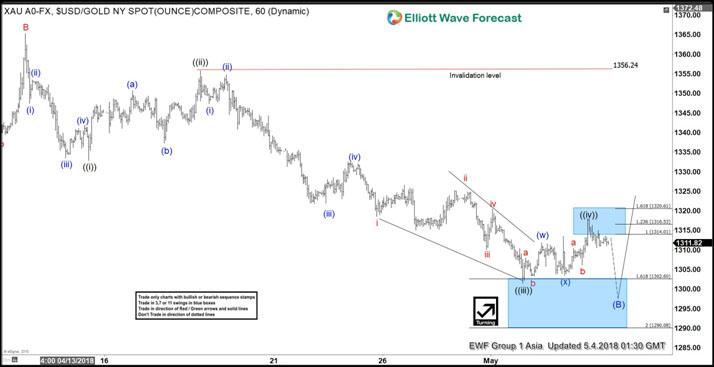
Elliott Wave View: Gold Remains In Range Waiting For Breakout
Gold short-term Elliott Wave view suggests that the rally to 4/11 high at 1365.24 ended Minor wave B. Below from there, the decline is unfolding as an impulse Elliott wave structure in Minor wave C of (B) lower. This structure forms a bigger FLAT Elliott Wave structure which starts from 1/25 peak. Internals of each leg to the downside, i.e. wave ((i)), ((iii)), and ((v)), shows a 5 waves structure subdivision in the lesser degree with extension in the third wave.
Down from 1365.24 high, Minute wave ((i)) of C ended in 5 waves at 1332.78. Minute wave ((ii)) of C ended as a Zigzag Elliott Wave structure at 1356.24. Minute wave ((iii)) of C ended in another 5 waves structure at 1301.5 low. Above from there, the bounce in Minute wave ((iv)) of C appears complete as a double three Elliott Wave structure at yesterday’s high at 1318.1. However, a break below 1301.5 low remains to be seen to confirm the next leg lower in Minute wave ((iv)) of C bounce. Until then, a double correction higher in Minute wave ((iv)) bounce can’t be ruled out.
The entire FLAT structure from 1/25 peak has reached 100% target at 1302.1, thus the cycle is mature and Intermediate (B) could end any moment. However, near-term, while bounces fail below 1318.1 high and more importantly the pivot from 1356.24 high stays intact, gold has scope to see another push lower. Potential target for Minute wave ((v)) of C, if it happens, comes at 1295.55 – 1297.92 which is the 1.236%-1.382% inverse Fibonacci extension of a Minute wave ((iv)). Afterwards, the metal is expected to resume the upside or should produce a bounce in 3 swings at least. We don’t like selling it.
Gold 1 Hour Elliott Wave Chart
Bond Yields Traded Lower
Market movers today
The data calendar today is rather thin in volume terms, but an important release comes from the US.
The US jobs report is due at 14:30 CET. As employment continues to rise, the main focus is on average hourly earnings, as many economists are st ill puzzled about why wage growth (and inflation) remains subdued, given that the labour market has tightened substantially. We estimate average hourly earnings rose 0.2% m/m in April, in line with the recent t rend, implying an unchanged annual growth rate of 2.7% y/y. We expect employment growth to rebound from the weak print of 103,000 in March to around 200,000 in April. We would not be surprised to see a decline in the unemployment rate from 4.1% to 4.0%, as employment growth remains higher than labour force growth.
In Sweden Service PMI and industrial orders are up for release, see page 2.
Selected market news
Stock markets continue to trade on the soft side with markets awaiting the labour market report today and the outcome of the US-China trade talks. Bond yields traded lower yesterday after Euro area inflation for April surprised to the downside with core inflation falling to 0.7% y/y (expected 0.9%), see Flash Comment: Easter effects weighing on Eurozone inflation in April, 3 May 2018.
The US-China trade talks in Beijing are proceeding today. So far little news has come out but US Treasury Secretary Stephen Mnuchin yesterday said US and China had ‘very good conversation on trade'. The US is probably presenting a list of demands from China, but it seems unlikely that everything will be resolved with this trip. US Trade Representative Robert Lighthizer yesterday said ‘We're going t o spend t he next year developing how we deal with each other' suggesting the talks is just the start of a longer process of solving the trade dispute.
The expected Bank of England hike next week may very well be delayed after UK service PMI for April disappointed yesterday. The index recovered only slightly (from 51.7 to 52.8, consensus 53.2) after a sharp drop in March. US ISM non-manufacturing also disappointed somewhat yesterday falling from 58.8 in March to 56.8 in April. It is still a high level but underlines that the cycle is losing a bit of momentum currently as also witnessed by the drop in ISM manufacturing on Tuesday.
Argentina yesterday lifted rates to 33.25% in a defence of a steep drop of the peso. The Turkish lira has also come under pressure and EM assets are trading soft in general.
Officials Upbeat On Economic Growth: RBA Monetary Policy Statement
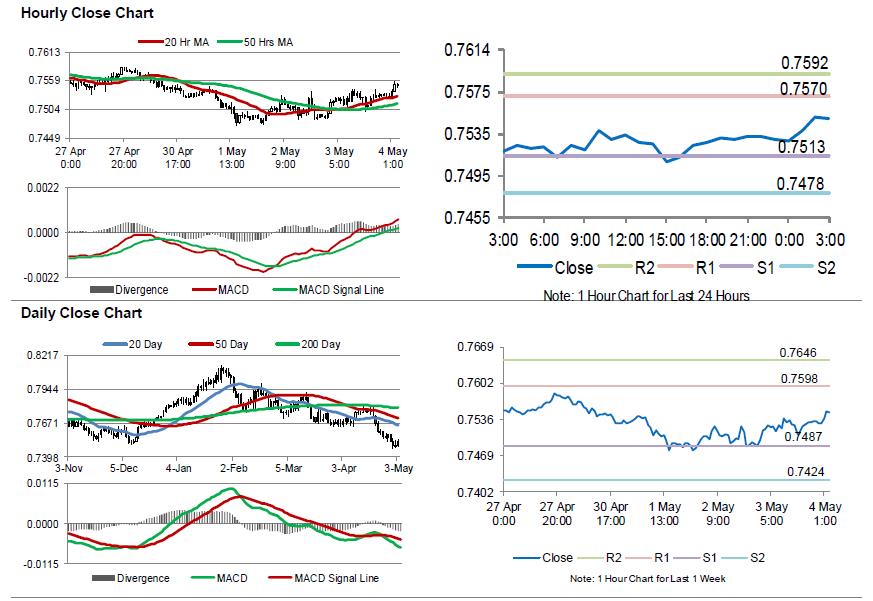
For the 24 hours to 23:00 GMT, the AUD rose 0.52% against the USD and closed at 0.7529.
LME Copper prices rose 0.77% or $52.0/MT to $6837.0/MT. Aluminium prices rose 3.53% or $80.0/MT to $2349.0/MT.
In the Asian session, at GMT0300, the pair is trading at 0.7549, with the AUD trading 0.27% higher against the USD from yesterday’s close.
Earlier today, the Reserve Bank of Australia (RBA), in its monetary policy statement, expressed confidence that economic growth in the resource-rich economy will accelerate this year and next but remained uncertain over the inflation outlook.
The central bank expects economic growth in Australia to hit 3.25% by the end of this year before surging to 3.55% by June 2019. However, the central bank expects doubts that inflation would reach 2.25% before June 2020.
Elsewhere in China, Australia’s largest trading partner, the Caixin/Markit services PMI recorded an unexpected rise to a level of 52.9 in April, defying market expectations for it to remain steady at a level of 52.3 in the previous month.
The pair is expected to find support at 0.7513, and a fall through could take it to the next support level of 0.7478. The pair is expected to find its first resistance at 0.7570, and a rise through could take it to the next resistance level of 0.7592.
Going ahead, traders would keep a close watch on Australia’s AiG performance of construction index and the NAB business confidence data, both for April, due to release on Monday.
The currency pair is trading above its 20 Hr and 50 Hr moving averages.
Euro-Zone’s Inflation Growth Slowed In April
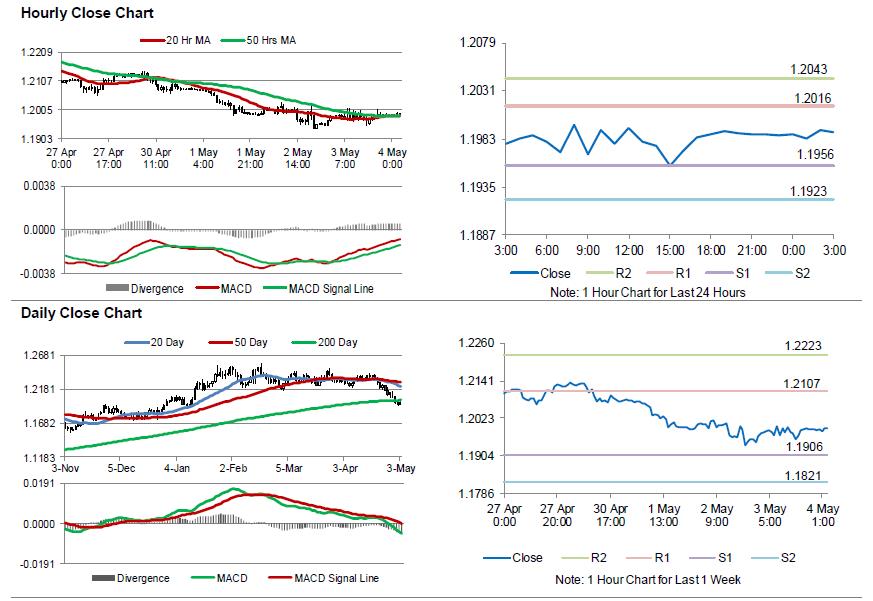
For the 24 hours to 23:00 GMT, the EUR rose 0.25% against the USD and closed at 1.1986, shrugging off weak inflation numbers from the Euro-zone.
The Euro-zone's preliminary consumer price index (CPI) advanced less-than-expected by 1.2% on an annual basis in April, after registering a rise of 1.3% in the prior month, thus threatening the European Central Bank's (ECB) plan to end its asset purchases programme this year and hike interest rates in 2019. Market participants had envisaged the CPI to advance 1.3%. Meanwhile, the region's producer price index (PPI) climbed 2.1% on an annual basis in March, meeting market expectations. The PPI had registered a rise of 1.6% in the previous month.
Separately, the European Commission, in its latest economic forecast report, projected that economic growth in the Euro-zone will moderate this year and next, after posting its fastest growth in a decade in 2017.
The Commission forecasted that economic expansion in the common currency region would slow to 2.3% this year, before slipping to 2.0% next year. Additionally, the Commission estimated that inflation in the Euro-bloc would accelerate to 1.5% this year and to 1.6% in 2019.
In the US, data indicated that trade deficit narrowed more-than-anticipated to $49.0 billion in March, hitting its lowest level since September 2017. The nation had registered a revised deficit of $57.7 billion in the prior month, while markets were expecting the nation to post a deficit of $50.0 billion. On the other hand, the nation's ISM non-manufacturing PMI dropped to a 4-month low level of 56.8 in April, compared to market expectations for a fall to a level of 58.0. In the prior month, the PMI had registered a level of 58.8. Meanwhile, the nation's final Markit services PMI was revised higher to a level of 54.6 in April, while the preliminary figures had indicated a rise to a level of 54.4. The PMI had recorded a level of 54.0 in the previous month.
In other economic news, final durable goods orders in the US grew 2.6% on a monthly basis in March, confirming the flash estimate and compared to a revised gain of 3.5% in the previous month. Also, the nation's factory orders climbed 1.6% MoM in March, beating market consensus for an increase of 1.4% and following a revised similar rise in the previous month. Meanwhile, the number of Americans filing for fresh jobless claims climbed to a level of 211.0K in the week ended 28 April, undershooting market consensus for a rise to a level of 225.0K. In the previous week, initial jobless claims had recorded a level of 209.0K.
In the Asian session, at GMT0300, the pair is trading at 1.1990, with the EUR trading slightly higher against the USD from yesterday's close.
The pair is expected to find support at 1.1956, and a fall through could take it to the next support level of 1.1923. The pair is expected to find its first resistance at 1.2016, and a rise through could take it to the next resistance level of 1.2043.
Moving ahead, traders would keep a close watch on the final Markit services PMIs data for April, scheduled to release across the Euro-zone in a few hours. Additionally, the Euro-zone's retail sales data for March, will also be on investors' radar. Later in the day, all eyes would be on crucial US non-farm payrolls, average hourly earnings and unemployment rate data, all for April.
The currency pair is showing convergence with its 20 Hr and 50 Hr moving averages.
UK’s Services Sector Growth Picked-Up Slightly In April
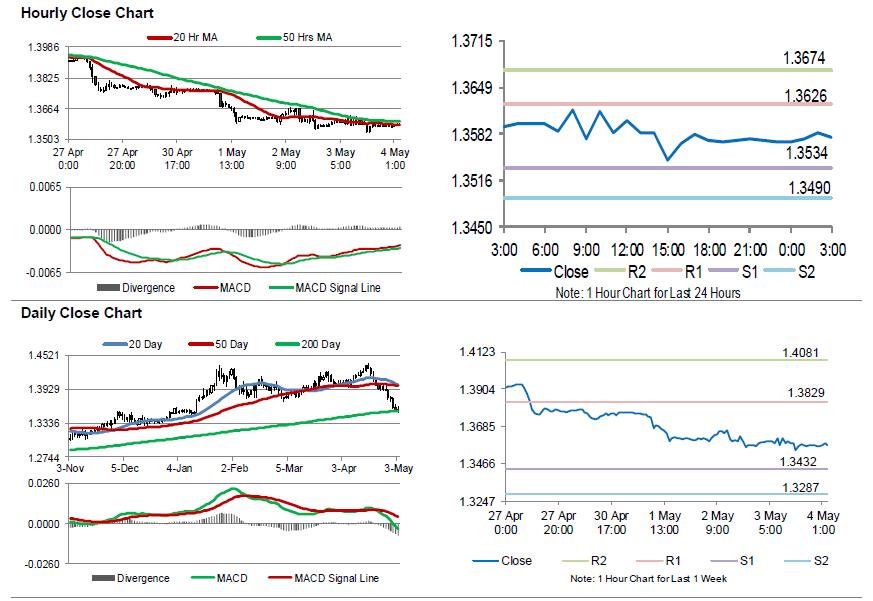
For the 24 hours to 23:00 GMT, the GBP marginally declined against the USD and closed at 1.3571.
In economic news, Britain's Markit services PMI advanced less-than-expected to a level of 52.8 in April, compared to market expectations for a rise to a level of 53.5. In the prior month, the PMI had recorded a 20-month low level of 51.7.
In the Asian session, at GMT0300, the pair is trading at 1.3578, with the GBP trading 0.05% higher against the USD from yesterday's close.
The pair is expected to find support at 1.3534, and a fall through could take it to the next support level of 1.349. The pair is expected to find its first resistance at 1.3626, and a rise through could take it to the next resistance level of 1.3674.
With no major macroeconomic releases in the UK today, investors would await the Bank of England's monetary policy meeting, due next week.
The currency pair is showing convergence with its 20 Hr moving average and trading below its 50 Hr moving average.