Sample Category Title
ISM services dropped to 56.8, respondants concerned of tariff uncertainty
ISM services dropped to 56.8 in April, down from 58.8 and missed expectation of 58.1. Employment component dropped -3 pts to 53.6.
It's noted in the release that "there was a slowing in the rate of growth that was mostly attributed to the decline in the Employment and Supplier Deliveries indexes." And, "the respondents have expressed concern regarding the uncertainty about tariffs and the effect on the cost of goods."
Some response quoted here:
- "The trade tensions are impacting purchasing of steel and are causing suppliers to send letters of concern regarding contracted purchases for this year and the future based on these proposed tariffs." (Construction)
- "Steel tariffs/232 have impacted our steel costs (pipes, fittings, valves, vessels [and the like])." (Mining)
- "Some indicators of rising transportation costs, which will eventually affect product prices. Trade tariffs will cause unintended consequences on all industries, affecting production and non-production commodities." (Professional, Scientific & Technical Services)
Canada’s Trade Deficit Widened to a Record $4.1 Billion in March
Canada's goods trade deficit widened to $4.1B in March (previously $2.9B). Imports rose 6.0% in the month, driven up by motor vehicle and parts and consumer goods. A widespread increase (+3.7%) was recorded in exports, led by aircraft and other transportation equipment. In real or volume terms, exports rose 3.0% while imports rose 5.3%.
After two consecutive months of increases, the import value of motor vehicle and parts has now more than made up the somewhat unexpected decline in January. The strong increase in consumer goods imports in March was broad-based across major product categories, with imports of clothing, footwear and textile products up a robust 16.2%.
The export value of aircraft and other transportation equipment has increased by more than 20% for two consecutive months now. This largely reflected a tripling of sales of boats and other personal transportation equipment to Saudi Arabia in March. In addition, sales of aircraft engines and parts to the U.S. rose 15.2% in the month.
Canada's merchandise trade surplus with the U.S. narrowed for the fifth consecutive month, falling to $1.7B (previously $2.3B), as higher oil exports were offset by greater imports of motor vehicles. Canada's trade deficit with the rest of the world widened to $5.8B (previously $5.2B), as imports increased 11.5% while exports rose 11.4%. Notably, imports from China rose 26.6% in the month, largely reflecting imports of computers and computer peripheral equipment and communications equipment.
Key Implications
Despite a strong recovery in export volumes in the last two months of the quarter, the weakness at the start of the year is sufficient to result in exports falling by about 0.4% (quarterly annualized rate) in the first quarter. With import growth of 5.1% (annualized) significantly outpacing export growth in the quarter, net trade is likely to be a material drag on first quarter Canadian economic growth.
Although a NAFTA agreement is looking closer to becoming reality, an agreement in principle is likely still weeks away. Nevertheless, we anticipate that improved momentum, stronger demand from the U.S., and a sub-80 US cent loonie should encourage a rebound in Canadian exports in the second quarter.
Canadian Dollar Dips as Trade Deficit Jumps
The Canadian dollar has posted losses in the Thursday session, erasing the gains seen on Wednesday. USD/CAD is trading at 1.2846, down 0.29% on the day. On the release front, Canada releases trade balance, with the trade deficit expected to narrow to C$2.3 billion. In the US, unemployment edged up to 211 thousand, easily beating the estimate of 225 thousand. Later in the day, ISM Non-Manufacturing is expected to drop to 58.1 points. On Friday, Canada releases Ivey PMI.
As expected, the Federal Reserve maintained the benchmark rate at a target of 1.5% to 1.75% on Wednesday. The rate statement was significant, with policymakers noting that “overall inflation has moved closer to 2 percent”. This was more hawkish than the March statement, in which the rate statement said that inflation indicators “have continued to run below 2 percent”. With inflation moving closer to the Fed target of 2 percent, there is a stronger likelihood that the Fed will upgrade its rate projection from three to four hikes in 2018. The odds of a fourth rate hike this year stand at 50%. The Fed rate statement also noted that “market-based measures of inflation compensation remain low”, a reference to soft wage growth, which is at 2.7%, lower than the 3% rate that the Fed would like to see.
US President Trump made waves when he imposed tariffs on steel and aluminum imports earlier in the year. However, Trump announced this week that he had extended exemptions on the tariffs for Canada and Mexico for another 30 days. The exemptions come at a sensitive time, with the US, Canada and Mexico neck deep in negotiations over a new NAFTA trade agreement. The talks have made significant progress, but the critical auto pact remains a stumbling block. It is likely that a tentative agreement will be hammered out, perhaps later this month. The Bank of Canada has dropped strong hints that it plans to raise interest rates later this year, but policymakers would like the NAFTA issue to be resolved before the next rate hike.
Canada’s Trade Deficit Hit New Record in March as Imports Surged
Highlights:
- Canada’s nominal trade deficit widened to an eye-catching -$4.14 billion in March — marking a new record high and up from the -$2.9 billion shortfall in February.
- Exports were up 3.7% overall and 3.1% excluding a large 14.7% bounce-back in agriculture exports after a plunge in February that was likely tied to rail transportation backlogs in western Canada.
- Imports surged 6.0% — and, in a positive sign for Canadian business investment, included higher imports of machinery and equipment.
Our Take:
The -$4.14 billion monthly trade deficit in March was much wider-than-expected and marked a new record high. The deficit is certainly eye-catching but the details look much less alarming in terms of underlying growth implications. The deterioration was entirely driven by a relatively broadly-based 6.0% surge in imports. A 3.7% jump in exports was also stronger-than-expected, and only partly because agricultural exports bounced back 14.7% after rail backlogs pushed shipments in the sector down 14% in February. Exports were still up 3.1% excluding agriculture to build on a 1.2% February rise.
Net trade still looks likely to subtract more than a percentage point from Q1 GDP growth but driven largely by higher imports. That argues underlying domestic demand remained relatively strong in Q1 — a view backed up by the continued solid performance of labour markets in 2018 to-date. With the March data, exports actually came in somewhat stronger than expected for Q1. Still down in volume terms but only slightly and despite transportation disruptions and earlier transitory shutdowns in the auto sector. We continue to expect overall GDP rose a ‘trend-like’ 1.8% in Q1/18. With the economy already at capacity, we expect further underlying improvement in the economic backdrop will ultimately be strong enough to warrant the further gradual withdrawal of still highly-stimulative conditions going forward.
GBP/JPY Mid-Day Outlook
Daily Pivots: (S1) 148.67; (P) 149.40; (R1) 149.79; More...
GBP/JPY's fall from 153.84 extends to as low as 148.37 so far. Intraday bias remains on the downside. firm break of 148.37 support will likely resume whole decline from 156.69 and target 143.51 fibonacci level. On the upside, above 149.45 minor resistance will turn intraday bias neutral and bring recovery. But upside should be limited well below 152.71 resistance to bring another decline.
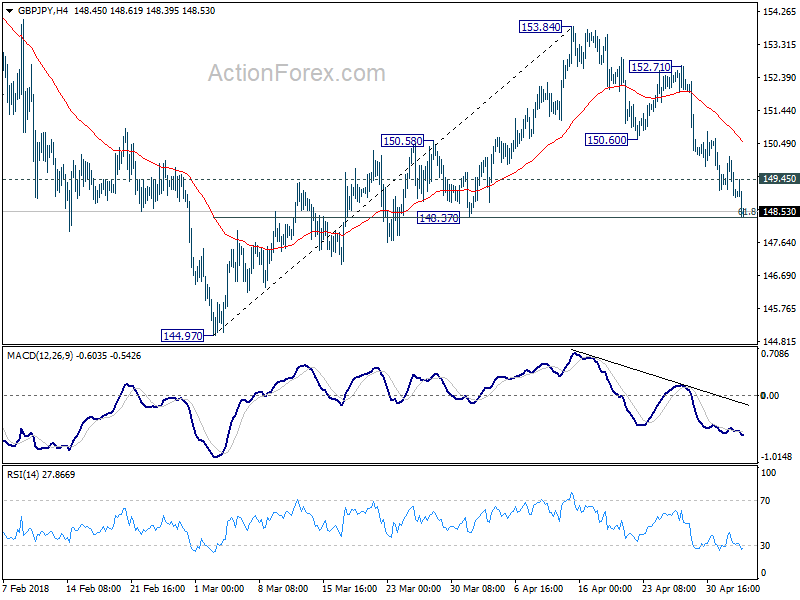
In the bigger picture, price actions from 156.59 are viewed as a corrective pattern. For now, we'd expect at least one more fall for 38.2% retracement of 122.36 to 156.59 at 143.51 before the consolidation completed. Though, firm break of 156.59 will resume whole up trend from 122.36 (2016 low) to 50% retracement of 195.86 (2015high) to 122.36 at 159.11 next.
EUR/JPY Mid-Day Outlook
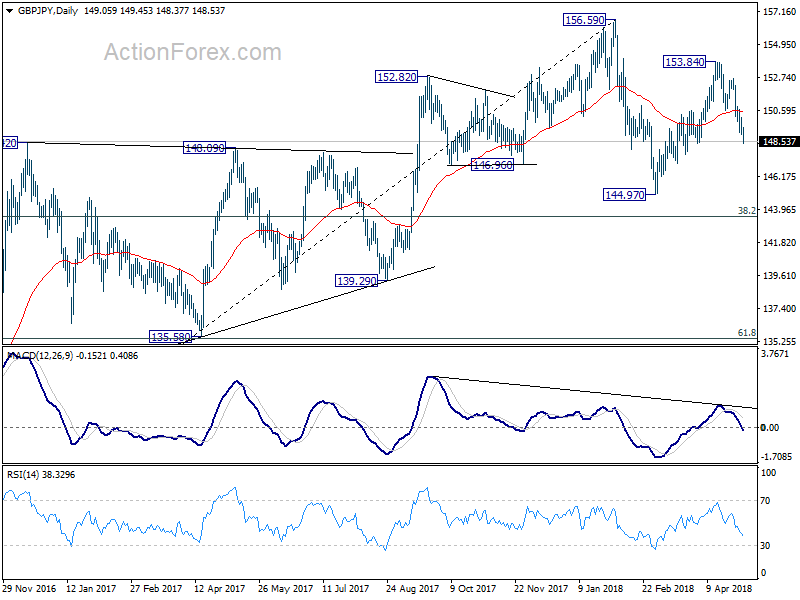
Daily Pivots: (S1) 130.99; (P) 131.55; (R1) 131.85; More....
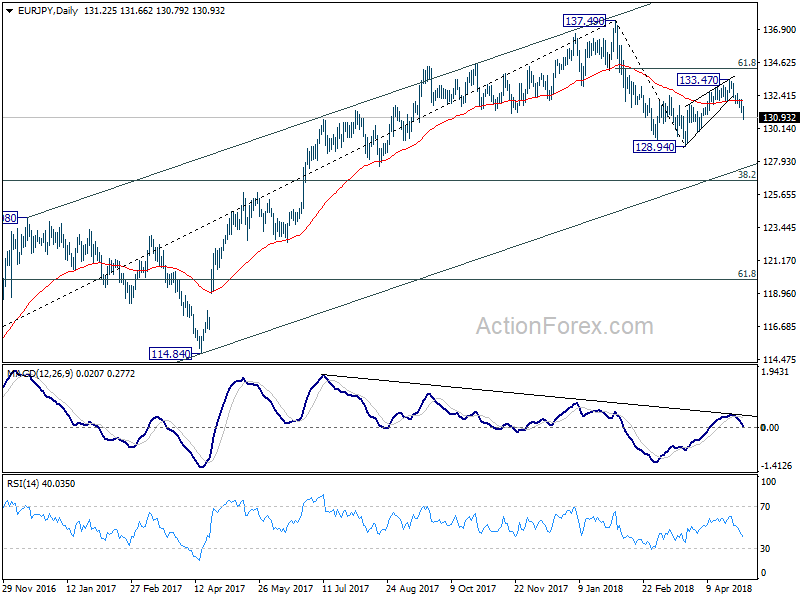
EUR/JPY's fall from 133.47 extends to as low as 130.79 so far today. Intraday bias remains on the downside for 128.94 low first. Break there will resume whole fall from 137.49 and target 126.61 fibonacci level next. On the upside, above 131.66 minor resistance will turn intraday bias neutral first. But recovery should be limited well below 133.47 resistance to bring another fall.
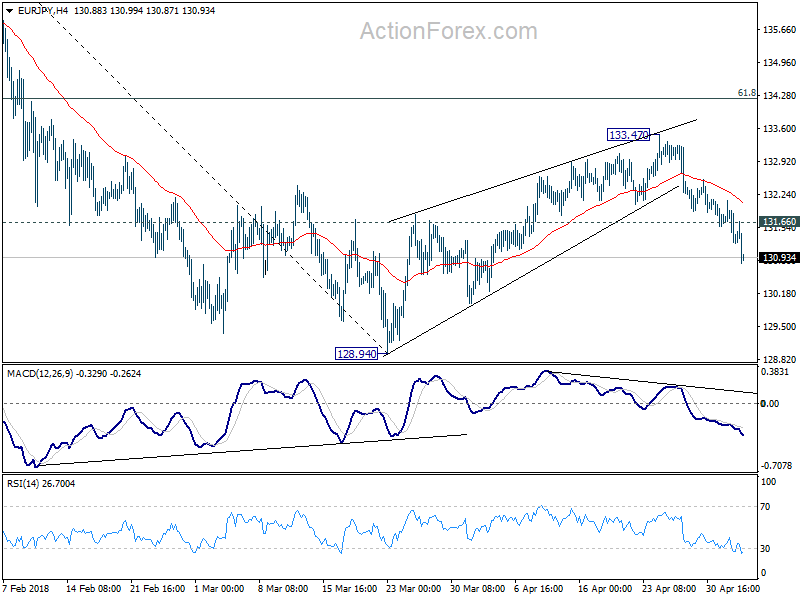
In the bigger picture, price action from 137.49 medium term top are developing into a corrective pattern. The first leg has completed at 128.94. The second leg might be finished at 133.47 or it might extend. But after all, we'd expect another decline through 128.94 to 38.2% retracement of 109.03 to 137.49 at 126.61 before completing the correction.
EUR/USD Mid-Day Outlook
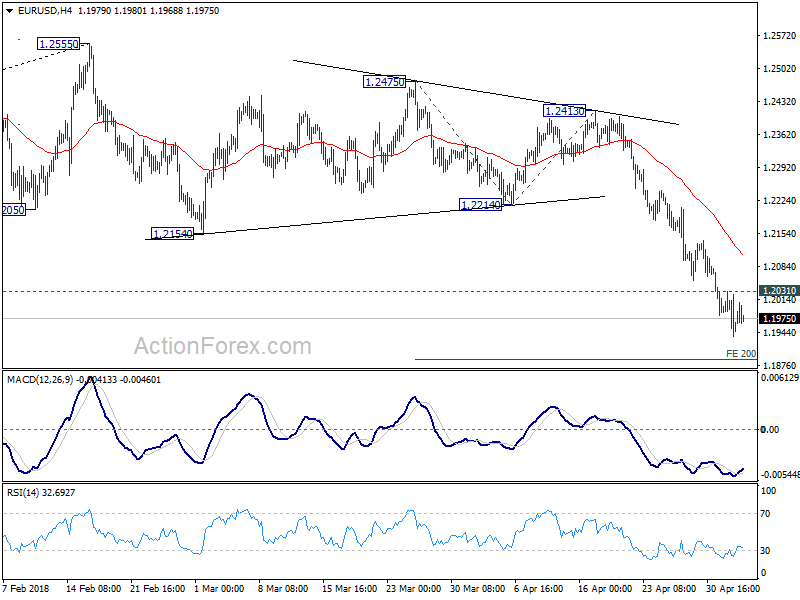
Daily Pivots: (S1) 1.1914; (P) 1.1973 (R1) 1.2008; More....
With 1.2031 minor resistance intact, intraday bias in EUR?USD stays on the downside. Current decline would target 200% projection of 1.2475 to 1.2214 from 1.2413 at 1.1891. Break will target 261.8% projection at 1.1730. On the upside, though, break of 1.2031 will indicate short term bottoming and bring lengthier consolidation before staging another fall.
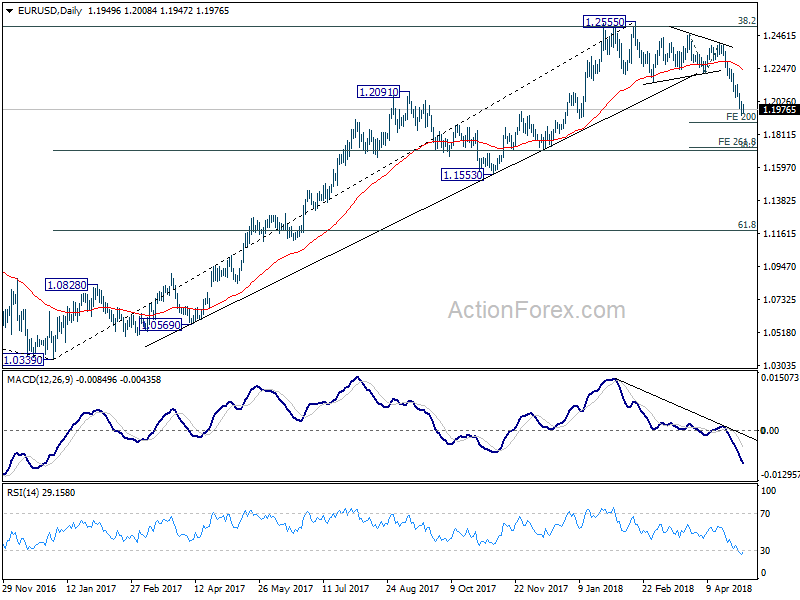
In the bigger picture, current decline and firm break of 1.2154 support confirms rejection by 38.2% retracement of 1.6039 (2008 high) to 1.0339 (2017 low) at 1.2516. A medium term top should be in place at 1.2555 and deeper decline would be seen back to 38.2% retracement of 1.0339 to 1.2555 at 1.1708 first. With current downside acceleration, there is prospect of hitting 61.8% retracement at 1.1186 before completing the decline. But still, we'll need to look at the structure to before deciding if it's a corrective or impulsive move.
GBP/USD Mid-Day Outlook
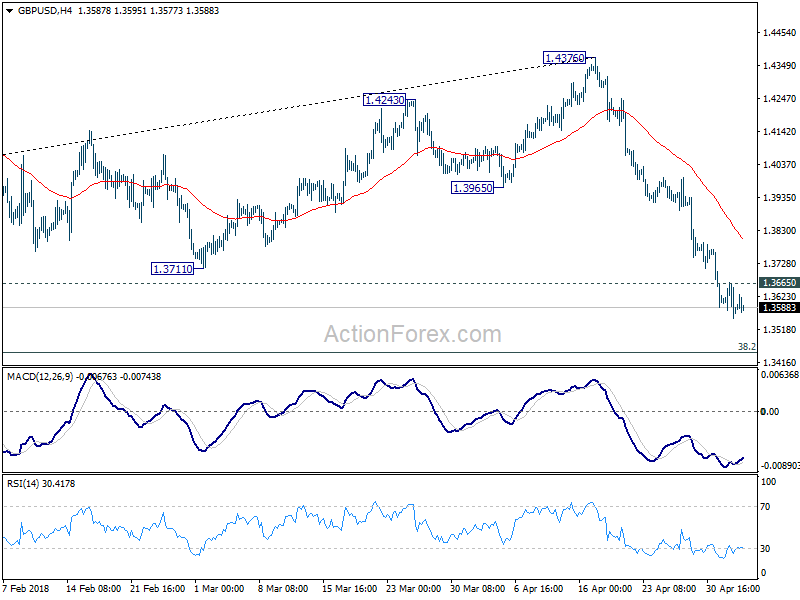
Daily Pivots: (S1) 1.3528; (P) 1.3597; (R1) 1.3639; More...
Downside momentum is a bit unconvincing as seen in 4 hour MACD. But with 1.3665 minor support intact, intraday bias stays on the downside for 1.3448 fibonacci level next. On the upside, above 1.3665 will argue that a short term bottom is formed. In that case, lengthier consolidation could be seen before another decline.
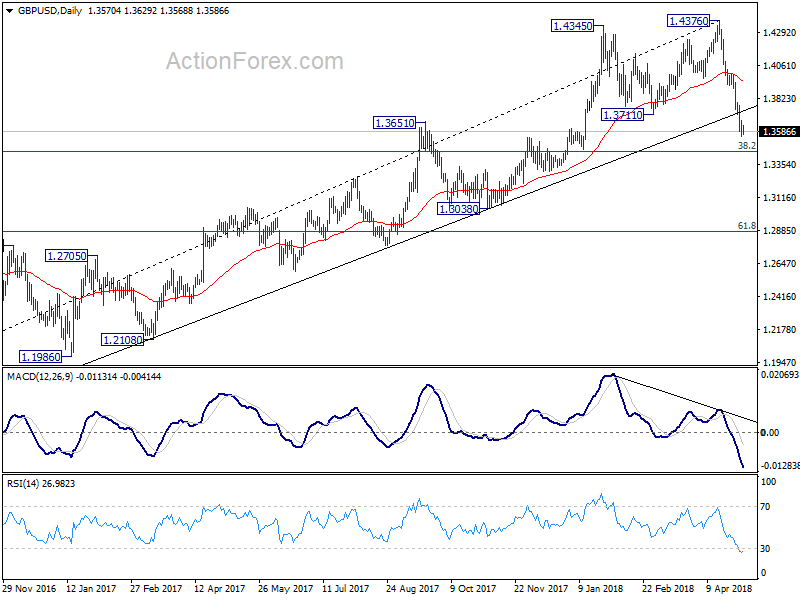
In the bigger picture, current development suggests that whole medium term rebound from 1.1936 (2016 low) has completed at 1.4376 already, with trend line broken, on bearish divergence condition in daily MACD, after rejection from 55 month EMA (now at 1.4248). Deeper decline should be seen to 38.2% retracement of 1.1936 (2016 low) to 1.4376 at 1.3448 first. Break will target 61.8% retracement at 1.2874 and below. Outlook will stay bearish as long as 55 day EMA (now at 1.3955) holds, even in case of strong rebound.
USD/CHF Mid-Day Outlook
Daily Pivots: (S1) 0.9952; (P) 0.9976; (R1) 1.0017; More...
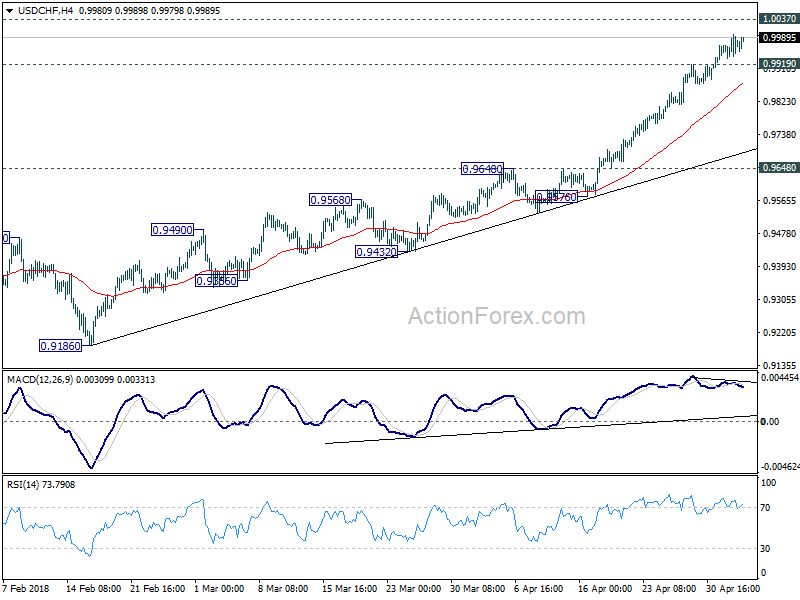
No change in USD/CHF's outlook. It continues to lose upside momentum as seen in 4 hour MACD. However, with 0.9919 minor support intact, intraday bias stays on the upside for 1.0037 resistance. Decisive break there will extend the whole rally from 0.9186 towards 1.0342 key resistance On the downside, though, below 0.9919 will indicate short term topping. And, in that case, lengthier consolidation would be seen before another rally.
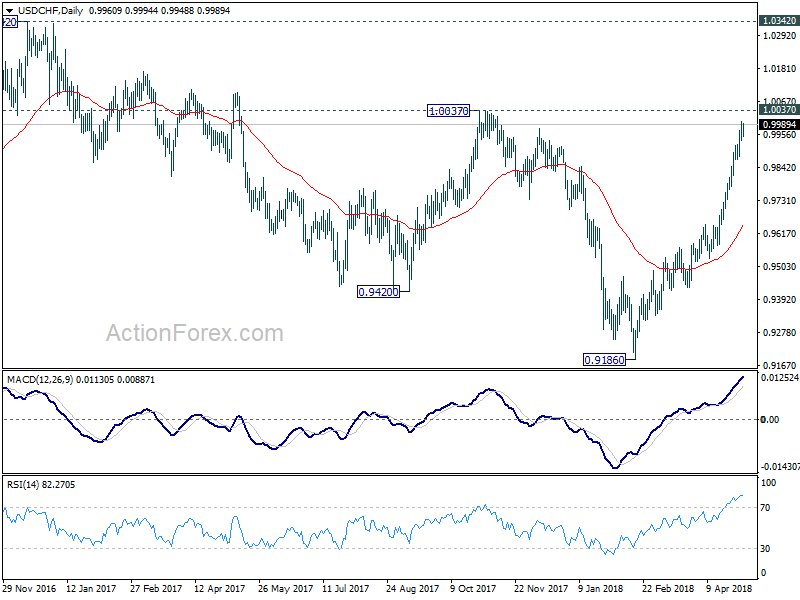
In the bigger picture, medium term decline from 1.0342 has completed with three waves down to 0.9186. Rise from there is currently viewed as a leg inside the long term range pattern. Hence, while further rally would be seen, we'd be cautious on strong resistance from 1.0342 to limit upside. For now, further rise is expected as long as 0.9648 resistance turned support holds, even in case of pull back.
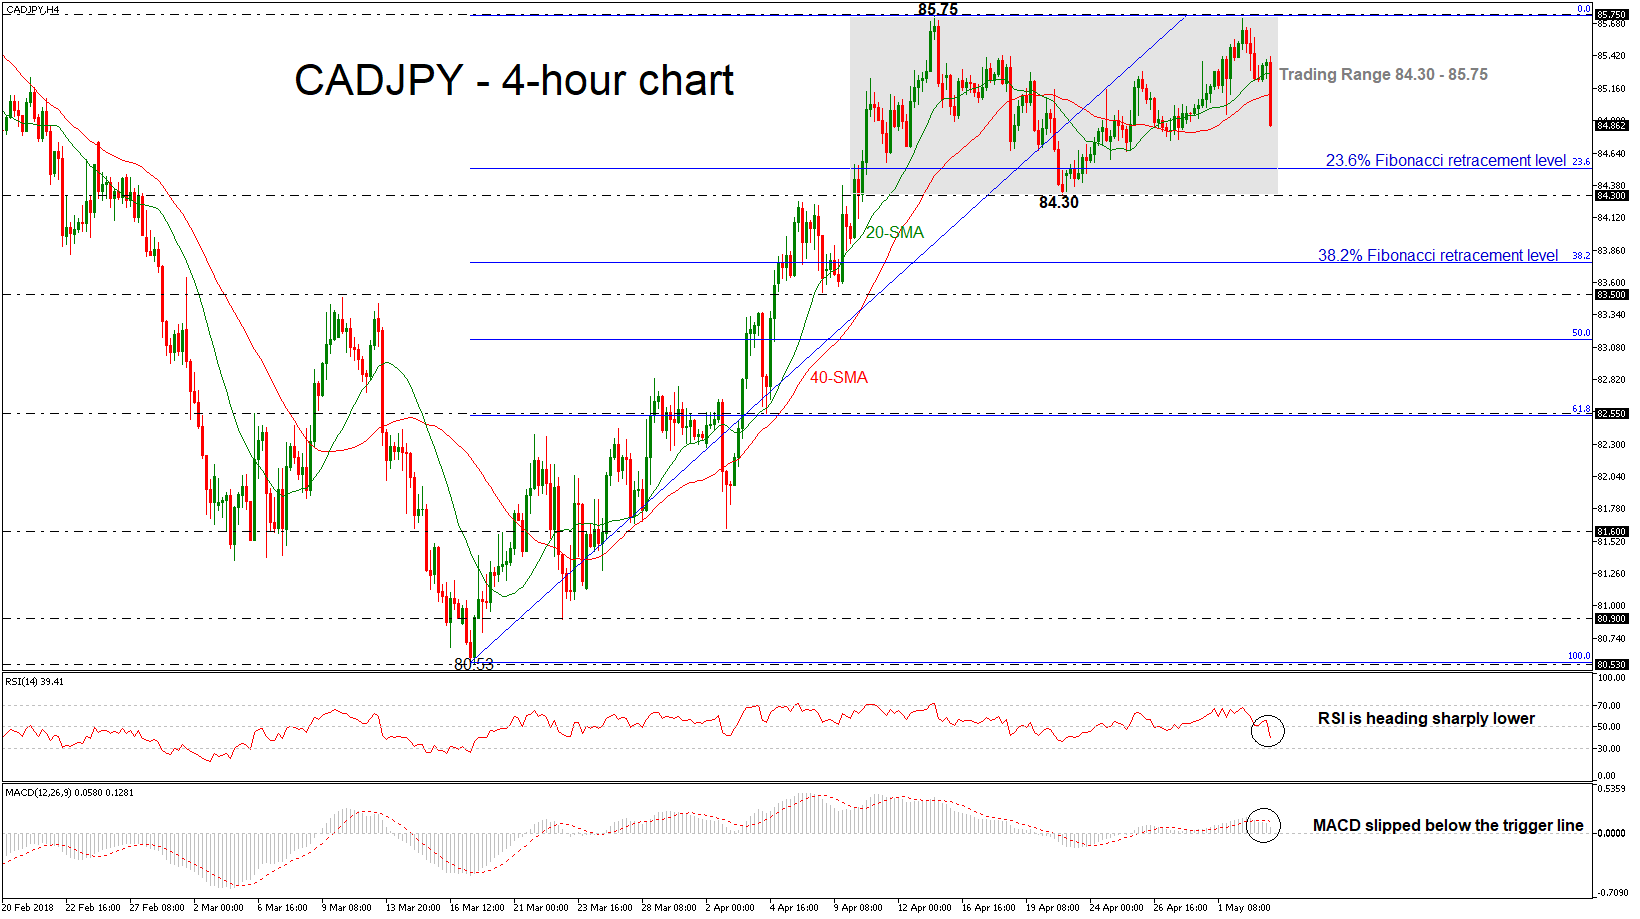
CADJPY Strong Negative Movement in Trading Range
CADJPY has plunged over the last couple of hours erasing some gains of the previous days. The pair has been struggling in a trading range since April 10 with upper boundary the 85.75 resistance level and lower boundary the 84.30 support barrier. During yesterday’s trading session the price bounced off the upper level and posted significant losses.
From the technical point of view, the short-term momentum indicators dived sharply. The RSI indicator plunged below the 50 level and is approaching the 30 area, indicating further losses. Also, the MACD oscillator dropped below the red-trigger line but is still holding in the positive zone.
Downside moves are likely to find support at the 23.6% Fibonacci retracement level of 84.51 of the upleg from 80.53 to 85.75. Falling below this area would re-challenge the lower boundary of the consolidation area of 84.30. A successfully close below this region would shift the neutral outlook to bearish and drive the pair towards 38.2% Fibonacci level of 83.76.
In the event of an upside reversal, the upper band of 85.75 is acting as strong resistance level for the price. In case of a break above it, the pair could manage to hit the 86.75 critical barrier taken from the low of November 28.