Sample Category Title
NZDUSD Eases Following Strong Bearish Rally, Broader Medium-Term Trend Negative
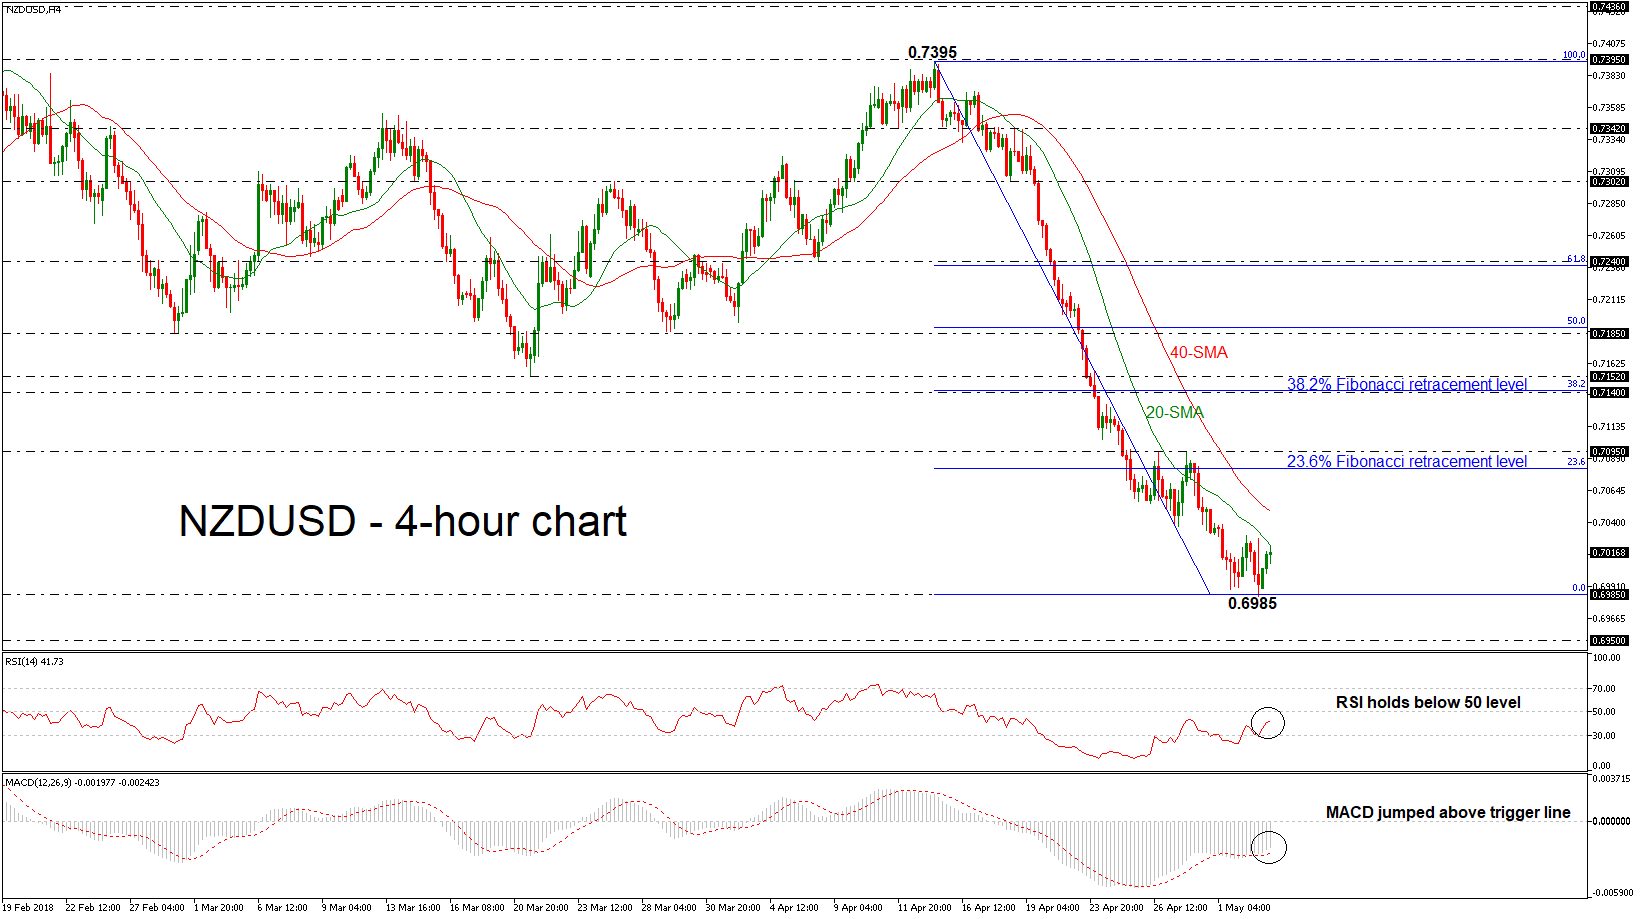
NZDUSD stalled its decline after a strong bearish rally over the previous two weeks. The pair is still trading below the 20- and 40-simple moving averages in the 4-hour chart but is has rebounded somewhat from the more than four-month low of 0.6985 hit earlier on Thursday.
The RSI has flattened below the 50 level, indicating that the market could be neutral in the short-term. However, the MACD oscillator supports a bullish picture, having moved above its red-trigger line.
Should the pair manage to strengthen its upward movement and jump above the moving averages at 0.7023 and 0.7048, the next resistance could come around 0.7095. A break above this level would shift the bias to a more bullish one and open the way towards the 0.7140 barrier, which overlaps with the 38.2% Fibonacci retracement level of the downleg from 0.7395 to 0.6895.
An alternative scenario is a resumption of the bearish structure and a retest of the previous multi-month low of 0.6985. A break below the aforementioned level could open the way towards the 0.6950 support, identified by the low on December 2017.
Forex Analysis: AUDUSD And EURCAD
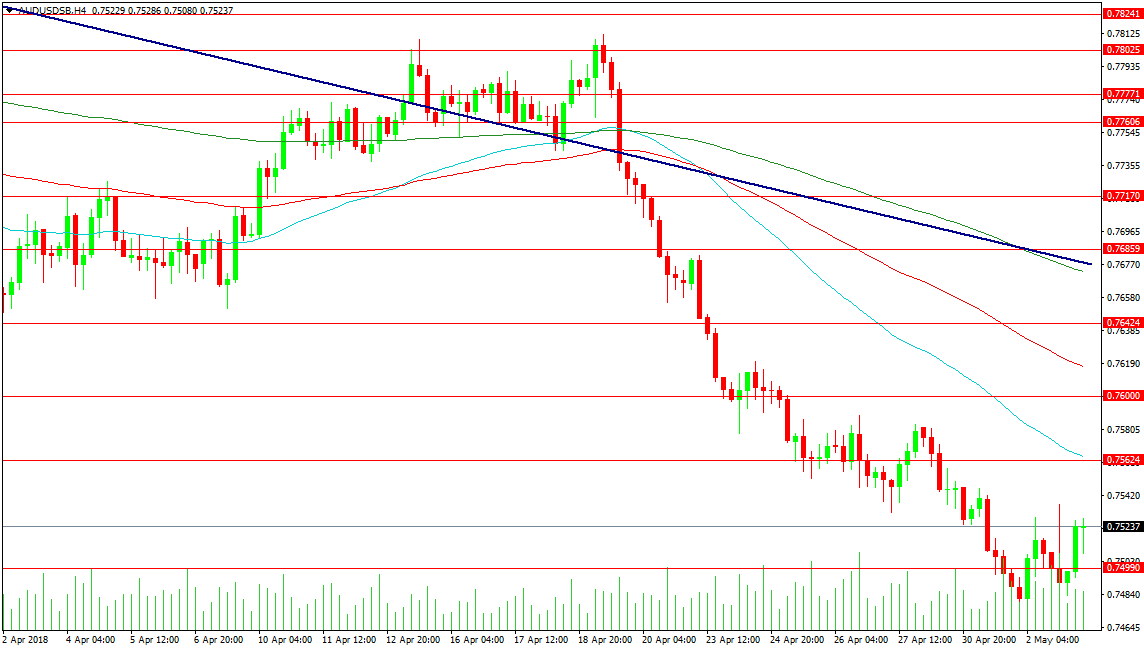
The AUDUSD has fallen to the 0.75000 level after its false breakout higher in the middle of April. Better economic data from Australia overnight has helped stem the fall, with the pair finding support at 0.74722 yesterday. A continuation of the trend lower targets 0.74000, followed by the 0.73450 level and 0.72860 in extension.
Resistance comes in at the FOMC high of 0.75367, followed by 0.75624 and the 50-period MA at 0.75648. The 0.76000 level became resistance last week and a move above this area targets the falling black trend line at 0.76770, which is strengthened by the 200-period MA at 0.76730, but the 100 MA at 0.76170 needs to be reached first. The 0.76530 level could also feature on any retracement higher.
EURCAD
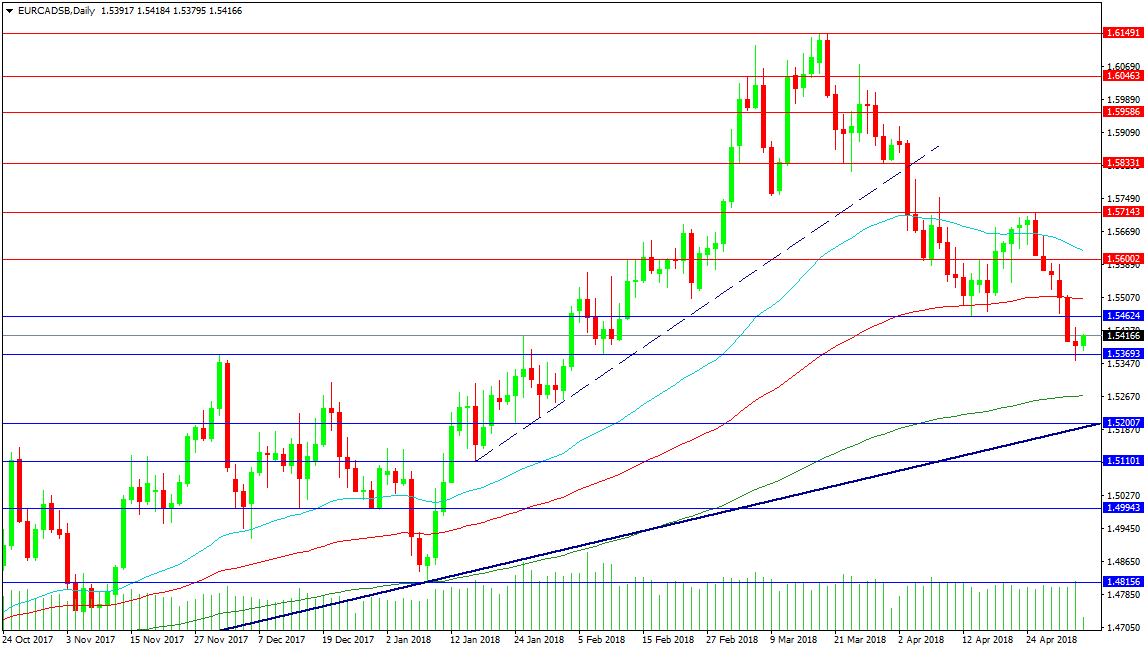
This pair is currently trading around the 1.54000 level after forming a Doji candle yesterday at the bottom of the recent down trend. The candle formed across the 2017 high and bullish traders will watch for a break above this candle’s top to enter long positions, in the hope it will continue the trend higher. This would need to break the 1.54624 level, followed by the 100 DMA at 1.55070. It would then target 1.56000 and the 50 DMA at 1.56214. A move over 1.57143 would break the sequence of lower highs and entice more long positions to open in the market.
The Doji candle may also fail and the price could fall under yesterday’s low, towards the 200 DMA at 1.52680. There is strong trend line support at the 1.52000 level. A break of this area firmly hands control over to bears, with initial targets at 1.50000 and 1.48156, followed by 1.47520 in extension.
U.S Dollar’s Deja Vu
Thursday May 3: Five things the markets are talking about
Global equities saw some pressure overnight as the market now shifts their focus away from the Fed and back to corporate earnings season and Sino/U.S trade talks.
Most G10 currency pairs have found firmer footing temporarily against the dollar, while the yield on U.S 10-year Treasuries fluctuated, trading within reach of its recent highs.
Today sees the start of trade talks between the U.S. and China and the markets are cautiously awaiting the outcome. Recent rhetoric suggests that both sides have dialled back their expectations on the outcome.
Note: The U.S has even suggested they could leave earlier if there is no traction in negotiations.
There were no surprises that the Fed kept rates on hold yesterday, a June hike is 100% price in by fed fund future. U.S policy makers admitted that inflation is “near target” without suggesting any need to accelerate its ‘gradual hiking path.'
Elsewhere, oil swung between gains and losses as traders weighed a rise in stockpiles against concern about U.S. sanctions on Iran.
On tap: U.S payroll is expected to have picked up stateside tomorrow (08:30 am EDT), with the unemployment rate expected to fall to +4%.
1. Stocks under pressure
Stocks in Europe and Asia mostly edged lower overnight following declines in the U.S Wednesday, as investors analysed the latest signals from the Fed and a new slate of earnings reports.
Note: Japanese markets will be closed on Thursday and Friday for public holidays.
Down-under, Aussie equities were noted outperformers as rising commodities prices helped the index get close to its best level of the year. Australia's S&P ASX added +0.8%.
In Hong Kong, the Hang Seng Index fell -1.3%, led lower by tech and real estate companies. Concerns about fresh U.S sanctions against Chinese telecom-equipment makers as well as renewed weakness in the HKD has sparked concerns about fund outflows.
In China, stocks rallied Thursday, aided by an afternoon rally in tech shares as a U.S trade delegation arrived in Beijing for key talks over tariffs and other issues. The blue-chip CSI300 index rose +0.8%, while the Shanghai Composite Index gained +0.7%.
In Europe, the insurance sector was among the biggest decliners, after a series of U.S. insurance giants reported results late yesterday.
U.S stocks are set to open in the ‘black' (+0.3%).
Indices: Stoxx600 -0.1% at 387.1, FTSE +0.1% at 7550, DAX +0.1% at 12792, CAC-40 -0.1% at 5523, IBEX-35 +0.1% at 10093, FTSE MIB -0.3% at 24206, SMI +0.1% at 8922, S&P 500 Futures +0.3%
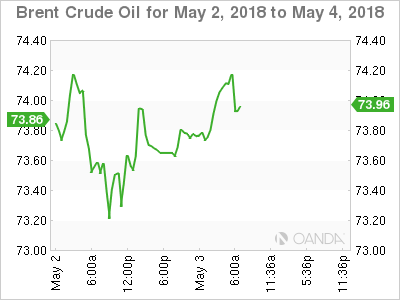
2. Oil prices dip on rising U.S. crude inventories, gold higher
Oil dipped overnight, weighed down by U.S crude inventories and record weekly U.S production that undermines OPEC's efforts to cut supplies. However, expect potential new U.S sanctions against Iran to keep markets on edge.
Brent crude oil futures are at +$73.31 per barrel, down -5c from their last close. U.S West Texas Intermediate (WTI) crude futures are down -1c at +$67.92 per barrel.
Pressuring prices is yesterday's EIA report showing U.S crude inventories increasing by +6.2m barrels to +435.96m in the week to April 27, the highest level in 2018.
And more U.S oil will likely flow as U.S drillers' added +5 oilrigs looking for new production in the week to April 27, according to Baker Hughes.
Limiting losses is the fact that U.S President Trump has until May 12 to decide whether to restore the sanctions on Iran that was lifted after an agreement over its disputed nuclear program.
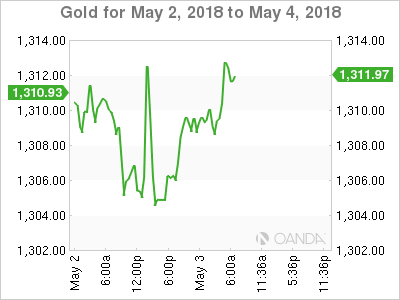
Ahead of the U.S open, gold prices have edged a tad higher for a second consecutive session overnight ahead of much awaited U.S/China trade talks, where a breakthrough deal is viewed as highly unlikely. Spot gold has rallied + 0.4% to +$1,309.51 per ounce, while U.S gold futures for June delivery rose +0.4% to +$1,310.4 per ounce.
3. Norway's Norges Bank confirms readiness to hike rates
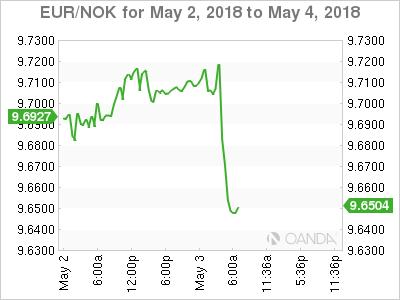
Norway's central bank left its key policy rate unchanged this morning, leaving the sight deposit rate at a record low of +0.5%. However, policy makers stated that, “the key policy rate would most likely be raised after summer 2018,” and this despite surprisingly muted inflation.
The upturn in the Norwegian economy appears to be “continuing broadly in line with” the picture presented at the policy meeting in March, the Norges Bank said.
Note: If the Norges Bank were to raise its key rate this year, it would likely do so ahead of the ECB – many don't expect them to hike until mid-2019.
Elsewhere, the Federal Open Market Committee (FOMC) left its target rate range unchanged at +1.50-1.75% (as expected) and indicated that inflation is near its goal. Any risks to the outlook appear roughly balanced – the Fed removed a prior reference to “near-term risks.
The yield on 10-year Treasuries has increased less than +1 bps to +2.97%. In Germany, the 10-year Bund yield gained +1 bps to +0.59%, while in the U.K, the 10-year Gilt yield increased +1 bps to +1.457%.
4. Dollar's Deja Vu
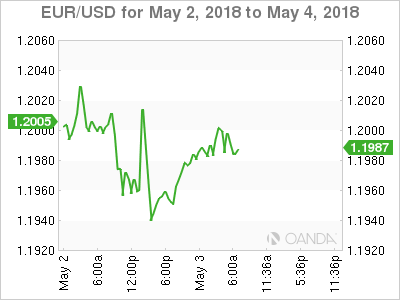
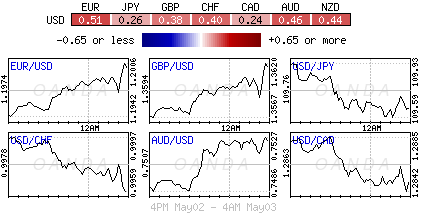
The USD has seen similar price action to yesterday as it saw its initial gains evaporate then recover in early U.S trade.
EUR/USD (€1.1992) is back below the key €1.20 level ahead of the N. America session after softer advance CPI data (see below). The data certainly reinforces the recent ECB cautiousness on growth and inflation.
GBP/USD (£1.3594) initially moved back above the pivotal £1.36 level, however, politics and weaker data is hindering any rally. U.K's April PMI Services missed expectations and continued to fuel speculation that the Q1 GDP miss was due to more than just weather. In politics, the U.K's government possible ‘customs union plan' with the E.U had been put under question, moving the Irish border issue back on top of the political agenda.
EUR/NOK has fallen to €9.6492 after Norges Bank decision this morning vs. €9.7140 beforehand (see above).
5. Europe continues to suffer from disappointing data
Data this morning shows that the eurozone's annual inflation rate fell unexpectedly in April. This is a setback for the ECB as it considers whether and when ending QE.
The E.U statistics agency said that consumer prices were +1.2% higher than in April 2017, a fall from the +1.3% rate of inflation recorded in March.
It noted that the core rate of inflation fell to +0.7% from +1% in March, hitting its lowest level in 13-months.
Note: The ECB halved its monthly bond purchases in January, encouraged by a pickup in economic growth and had hoped it would help raise inflation to its target of just below +2%.
ECB policy makers must now decide whether to extend the program beyond its tentatively scheduled end in September, and for how long.
Digging deeper, the drop in inflation has been driven mostly by a “sharp deceleration in prices paid for services.”
Euro Shrugs Off Soft Eurozone CPI
After three losing sessions, EUR/USD is in green territory in the Thursday session. Currently, the pair is trading at 1.1992, up 0.35% on the day. On the release front, Eurozone CPI Flash Estimate dropped to 1.2%, shy of the estimate of 1.3%. Core CPI Flash Estimate followed a similar trend, dipping to 0.7%, short of the forecast of 0.9%. In the US, there are two key indicators. Unemployment claims are expected to climb to 225 thousand, while ISM Non-Manufacturing is expected to drop to 58.1 points. On Friday, Germany and the eurozone releases Services PMI
Eurozone annual inflation is expected to dip to 1.2%, down from 1.3% in March, according to Eurostat. As well, Core annual inflation is forecast to edge lower to 0.9%, after three straight readings of 1.0%. These readings point to sluggish inflation, well short of the ECB target of around 2 percent. The weak inflation numbers are not surprising, as eurozone growth has softened in the first quarter. This is also reflected in manufacturing data, as German and eurozone manufacturing PMIs dropped for a fourth consecutive month.
As expected, the Federal Reserve maintained the benchmark rate at a target of 1.5% to 1.75% on Wednesday. The rate statement was significant, with policymakers noting that “overall inflation has moved closer to 2 percent”. This was more hawkish than the March statement, in which the rate statement said that inflation indicators “have continued to run below 2 percent”. With inflation moving closer to the Fed target of 2 percent, there is a stronger likelihood that the Fed will upgrade its rate projection from three to four hikes in 2018. The odds of a fourth rate hike this year stand at 50%. The Fed rate statement also noted that “market-based measures of inflation compensation remain low”, a reference to soft wage growth, which is at 2.7%, lower than the 3% rate that the Fed would like to see.
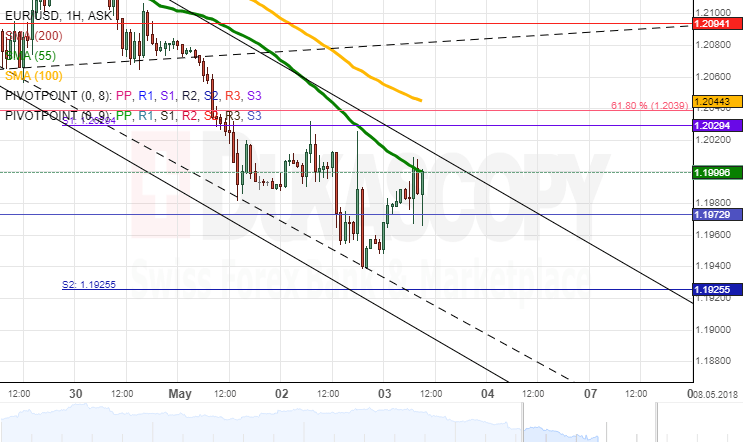
EUR/USD Analysis: Reaches 2018 Low
The common European currency still continues to weaken against the US Dollar for the second week.
The first part of Wednesday's trading session showed some signs of recovery due to allayed bearish pressure; however, the bulls were not strong enough to overcome the weekly S1, the 55-hour SMA and the 61.80% Fibonacci retracement near 1.2020. This cluster sent the pair even lower down to 1.1960 where a six-month resistance/support level and the 2018 low is located.
It is likely that the pair tries to re-test the aforementioned resistance area; this, however, will not be an easy task, as the 100-hour SMA is likewise situated nearby at 1.2050. Thus, no massive changes are expected to occur in the market today. The daily low is likely to be the monthly S2 at 1.1925 or the psychological 1.1900 mark.
GBP/USD Analysis: Falls To Strong Support
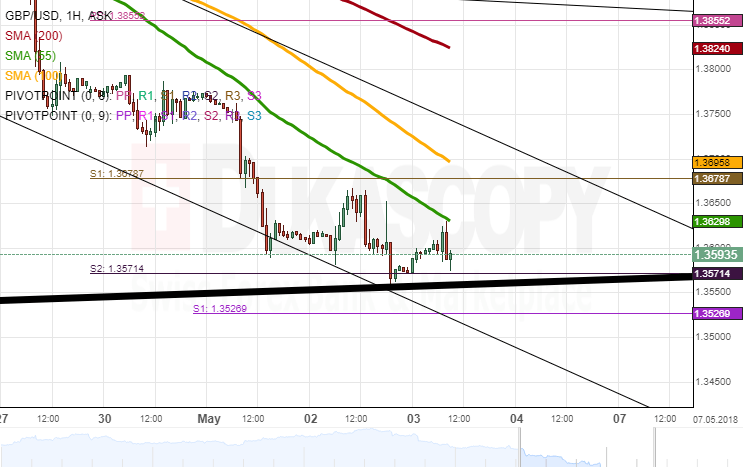
Some downside movement was still apparent in the market on Wednesday, as the Pound still tried to reach the bottom boundary of a seven-month channel and the weekly S2 near 1.3550. From the upside, it was pressured by the 55-hour SMA.
Nevertheless, yesterday's trading session demonstrated that the strong bearish momentum which had guided the pair for the three previous sessions was gone. Thus, it seems that bulls might finally be ready to push the pair away from the aforementioned long-term support. This upward movement should not be steep, as the 1.37 area is restricted by the 55– and 100-hour moving averages and the weekly S1.
In case no fundamentals disrupt this assumption, it is more likely that the pair consolidates today prior to picking up speed on Friday or early next week.
USD/JPY Analysis: Pushes Lower In Asian Session
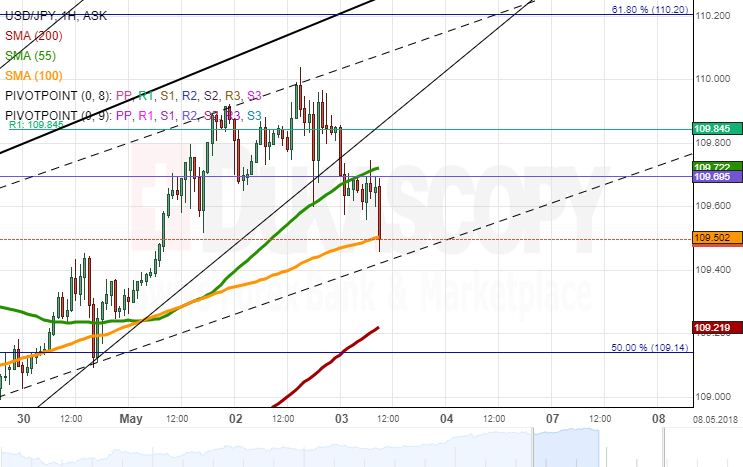
USD/JPY was trading along the upper boundary of a one-week channel up on Wednesday. The US Dollar managed to reach the 110.00 mark mid-session but was subsequently pushed lower. As a result, the pair breached a more senior ascending channel and the 55-hour SMA during the Asian session.
In case the current positioning below this moving average is maintained within the following hours, the Greenback should continue its bearish path either down to the 100– or 200-hour SMAs at 109.40 and 109.15, respectively.
Given that banks in Japan are closed in this session, the latter might not even be reached. Thus, the rate could remain stable and float between the weekly R1 and the 100-hour SMA in the 109.40/90 range.
Gold Analysis: More Bullish Today
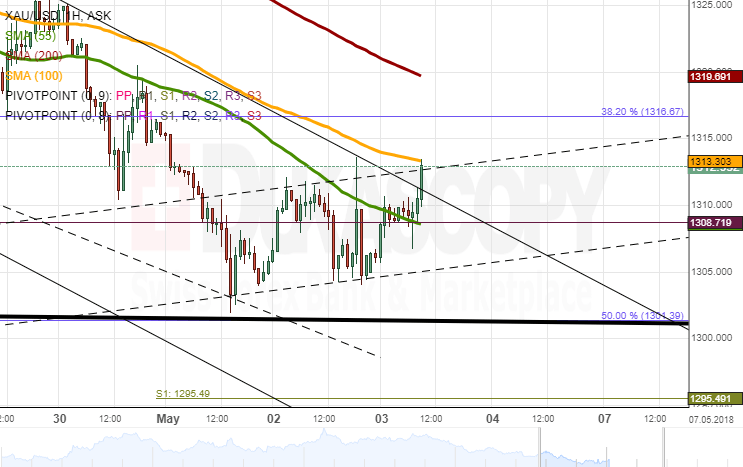
The bearish momentum which had guided the yellow metal during the past two days allayed on Wednesday, thus allowing XAU/USD to maintain a slight upward tendency. The pair nevertheless remained pressured by the 55-hour SMA which limited any gains above the 1,310.00 mark.
Technical indicators remain bearish for the following session, thus pointing to another decline. However, the senior channel and the 50.00% Fibonacci retracement near 1,300.00 are likely to provide strong support for the pair. In addition, bears might be reluctant to push Gold below this 2018 low.
In case the bullish sentiment prevails, there is enough upside potential until the 200-hour SMA at 1,320.00. But the two resistance levels located in between could bound the rate for a movement sideways circa 1,310.00.
NZD/JPY 1H Chart: Bearish Confirmation
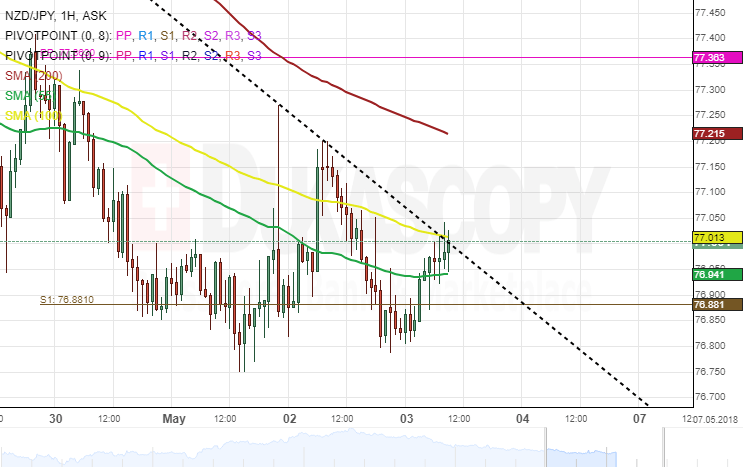
During the past three weeks, the New Zealand Dollar has depreciated substantially against the Japanese Yen. The NZD/JPY exchange rate is trading descending channels and has provided confirmations on both sides that the pair is likely to continue to decline further south.
The currency pair has been trading within the range of the weekly PP at 77.36 and the monthly S1 at 76.88 since April 29. A breakout could be expected through the upper boundary of a junior descending pattern today.
If the aforementioned breakout occurs, the price is likely to encounter a resistance set by the 200– hour simple moving average. Meanwhile, technical indicators flash sell signals. Therefore, a reverse from the up border of the junior pattern is a possibility within this session.
GBP/JPY 4H Chart: Bears To Grow Stronger
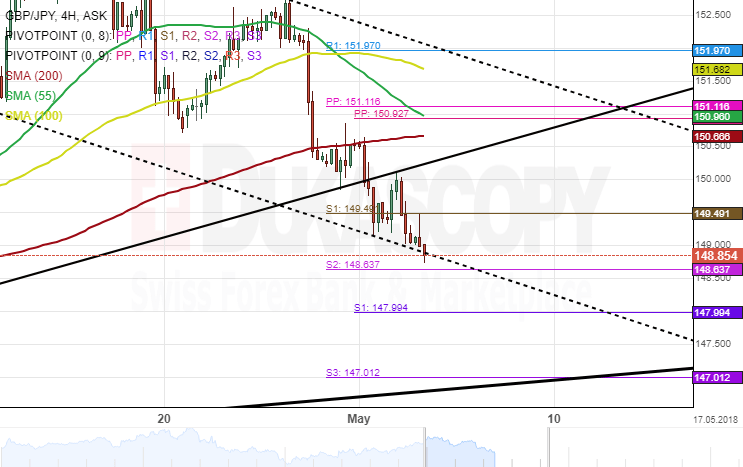
The British Pound has been constrained by several patterns against the Japanese Yen. The most important of which is a junior descending channel. Its upper boundary was reached on April 17 and has since remained moving along this pattern.
The currency pair has moved closer to the bottom border of the junior channel and could be set for a breakout. Furthermore, a resistance level set by the 200– hour simple moving average has pressurized the rate further south.
Everything being equal, the GBP/JPY currency exchange rate could plummet further during the following trading sessions. Meanwhile, technical indicators suggest bears is likely to grow stronger within the next trading days.