Sample Category Title
USD/CAD Weakening
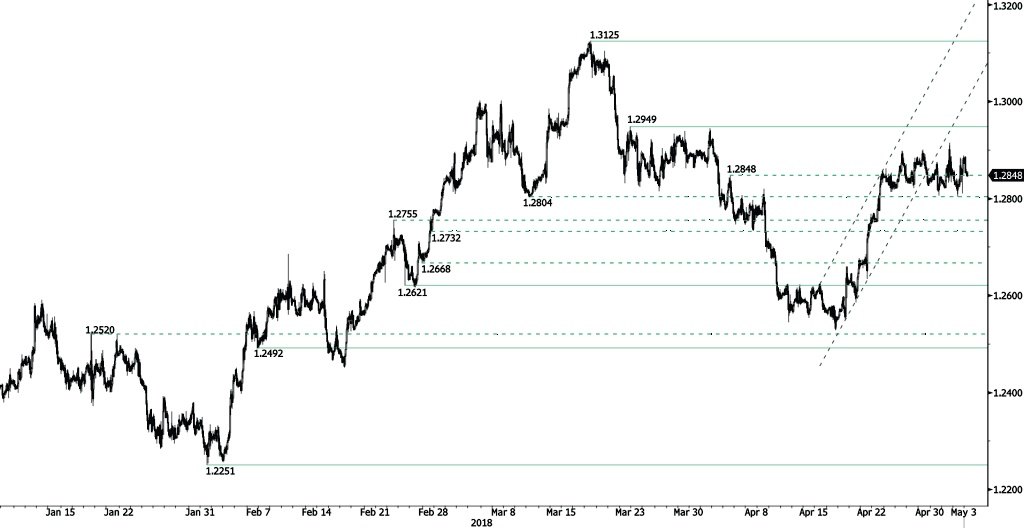
USD/CAD bullish trend stops, trading sideways since end-April. The pair is trading lower, heading along the 1.2840 range. Hourly support and resistance are given at 1.2621 (23/02/2018 low) and 1.2949 (22/03/2018 high). The technical structure suggests short-term downward moves.
In the longer term, the pair is trading between resistance point at 1.3805 (05/05/2017 high) and support at 1.2128 (18/06/2015 low). Strong resistance is given at 1.4690 (22/01/2016 high). The pair is likely to head lower. The pair is trading above its 200 DMA.
USD/CHF Failing To Break Resistance At 1
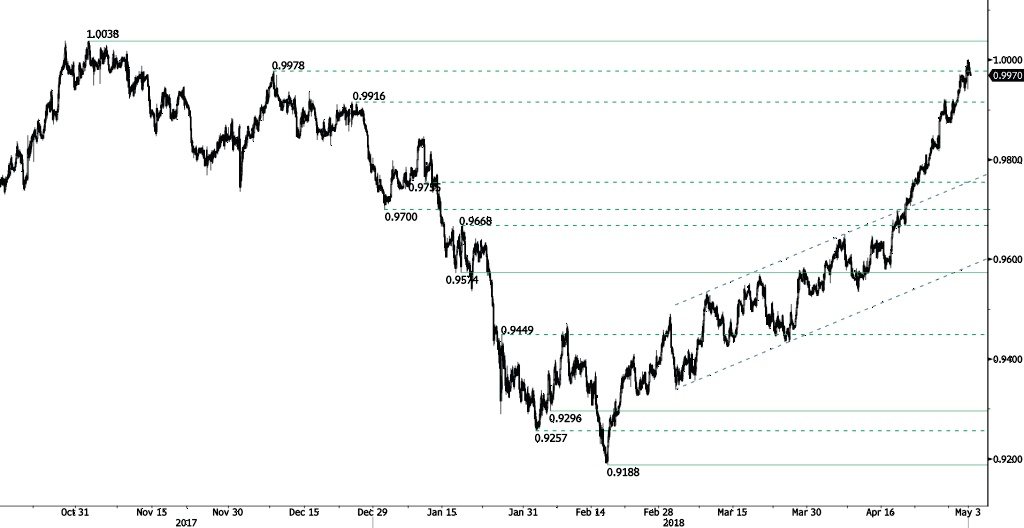
USD/CHF bullish pattern pauses after reaching 1. The pair is decreasing after breaking hourly resistance at 0.9978 (08/12/2018), heading along the 0.9965 range. The bullish pattern started from 0.9188 (16/02/2018 low) continues. The pair is contained between hourly support and resistance given at 0.9755 (10/01/2018 low) and 1.0038 (01/11/2017 high). The technical structure suggests short-term decrease.
In the long-term, the pair is still trading in range since 2011 despite some turmoil when the SNB unpegged the CHF. Key support lies at 0.9072 (07/05/2015 low) while resistance at 1.0344 (15/12/2016 high) is distanced. The technical structure favours a long term bullish bias since the unpeg in January 2015.
USD/JPY Decreasing
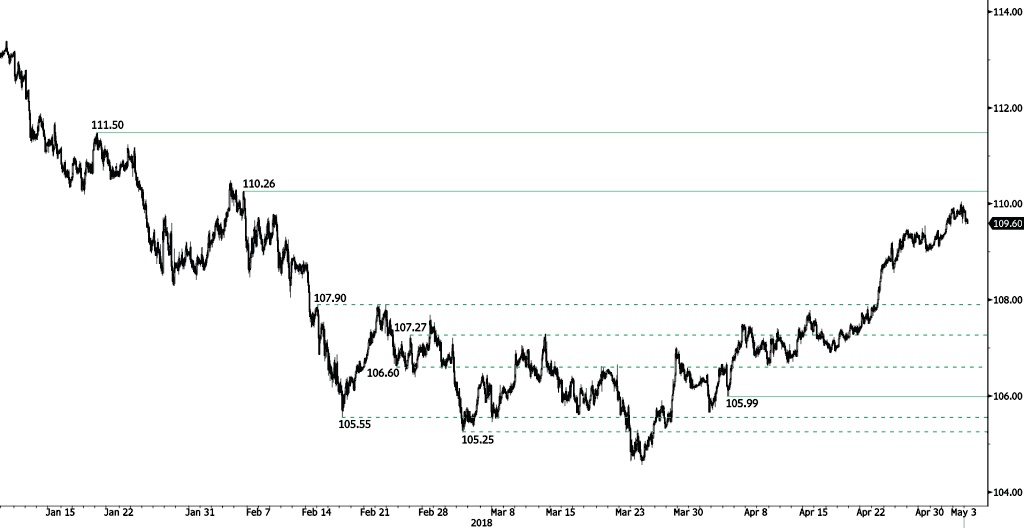
USD/JPY bullish pattern pauses, currently trading along 109.60 and approaching the 109.50 range. The bearish pattern started in January 2018 is weakening. Hourly support and resistance are given at 110.26 (05/02/2018 low) and 105.99 (04/04/2018 high). The short-term technical structure suggests short-term downward moves.
We favor a long-term bearish bias. Support remains at 101.20 (09/11/2016 low). A gradual rise toward the major resistance at 125.86 (05/06/2015 high) seems unlikely. Expected to decline further support at 101.20 (09/11/2016 low). The pair trades below its 200 DMA.
GBP/USD Trying To Bounce
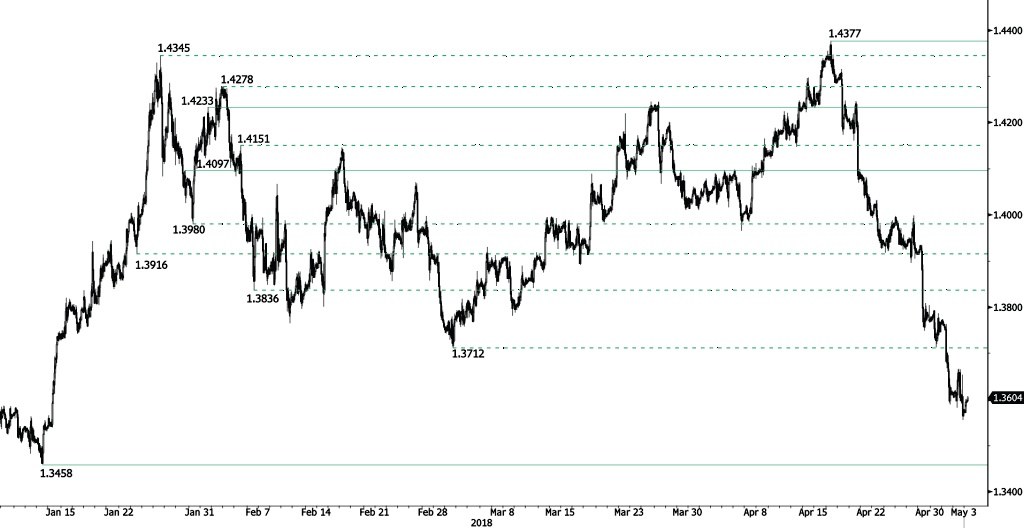
GBP/USD is trading above 1.36, bouncing off from 1.3555 low, heading along the 1.3610 range. The pair is currently trading at midJanuary low. Hourly support and resistance are given at 1.3458 (11/01/2018 low) and 1.4097 (29/01/2018 high). The technical structure suggests short-term increase.
The long-term technical pattern is reversing. The Brexit vote had paved the way for further decline but the pair is moving to 2016 highs. Long-term support and resistance are given at 1.1841 (07/10/2017 low) and 1.5018 (24/06/2016 high).
EUR/USD Approaching 1.20
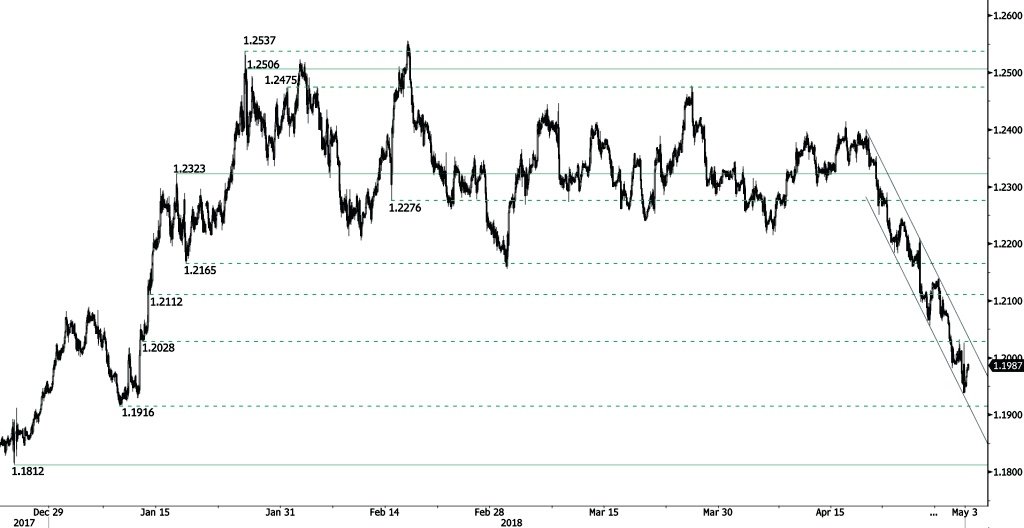
EUR/USD bearish pattern started from 1.24 (19/04/2018 high) pauses, the pair is bouncing off from 1.1938 low, heading along the 1.20 range. The pair is currently trading at midJanuary 2018 low. Hourly support and resistance are given at 1.1812 (25/12/2017 low) and 1.2323 (17/01/2018 high). The technical structure suggests short-term upward moves.
In the longer term, the momentum is turning largely positive. We favor a continued bullish bias. Key resistance is holding at 1.2886 (15/10/2014 high) while strong support lies at 1.1554 (08/11/2017 low).
USD/JPY Bounce Or Break Spot At Uptrend Channel Support
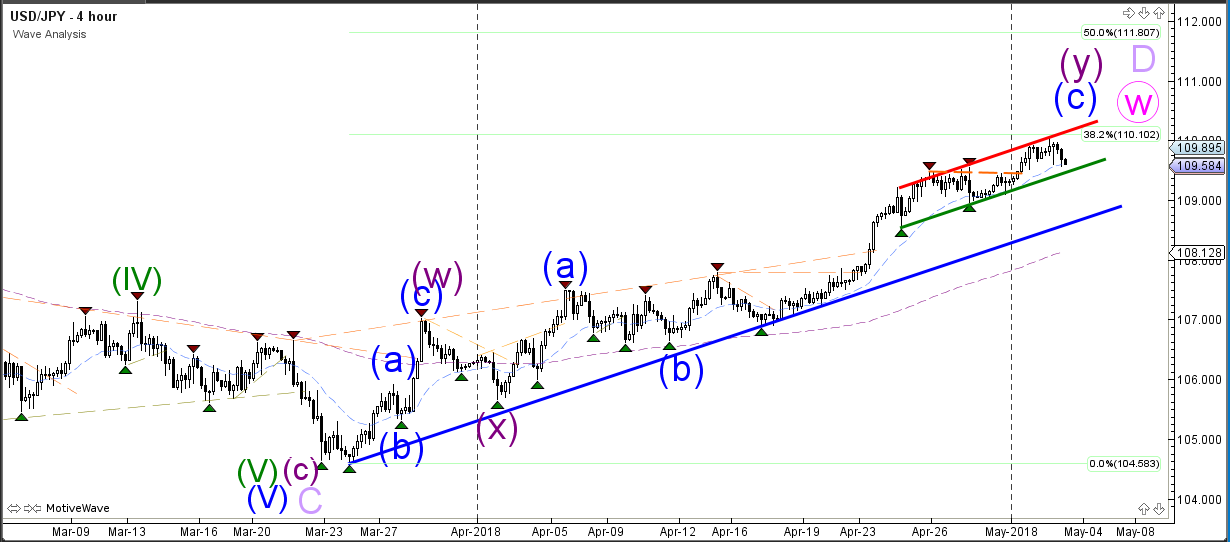
The USD/JPY uptrend channel reached the 110 round level and 38.2% Fibonacci level of potential wave D (light purple) and price seems to be moving away from this target. The direction of the USD/JPY however will depend on how price will respond to the channel. A bearish break below the channel could indicate the completion of wave X (pink) and the start of a bearish correction whereas a bullish break could see price move towards the 50% Fib.
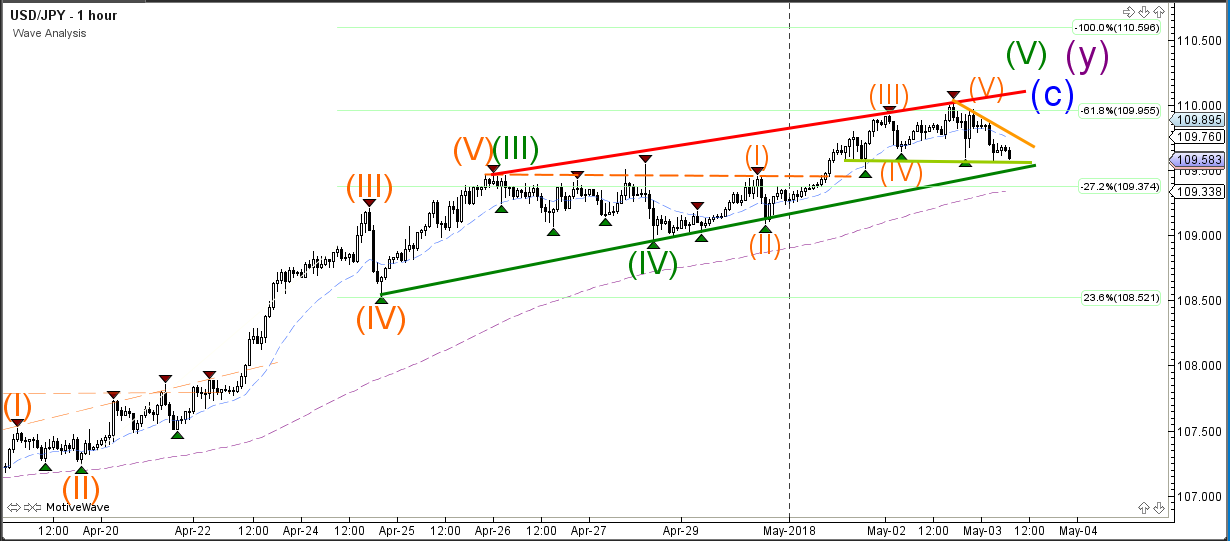
The USD/JPY could see a continuation of the wave 5 (green) if price stays above the support trend lines. A break below the support zone could indicate the completion of the bullish pattern.
GBP/USD Builds Wave 4 Retracement In Bearish Momentum
The GBP/USD downtrend was close to reaching the 1.35 round level, which could be a new bounce or break spot. The bearish momentum is unable to break below the channel support and could make a larger correction. As long as price stays in the bearish channel, price could make a continuation towards the Fibonacci targets but a bullish break would indicate the completion of wave 1 (pink) and the start of wave 2.

The GBP/USD is probably building a wave 4 (green) correction and price could respect the Fibonacci levels and make a bearish bounce and continuation towards the Fib targets of wave 5. A break above the 61.8% Fib and resistance trend line (red) makes the current wave 4 less likely.

EUR/USD Downtrend Breaks 1.20 Support For Bearish Continuation
The EUR/USD downtrend channel managed to break below the round level of 1.20. Price could now use the resistance line of the bearish channel for a continuation. A bearish bounce could see price fall towards the Fibonacci targets of wave 3 (green) whereas a bullish breakout could indicate a bigger retracement.
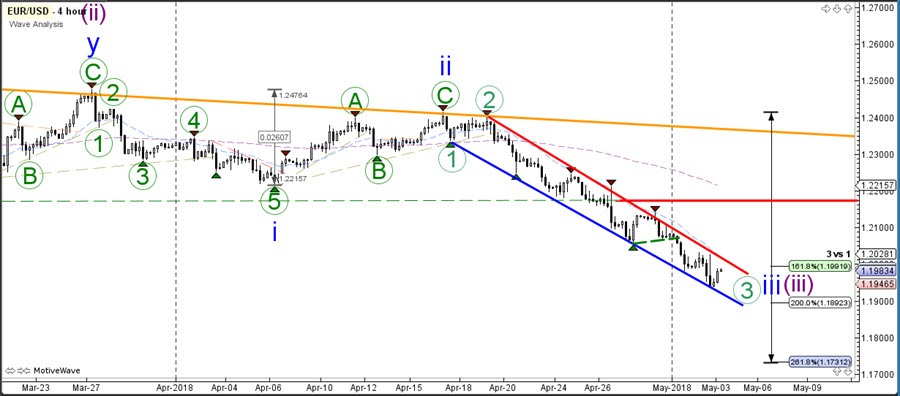
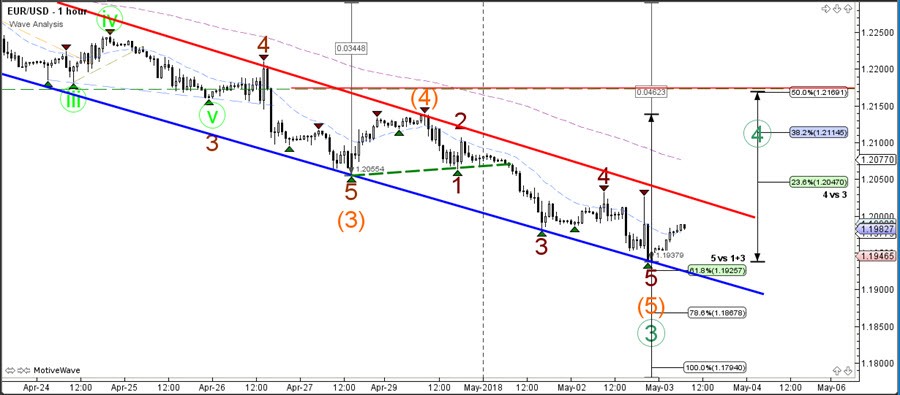
The EUR/USD could extend the bearish wave 3 (green) towards the Fib targets if price stays in the bearish channel. A break above the channel could see price move towards the retracement levels of wave 4 (green). A break above the 50% Fib of wave would make this wave pattern less likely.
Turkey Rate Increase Unlikely To Benefit Lira, Dollar Marginally Lower After FOMC
The Dollar is showing signs of momentary weakness after the latest FOMC statement indicated to investors that the Federal Reserve will not raise US interest rates at a faster pace than has already been priced into the market. One of the main takeaways from the statement is that the Federal Reserve acknowledged that inflation is close to its target, but it appears this will not dictate the central bank accelerating its path of gradually raising US interest rates.
Where the US Dollar could head from here is a tough question to answer, especially when you consider how stunned most investors were by the unexpected turnaround in Dollar momentum over the past couple of weeks.
What could inspire further Dollar strength is if other developed central banks, like the Bank of England (BoE) and European Central Bank (ECB) remain hesitant towards tightening monetary policy. We have seen the British Pound suffer a nosedive following BoE Governor Mark Carney once again backtracking from his previous upbeat tone on higher UK interest rates, and this has provided a reminder that interest rate differentials between the Federal Reserve and other developed central banks can still drive traders towards the US Dollar.
One risk that investors do need to take into account over the near-term is that the United States is set to begin trade talks with China. There is a concern that a breakthrough in the trade tensions will be unlikely and any suggestions that there will be a breakdown in talks between the two largest economies in the world presents a risk that the financial markets will react. The trade talks carry the potential to negatively impact global stocks as a result of reduced risk appetite, and could also result in reduced purchasing momentum for emerging market currencies.
Gold manages to defend $1300
The ability of Gold to defend the psychological support level of $1300 will encourage investors to consider adding Gold to their portfolio around its current levels. If the trade talks between the United States and China do hit a wall, as many anticipate, during the early phases it would provide encouragement for investors to search for Gold as a safe haven asset. The Japanese Yen would also likely benefit if the trade talks between the U.S. and China did lead to a period of renewed uncertainty in the market.
Turkish Lira remains at risk to further historic weakness
Optimism that the Turkish central bank raising interest rates by 0.75% would prevent the Lira from another fall is at risk of falling on its head, as a result of concerns that the interest rate increase is too late to prevent the economy from overheating.
Standard & Poor’s announced yesterday that Turkey’s credit rating had moved into junk territory. Fears over a widening account deficit, inflation more than double the central bank target and an ongoing reoccurrence of political risk is going to continue discouraging traders from purchasing the Turkish Lira at its historic low levels.
Technical Rejection Weighing On EURUSD Pair
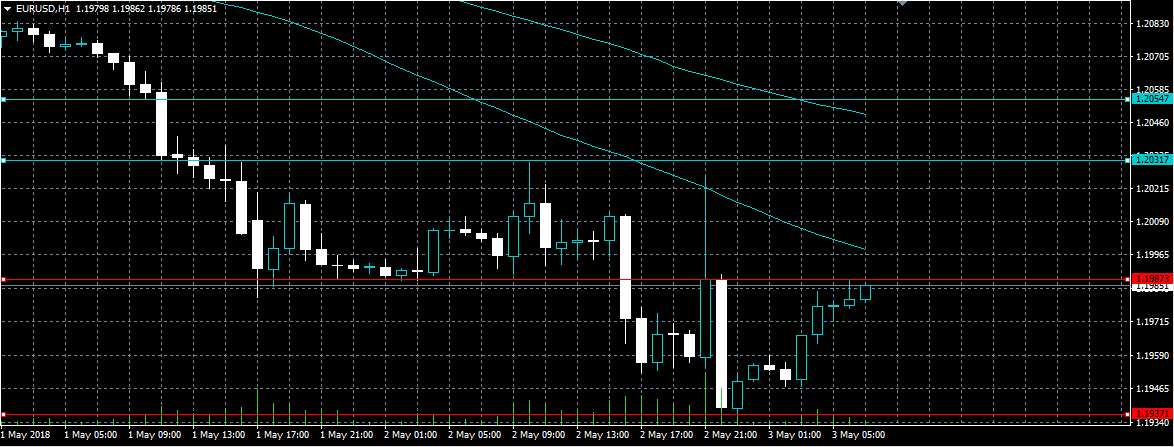
The euro currency remains under pressure against the U.S dollar, after multiple technical rejection above the 1.2000 level, and a second bearish daily close below its 200-day moving average. The EURUSD had bounced from the 1.1952 level after the FOMC Policy Statement, and price was then swiftly rejected from the 1.2025 level, pushing the pair to a fresh monthly trading-low, at 1.1937. Euro traders now look towards the release of key CPI and PPI inflation data from the eurozone economy this morning.
The EURUSD pair is strongly bearish while trading below the 1.2000 level, further losses towards 1.1937 and 1.1900 remain likely.
If the EURUSD pair moves back above the 1.2000 level, the 1.2025 and 1.2054 levels offer strong intraday technical resistance.