Sample Category Title
USDJPY – Reversal Pattern Is Forming On Daily Chart
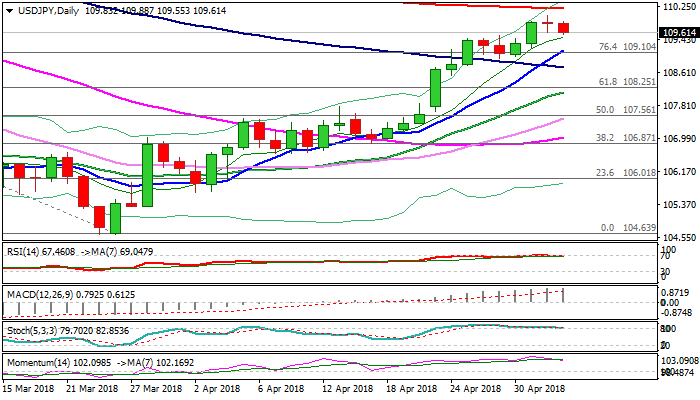
The pair holds in red in early Thursday’s trading and eases to 109.55 (European session low), penetrating rising hourly cloud (spanned between 108.71 and 109.50).
Reversal pattern is forming on daily chart after bulls stalled under 200SMA, following brief probe above psychological 110.00 barrier and Wednesday’s trading ended in Doji candle, signaling indecision.
Confirmation of reversal requires extension and close below rising 10SMA (109.15) to sideline bulls and signal deeper correction.
Daily RSI and slow stochastic are reversing from overbought territory and support scenario, together with 14-d momentum which turns south.
The notion could also find support from Fed’s policy statement which was seen by markets as not hawkish enough as expected to boost dollar for eventual break through 110.00 and 200SMA pivots.
Markets are focusing a number of data due later today, ahead of tomorrow’s release of US jobs data, which would provide stronger signals.
Res: 109.88, 110.03, 110.20, 110.48
Sup: 109.15, 109.15, 108.97, 108.74
GBPUSD – Thick Hourly Cloud Weighs On Recovery Attempts
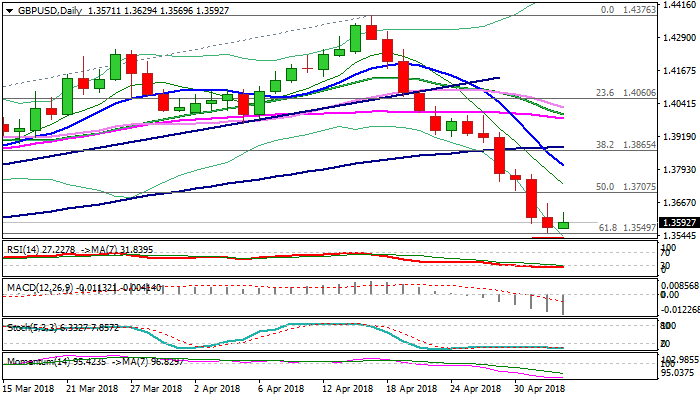
Cable fell back below 1.36 handle on downbeat UK services PMI data (Apr 52.8 vs 53.5 f/c), signaling that today's recovery attempts may be over. Steep descend from 1.4376 (16 Apr peak) found footstep at 1.3550 (Fibo 61.8% of 1.3038/1.4376 ascend, reinforced by rising 200SMA at 1.3533), above which strong bears may take a breather on oversold daily studies and profit-taking. However, techs so far show no firmer signals of bounce and today's recovery stalled at 1.3630, with near-term action weighed by weak UK data and thick hourly cloud (1.3643/86). Upside prospect remains limited for now and requires lift above hourly cloud and regain of previous key support at 1.3711, to generate bullish signal. Strong bearish signal could be expected on break below 1.3550/33 pivots which would expose targets at 1.3500 (psychological) and 1.3442 (Fibo 38.2% of 1.1930/1.4376 post-Brexit recovery).
Res: 1.3630, 1.3650, 1.3643, 1.3686
Sup: 1.3550, 1.3533, 1.3500, 1.3442
GBP/JPY Daily Outlook
Daily Pivots: (S1) 148.67; (P) 149.40; (R1) 149.79; More...
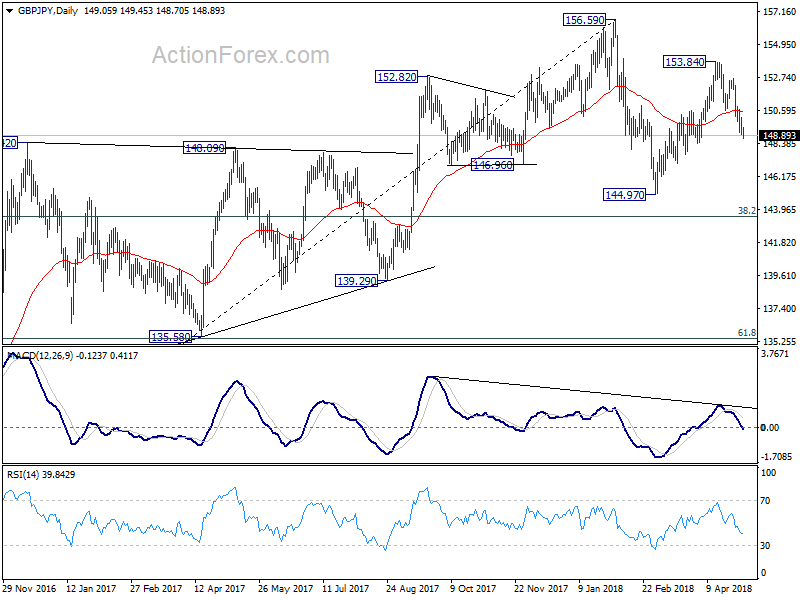
GBP/JPY's fall from 153.84 is still in progress and intraday bias remains on the downside for 148.47 support. Current decline is seen as as the third leg of the corrective pattern from 156.59. Break of 148.37 will pave the way to 144.97 and below. On the upside, above 150.60 resistance turned support, however, will argue that fall from 153.84 might be finished. And intraday bias will be turned back to the upside for 152.71 resistance instead.
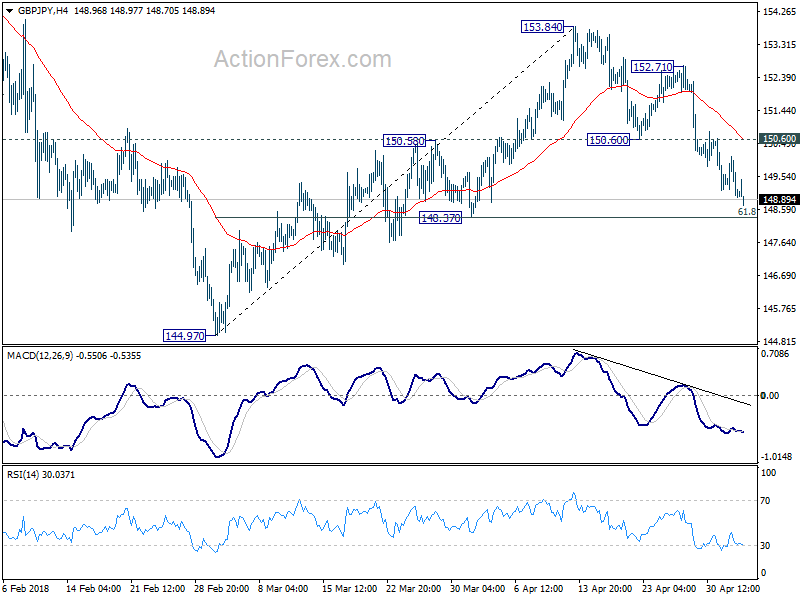
In the bigger picture, price actions from 156.59 are viewed as a corrective pattern. For now, we'd expect at least one more fall for 38.2% retracement of 122.36 to 156.59 at 143.51 before the consolidation completed. Though, firm break of 156.59 will resume whole up trend from 122.36 (2016 low) to 50% retracement of 195.86 (2015high) to 122.36 at 159.11 next.
EUR/JPY Daily Outlook
Daily Pivots: (S1) 130.99; (P) 131.55; (R1) 131.85; More....
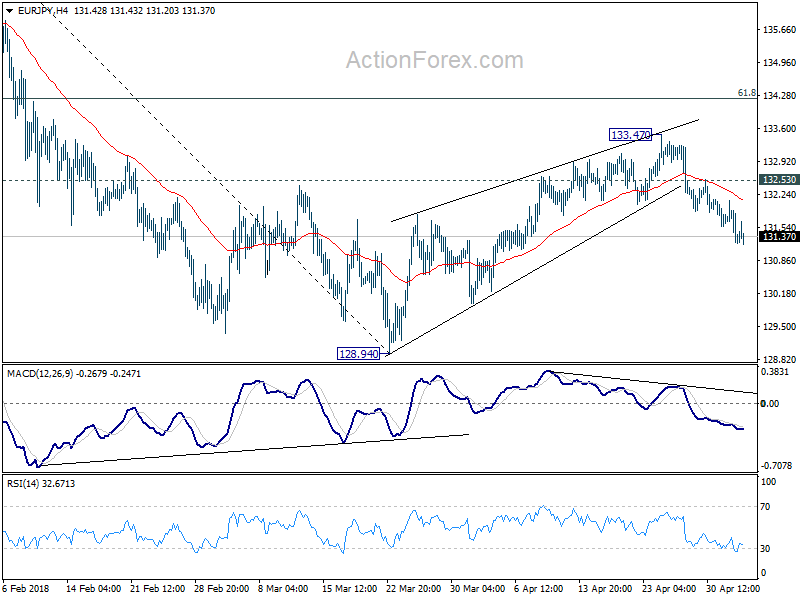
Intraday bias in EUR/JPY remains on the downside as fall from 133.47 is still in progress. As noted before, corrective rise from 128.94 has completed at 133.47 already. Deeper decline is expected to retest 128.94 low next. And, break there will resume whole fall from 137.49. On the upside, above 132.53 minor resistance will delay the bearish case. Intraday bias would be turned to the upside to extend the rebound from 128.94. Still, we expect strong resistance from 61.8% retracement of 137.49 to 128.94 at 134.22 to limit upside and bring near term reversal eventually.
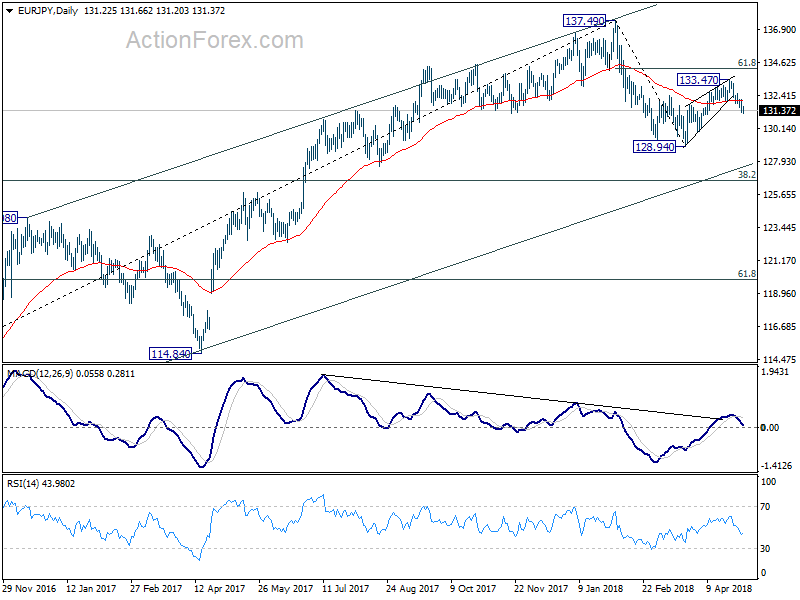
In the bigger picture, price action from 137.49 medium term top are developing into a corrective pattern. The first leg has completed at 128.94. The second leg might be finished at 133.47 or it might extend. But after all, we'd expect another decline through 128.94 to 38.2% retracement of 109.03 to 137.49 at 126.61 before completing the correction.
EUR/AUD Daily Outlook
Daily Pivots: (S1) 1.6003; (P) 1.6030; (R1) 1.6067; More....
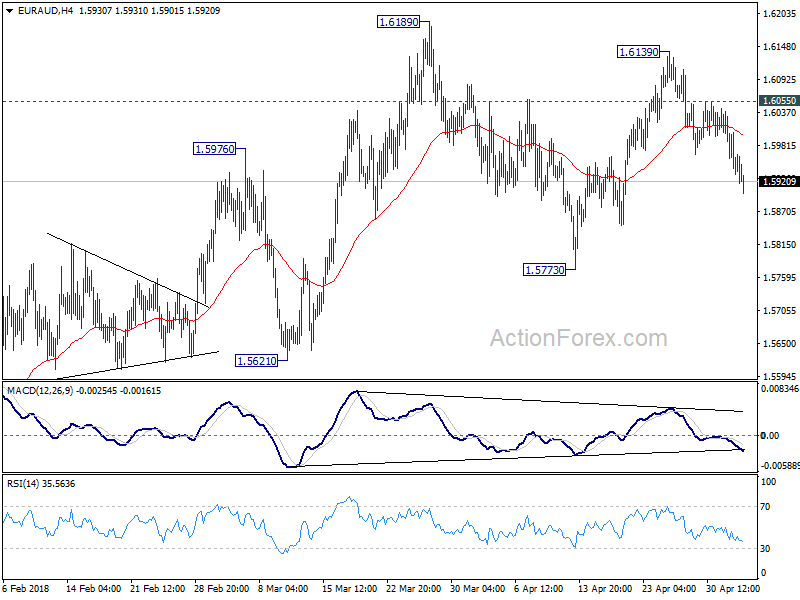
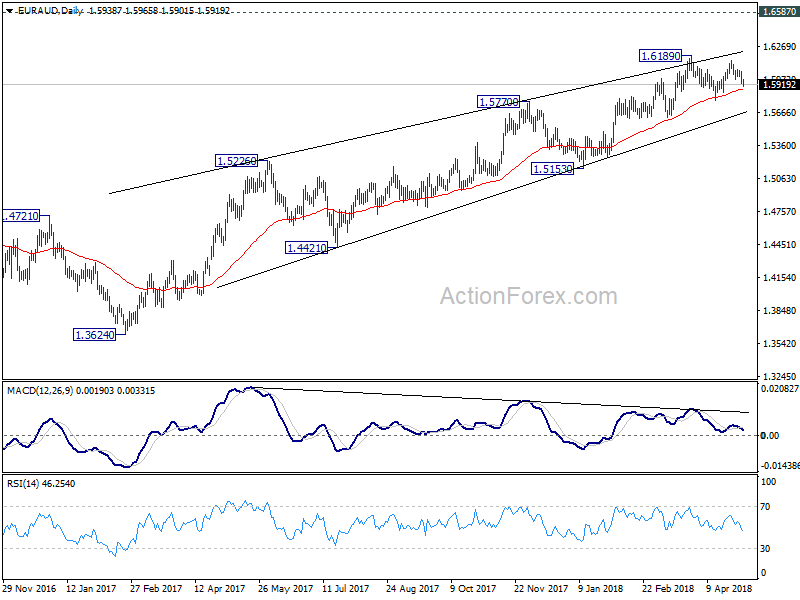
EUR/AUD's fall continues today and reaches as low as 1.5910 so far. Intraday bias remains on the downside for 1.5773 support and possibly below. For the moment, price actions from 1.6189 are seen as a consolidation pattern. Hence, downside should be contained above 1.5621 to bring rise resumption. On the upside, above 1.6055 minor resistance will turn bias to the upside for 1.6189 high again.
In the bigger picture, while there is bearish divergence condition in daily MACD, there is no clear sign of reversal yet. EUR/AUD also drew strong support from 55 day EMA and rebounded. Current rally from 1.3624 could still extend to 1.6587 key resistance (2015 high). Nonetheless, we'd expect further loss of upside momentum, and strong resistance from 1.6587 to limit upside and bring reversal. On the downside, sustained break of 1.5621 support should confirm reversal and turn outlook bearish for 1.5153 support and below.
EUR/GBP Daily Outlook
Daily Pivots: (S1) 0.8781; (P) 0.8805; (R1) 0.8829; More...
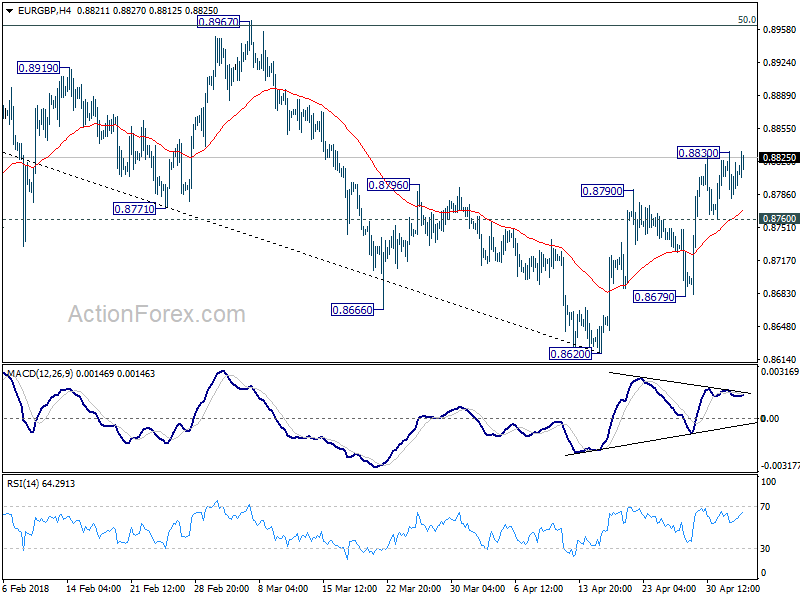
Intraday bias in EUR/GBP remains neutral at this point. Further rise is expected as long as 0.8760 minor support holds. On the upside, above 0.8830 will resume the rebound from 0.8620 and target 0.8967 cluster resistance next (50% retracement of 0.9305 to 0.8620 at 0.8963). Firm break there will confirm neat term reversal. On the downside, below 0.8760 minor support will turn focus back to 0.8679 support. Break there will suggests that larger decline from 0.9305 is resuming.
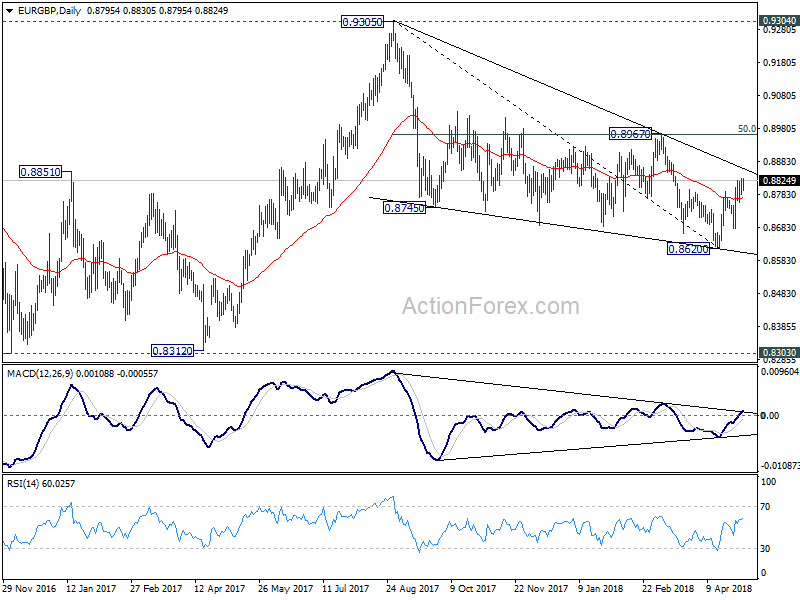
In the bigger picture, for now, the decline from 0.9305 is seen as a leg inside the long term consolidation pattern from 0.9304 (2016 high). Such consolidation pattern could extend further. Hence, in case of strong rally, we'd be cautious on strong resistance by 0.9304/5 to limit upside. Meanwhile, in another decline attempt, we'd expect strong support from 0.8116 cluster support (50% retracement of 0.6935 to 0.9304 at 0.8120) to contain downside.
EUR/CHF Daily Outlook
Daily Pivots: (S1) 1.1930; (P) 1.1946; (R1) 1.1959; More...
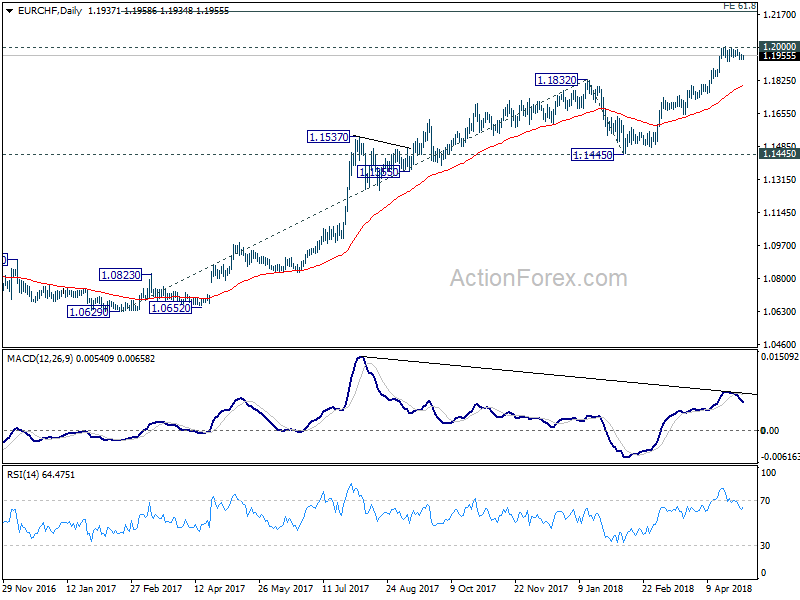
EUR/CHF remains bounded in tight range below 1.2004 as consolidation continues. Intraday bias stays neutral. Further rise is expected with 1.1888 minor support intact. On the upside side, decisive break of 1.2 will pave the way to 61.8% projection of 1.0629 to 1.1832 from 1.1445 at 1.2188. However, consider bearish divergence condition in 4 hour MACD, break of 1.1888 will indicate short term topping. In that case, deeper pull back would be seen back to 1.1445/1832 support zone.
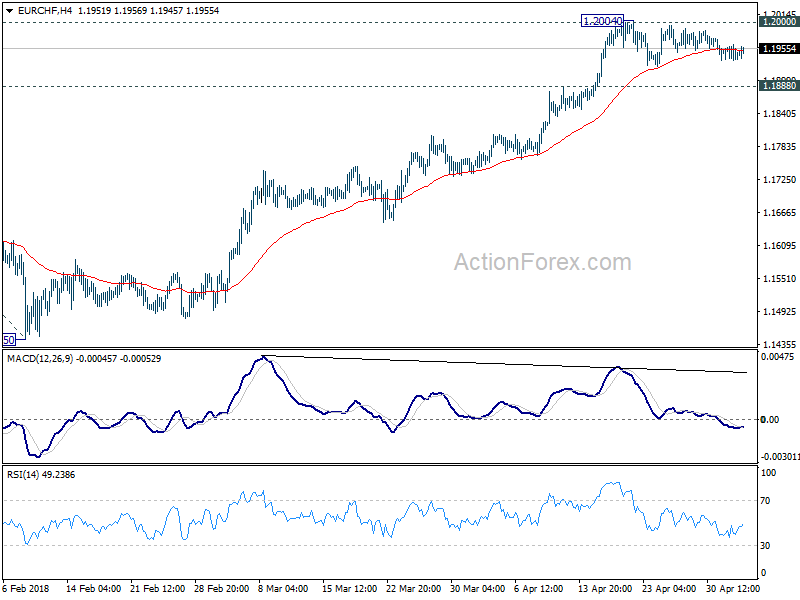
In the bigger picture, long term up trend in EUR/CHF is still in progress. Prior SNB imposed floor at 1.2003 was already met but there is no sign of reversal yet. As long as 1.1445 support holds, we'd expect the up trend to extend to 2013 high at 1.2649 next.
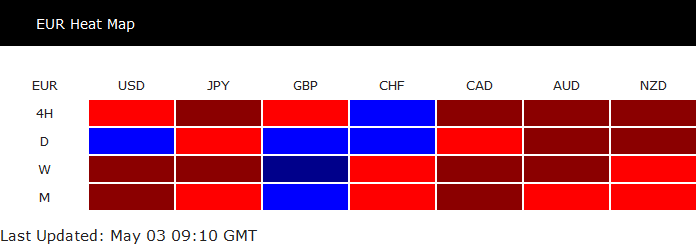
Euro dips as CPI slowed to 1.2%, missed expectations
EUR drops broadly, except versus CHF after inflation data missed expectations. Weakness is apparent in 4H row in the heat map.
 Eurozone flash CPI slowed to 1.2% yoy in April, down from 1.3% Yoy and missed expectation of 1.3% yoy. CPI core performed even worse, dropped to 0.7% yoy, down from 1.0% yoy and missed expectation of 0.9% yoy.
Eurozone PPI rose 0.1% mom, 2.1% yoy in March, matched expectations.
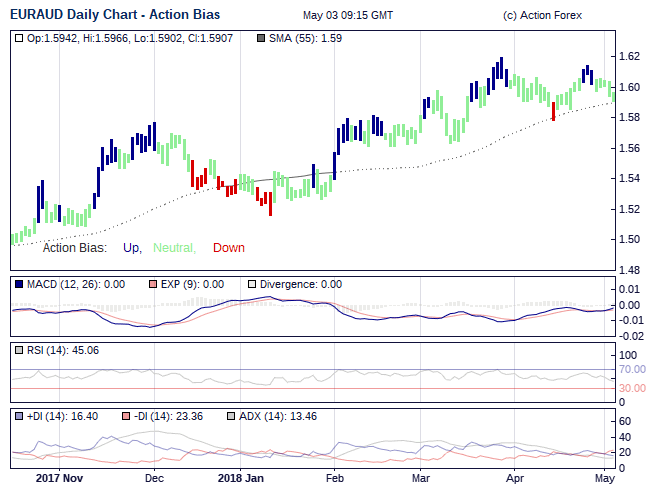
The relatively neutral D action bias chart suggests that's EUR/AUD is in consolidation.
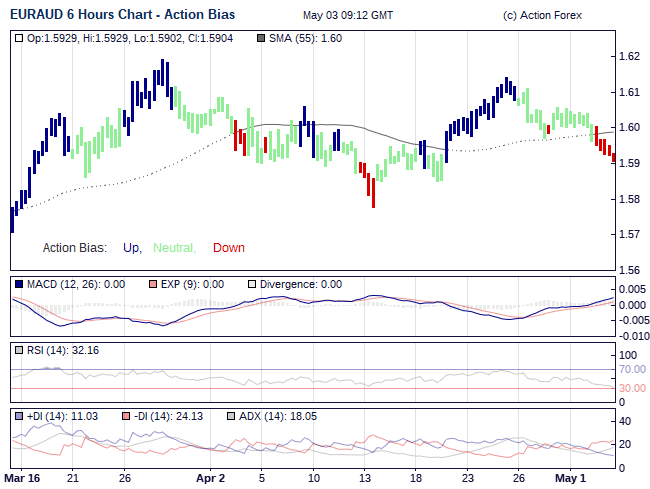
 Meanwhile, the 6H action bias chart indicates it's having solid downside near term momentum, for 1.5773 support.
Forex Technical Analysis: EUR/USD, USD/JPY, GBP/USD
EUR/USD
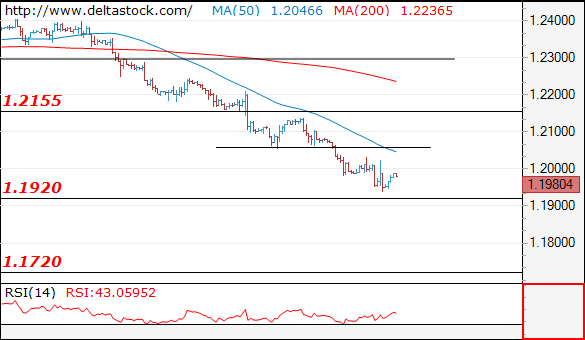
Current level - 1.1980
Still bearish, for a break through 1.1920, towards 1.1840. Key resistance lies at 1.2060.
| Resistance | Support | ||
| intraday | intraweek | intraday | intraweek |
| 1.2060 | 1.2300 | 1.1920 | 1.1920 |
| 1.2160 | 1.2413 | 1.1840 | 1.1720 |
 USD/JPY
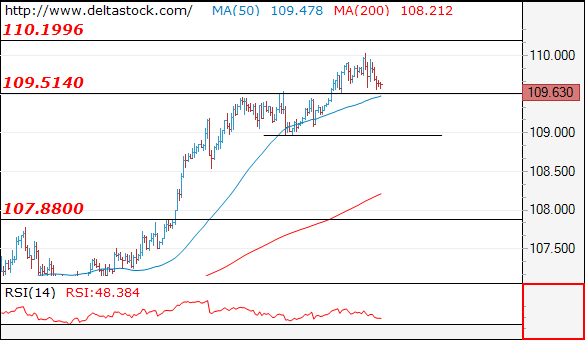
Current level - 109.63
The bias is positive above 109.50, for a rise towards 110.20, en route to 111.80 zone. Crucial on the downside is 109.00 low.
| Resistance | Support | ||
| intraday | intraweek | intraday | intraweek |
| 110.20 | 110.20 | 109.50 | 106.60 |
| 111.30 | 111.90 | 108.50 | 104.60 |
GBP/USD
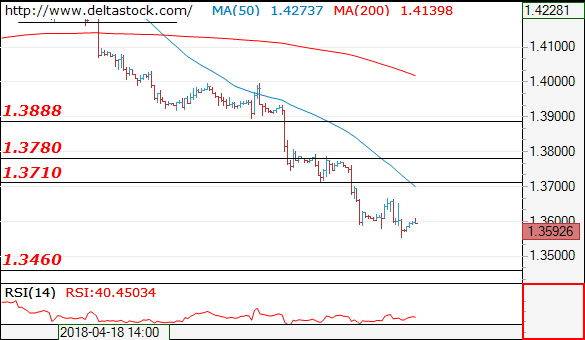
Current level - 1.3592
The downtrend is intact, heading towards 1.3460 area. Crucial for the whole slide from 1.3990 is 1.3660 peak.
| Resistance | Support | ||
| intraday | intraweek | intraday | intraweek |
| 1.3660 | 1.3990 | 1.3560 | 1.3460 |
| 1.3790 | 1.4100 | 1.3460 | 1.3310 |
WTI Bullish Flag On 4H Time Frame
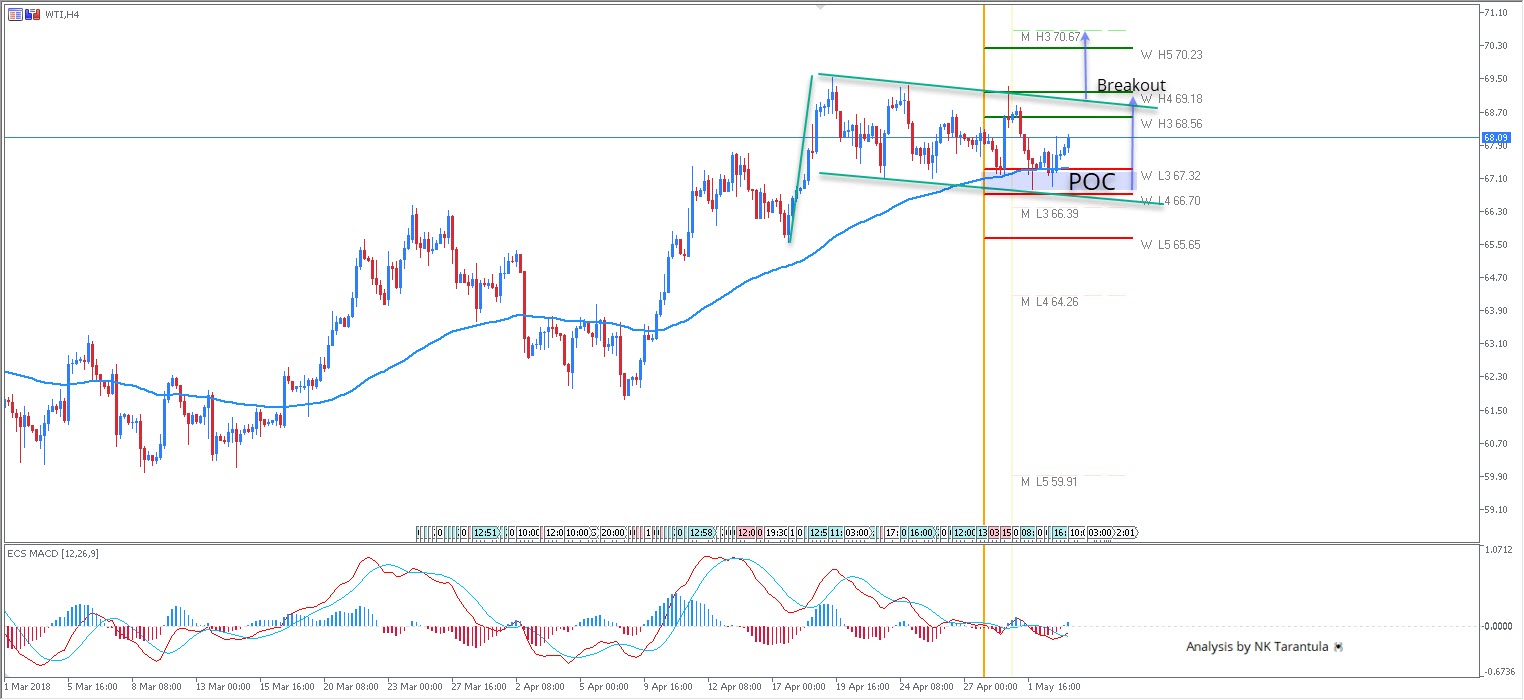
The WTI has formed a bullish flag at W L4/M L3 confluence zone. The price might spike from the POC zone 66.70-67.30 towards 69.18. A 4h close or 1h momentum above 69.20 should provide a bullish flag breakout. If that happens targets are 70.23 and 70.67. Ideally for the WTI to remain bullish, the price should stay above 66.39 – Monthly L3 support.
Source: Admiral Markets MT5 with MT5SE Add-on
W L3 - Weekly Camarilla Pivot (Weekly Interim Support)
W H3 - Weekly Camarilla Pivot (Weekly Interim Resistance)
W H4 - Weekly Camarilla Pivot (Strong Weekly Resistance)
M H4 - Monthly Camarilla Pivot (Very Strong Monthly Resistance)
M L3 – Monthly Camarilla Pivot (Monthly Support)
M L4 – Monthly H4 Camarilla (Very Strong Monthly Support)
POC - Point Of Confluence (The zone where we expect price to react aka entry zone)