Sample Category Title
GBPUSD Strongly Bearish Below 1.3760 Level
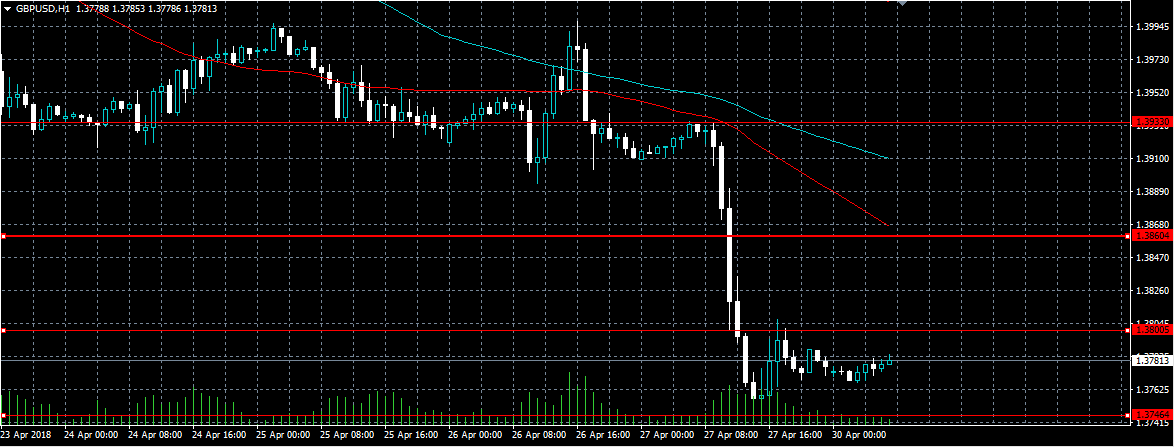
The British pound has opened the new trading week under bearish pressure against the U.S dollar, following another strong sell-off in the pound on Friday. The GBPUSD pair currently trades around the 1.3780 level, with two-straight weeks of heavy trading losses weighing on sterling’s trading sentiment. Traders will likely focus on the pivotal 1.3760 technical level, and the former weekly trading-low, which is located at the 1.3746 level.
The GBPUSD pair is strongly bearish while trading below the 1.3760 level, further losses towards the 1.3730 and 1.3695 levels seem possible.
If the GBPUSD pair holds above the 1.3760 level, buyers may be encouraged to test towards the 1.3800 and 1.3860 resistance levels.
Global Data Flows In The Headlines On Monday
A steady stream of economic data will make its way through the financial markets on Monday, bringing into focus inflation and consumer spending from both sides of the Atlantic. Currency traders should expect significant action for US dollar pairs as a result.
Germany will kick off the release cycle with a report on retail sales at 06:00 GMT. Receipts at retail stores are forecast to rise 1% in March after declining 0.7% the previous month.
At 09:00 GMT, attention shifts to inflation data with Italy set to report on the April consumer price index (CPI). Three hours later, Germany will also issue its latest inflation report. The German consumer price index is forecast to rise 1.6% in the 12 months through April, unchanged from March. Germany's harmonized index of consumer prices (HICP) likely rose 1.5% year-over-year.
Shifting gears to North America, the US Department of Commerce will report on personal income and outlays at 12:30 GMT. Personal income from all sources is projected to rise 0.4% in March, following an identical increase the month before. Personal spending is expected to rise by a similar amount following a 0.2% gain in March.
The same report will also contain the government's most recent estimate of core personal consumption expenditures (PCE), the Federal Reserve's preferred measure of inflation. The core PCE index is projected to rise 1.8% year-over-year, following an identical increase the month before.
Later in the morning, ISM-Chicago Inc. will release the April edition of the Chicago purchasing managers' index (PMI). Fifteen minutes later, the National Association of Realtors (NAR) will report on pending home sales for March.
The Federal Reserve Bank of Dallas will wrap up the session with its latest manufacturing business index, which is scheduled for release at 14:30 GMT.
EUR/USD
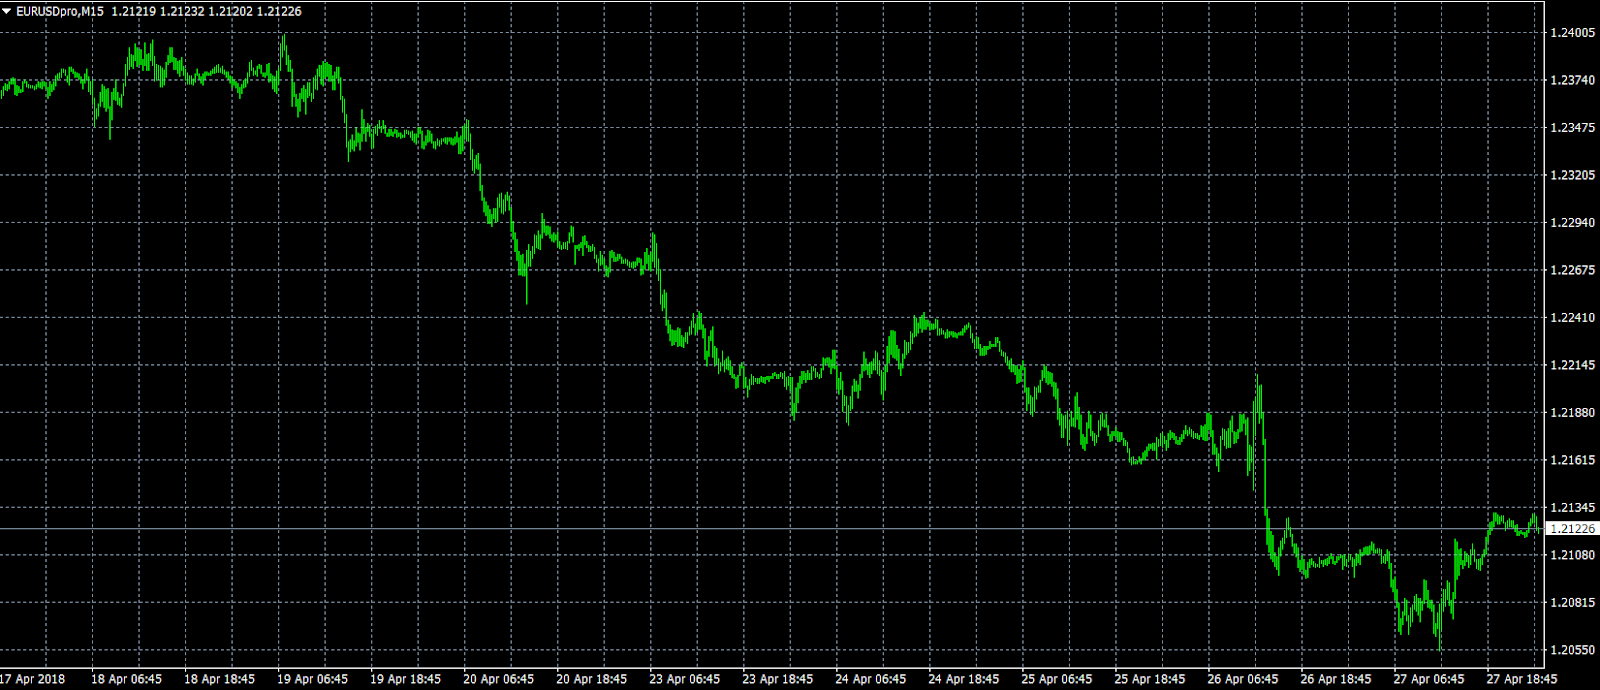
Europe's common currency fell below 1.2100 US on Friday as the dollar extended its rally against a basket of global peers. EUR/USD has since regained that level and is now trading at 1.2123. However, upside momentum is severely limited as traders continue to monitor US inflation and interest rates.
GBP/USD
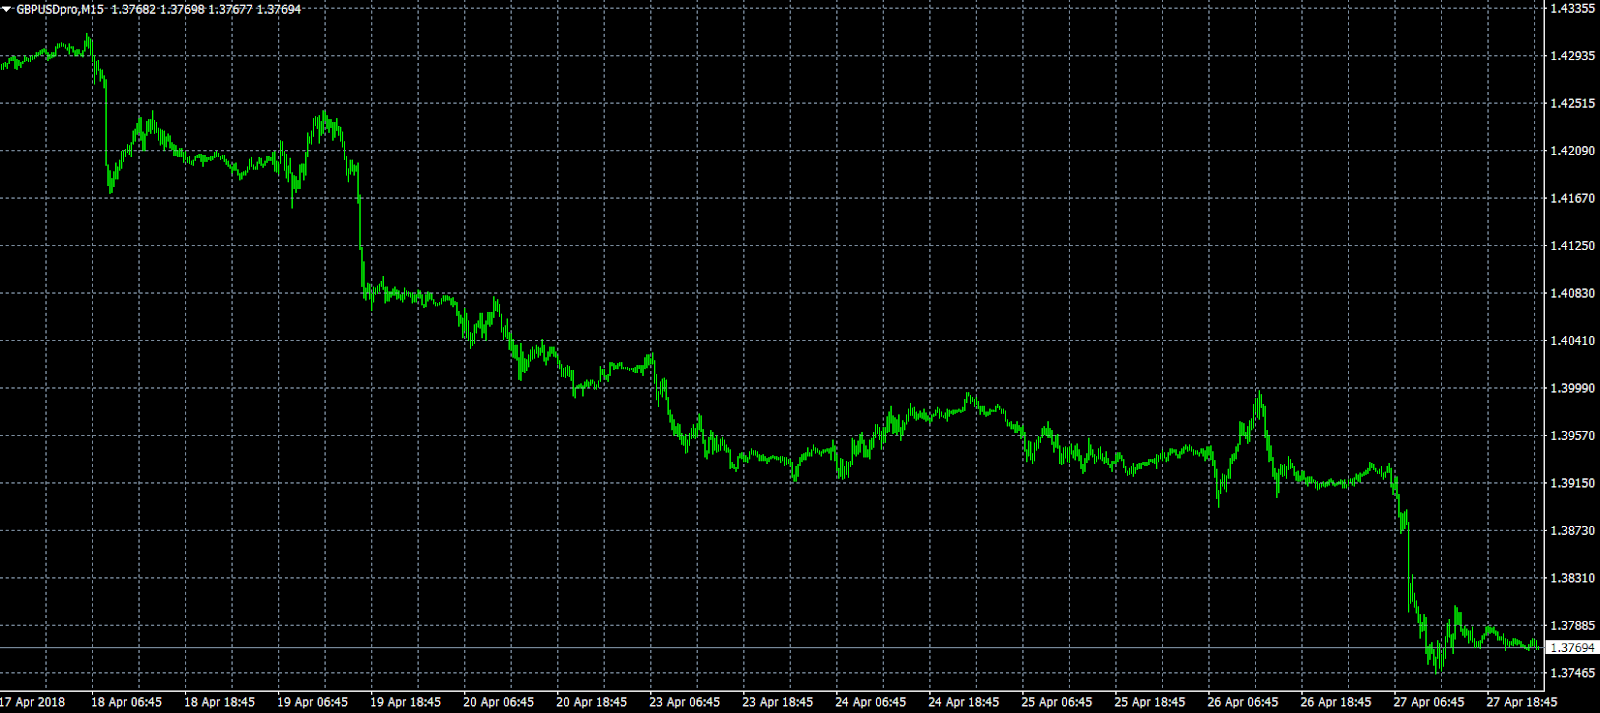
Cable is coming off one of its worst weeks in recent memory, with prices falling to two-month lows on the major exchanges. GBP/USD was last seen trading at 1.3771, having declined a staggering 600 pips from the 17 April swing high. Immediate support is now located in the mid-1.3700 range.
USD/JPY
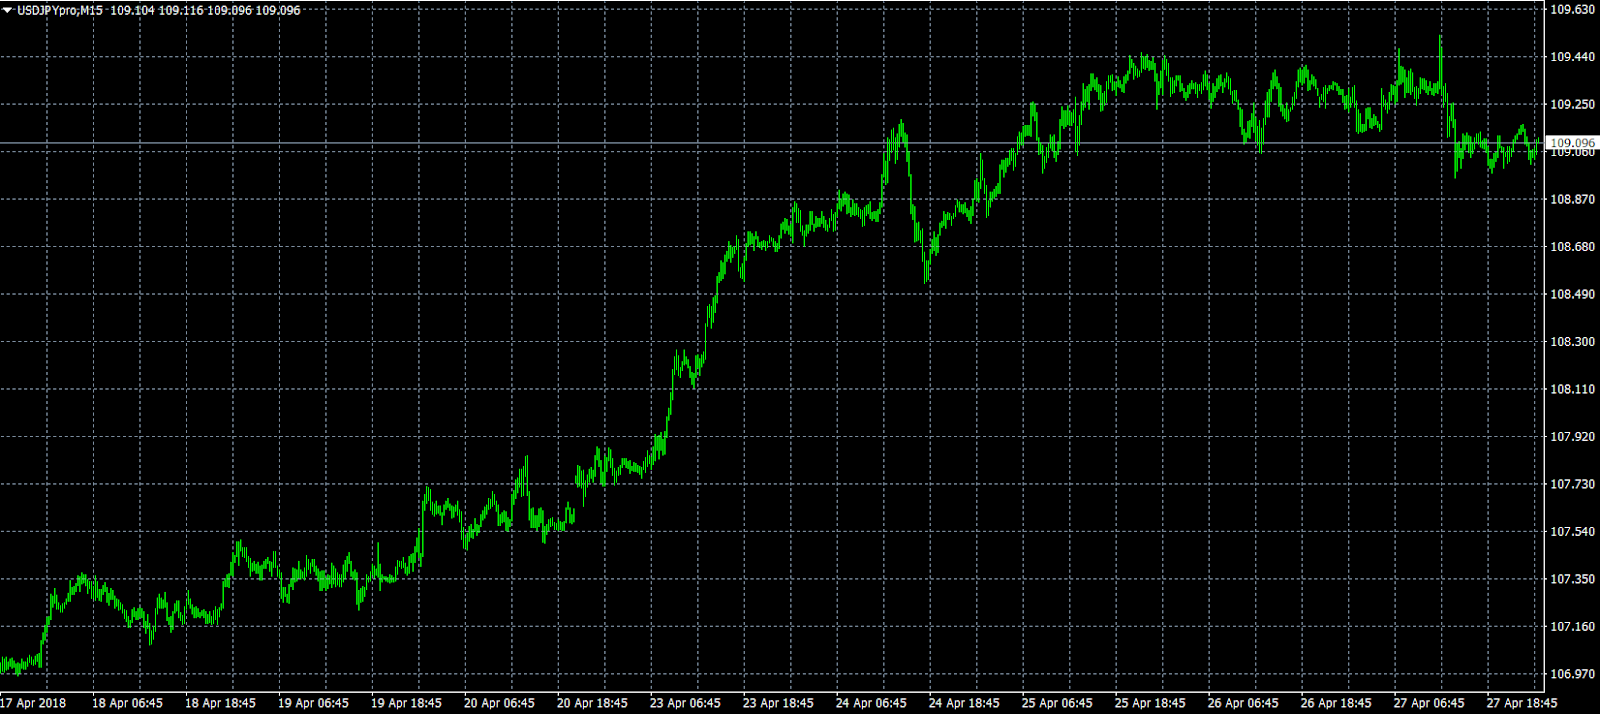
After a choppy Friday session, the USD/JPY exchange rate is looking to regain its momentum at the start of the week. The pair is trading comfortably above 109.00 but faces fierce resistance in the mid-109.00 range. On the downside, buyers are likely to re-enter the market at price points below 108.65.
GBP/JPY Daily Outlook
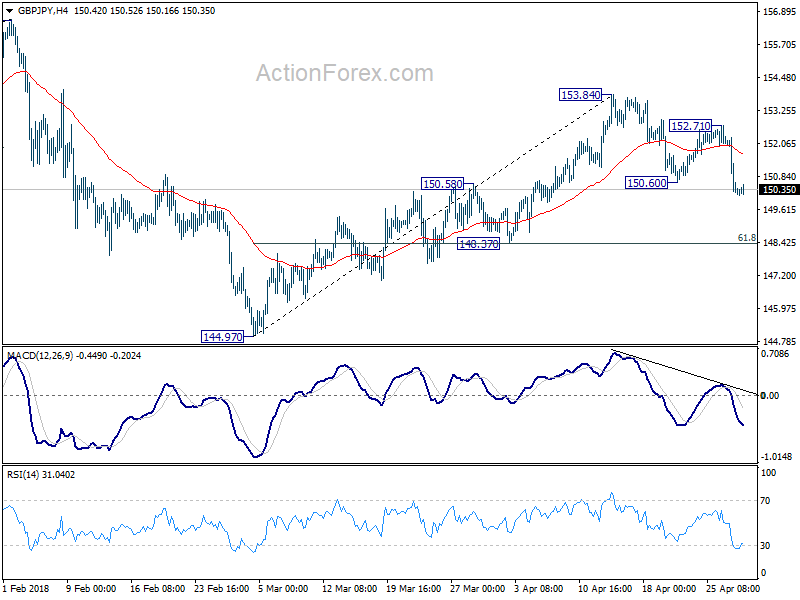
Daily Pivots: (S1) 149.51; (P) 150.89; (R1) 151.59; More...
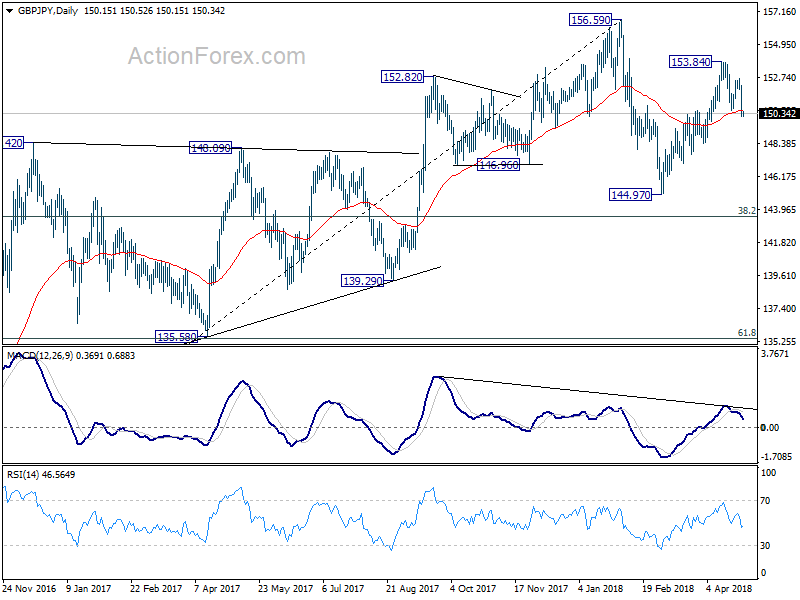
Intraday bias in GBP/JPY remains on the downside for 148.37 support first. Current fall from 153.84 is seen as the third leg of the corrective pattern from 156.59. Break of 148.37 will pave the way to 144.97 and below. On the upside, break of 152.71 resistance is needed to indicate completion of the decline. Otherwise, near term outlook will remain cautiously bearish in case of recovery.
In the bigger picture, price actions from 156.59 are viewed as a corrective pattern. For now, we'd expect at least one more fall for 38.2% retracement of 122.36 to 156.59 at 143.51 before the consolidation completed. Though, firm break of 156.59 will resume whole up trend from 122.36 (2016 low) to 50% retracement of 195.86 (2015high) to 122.36 at 159.11 next.
EURUSD Consolidates Above 1.2154 Fibo Support
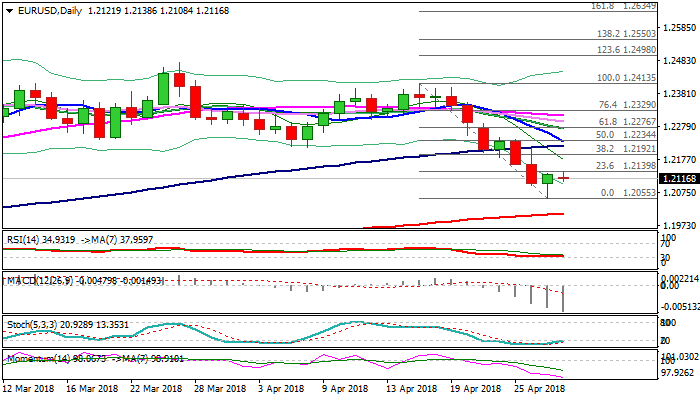
The Euro eased in early European trading on Monday after holding within narrow range in Asian, driven by weaker that expected German retail sales (Mar -0.6 vs 0.8% f/c) and eyeing German CPI data (Apr m/m -0.1% f/c vs 0.4% prev) for fresh signal.
The price bounced from dangerous zone on Friday, following strong rejection at 1.2054 (Fibo 50% of 1.1553/1.2555 rally), which left Hammer candle, signaling that steep descend from 1.2413 (17 Apr high) might be running out of steam and basing attempts.
Daily slow stochastic is emerging from oversold territory and supports scenario, however, downside risk persists, as daily techs remain in firm bearish setup and continue to build negative momentum.
Recovery attempts were so far capped by hourly cloud (spanned between 1.2123 and 1.2157) guarding next pivot at 1.2192 (Fibo 38.2% of 1.2413/1.2055), firm break of which is needed to ease downside pressure.
The pair would remain in extended consolidation while 1.2192 stays intact, with bearish bias in play for renewed probe through 1.2054 support and possible attack at key 1.20 support zone (psychological support / 200SMA).
Res: 1.2140, 1.2154, 1.2192, 1.2219
Sup: 1.2108, 1.2054, 1.2000, 1.1936
EUR/JPY Daily Outlook
Daily Pivots: (S1) 131.95; (P) 132.17; (R1) 132.49; More....
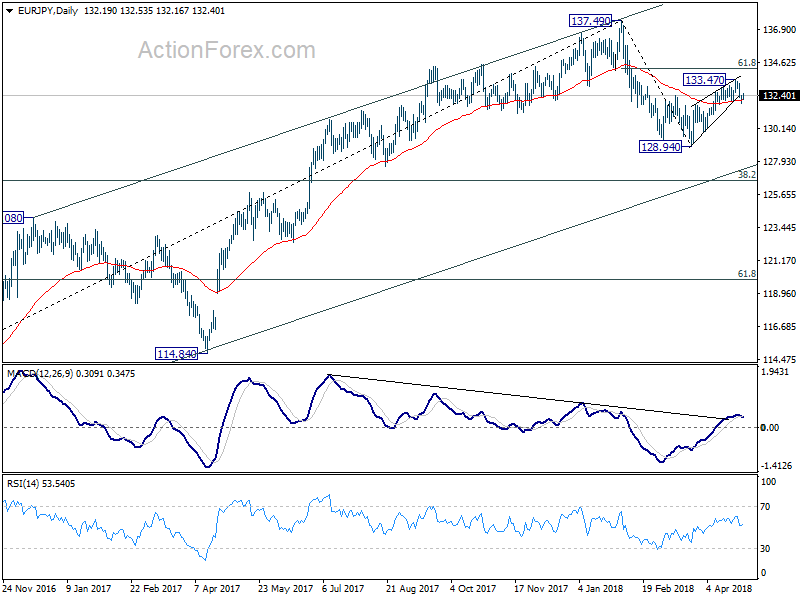
We're holding on to the view that corrective rebound from 128.94 has completed at 133.47 already. Deeper decline should be seen back to retest 128.94 low. Break there will resume whole decline from 137.49. On the upside, above 133.47 will extend the rebound. But we expect strong resistance from 61.8% retracement of 137.49 to 128.94 at 134.22 to limit upside and bring near term reversal eventually.

In the bigger picture, price action from 137.49 medium term top are developing into a corrective pattern. The first leg has completed at 128.94. The second leg might be finished at 133.47 or it might extend. But after all, we'd expect another decline through 128.94 to 38.2% retracement of 109.03 to 137.49 at 126.61 before completing the correction.
EUR/USD Bearish Trend Depends On Reaction At Broken Support
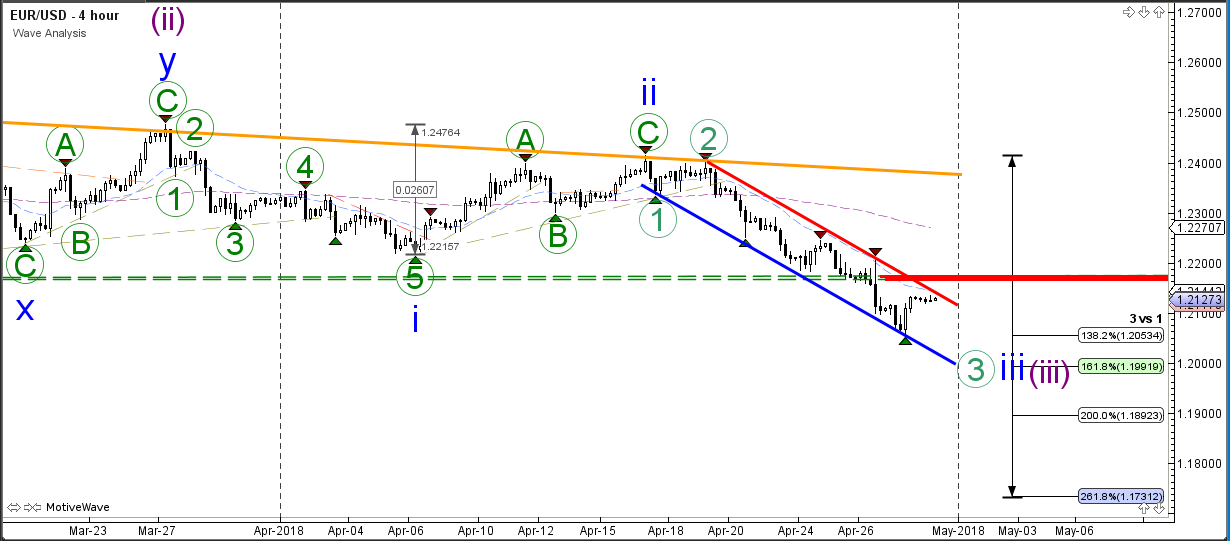
The EUR/USD bearish momentum broke below a key support zone (dotted green) but did not yet reach the 161.8% Fibonacci target which is the minimum for an impulsive wave 3. Price usually goes further than this Fib target. The reason for this is because price might be building a shallow retracement within the downtrend. However, price should stay below the previous resistance (red) otherwise a bullish wave structure might still be more likely.
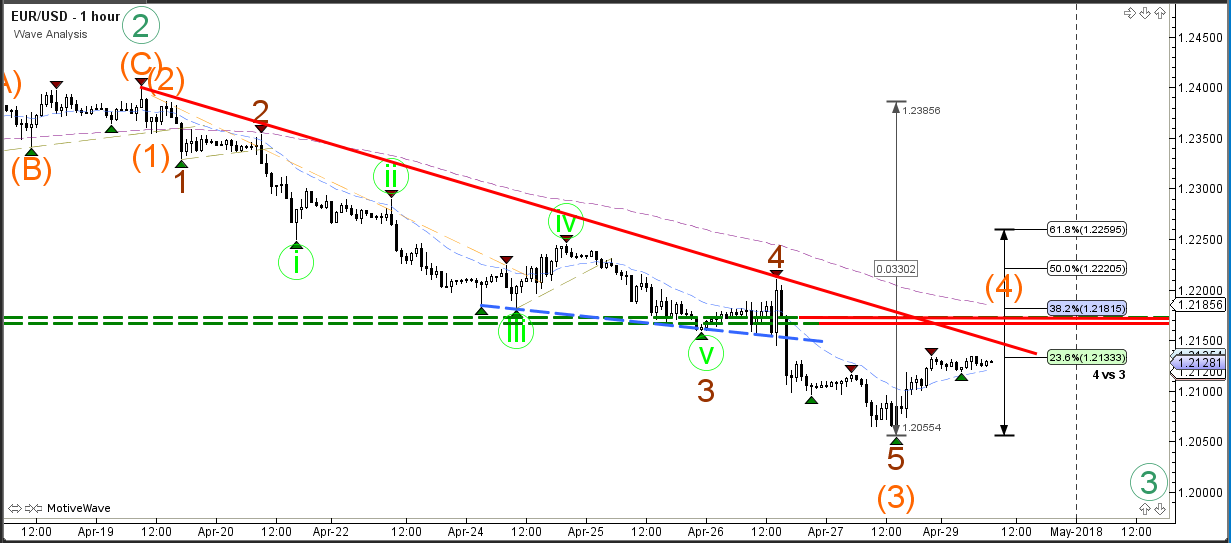
The EUR/USD could test the broken support zone and continue with the downtrend via the wave 3 (green). Price would need to test and bounce at the Fibonacci retracement levels of a wave 4 (orange). A break above the 61.8% Fib makes a wave 4 scenario unlikely at the bearish trend could be in danger.
EUR/GBP Daily Outlook
Daily Pivots: (S1) 0.8669; (P) 0.8709; (R1) 0.8739; More...
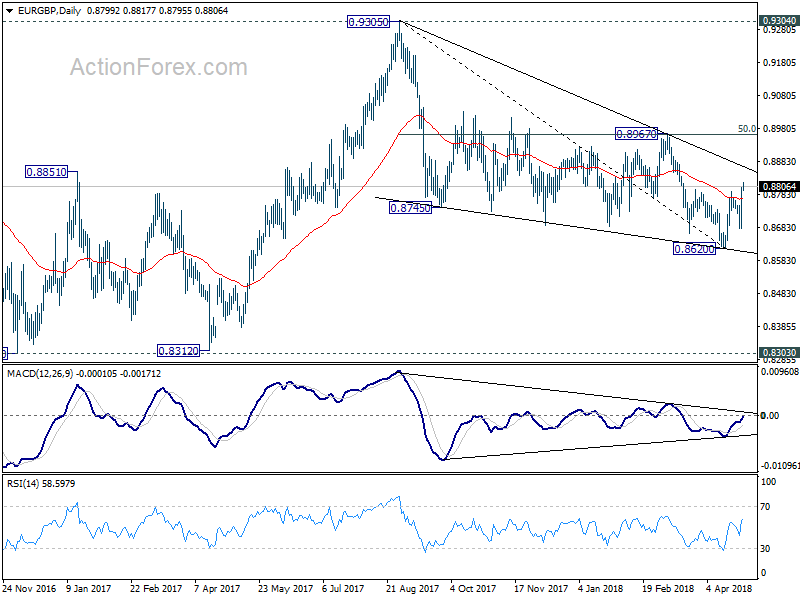
EUR/GBP's rally continues today and reaches as high as 0.8817 so far. Intraday bias remains on the upside for 0.8967 cluster resistance next (50% retracement of 0.9305 to 0.8620 at 0.8963). Firm break there will confirm neat term reversal. On the downside, below 0.8679 will turn bias to the downside for 0.8620 instead.
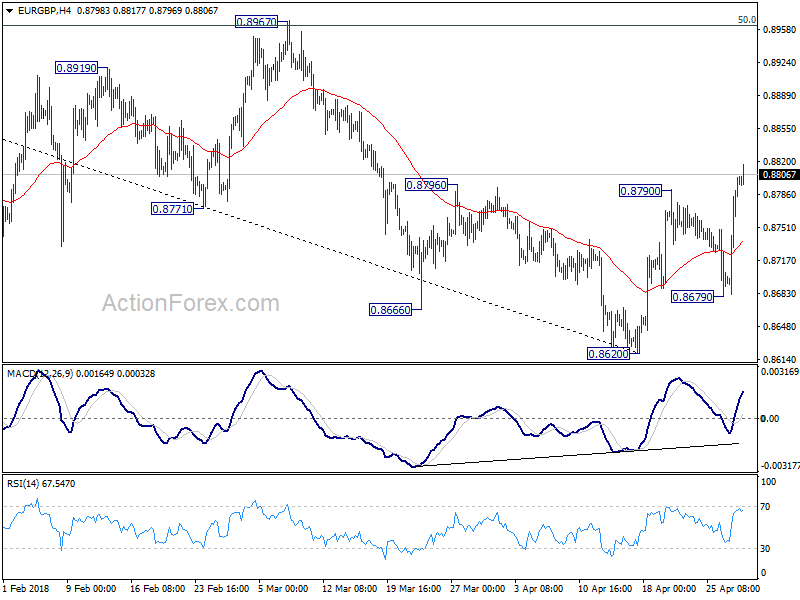
In the bigger picture, for now, the decline from 0.9305 is seen as a leg inside the long term consolidation pattern from 0.9304 (2016 high). Such consolidation pattern could extend further. Hence, in case of strong rally, we'd be cautious on strong resistance by 0.9304/5 to limit upside. Meanwhile, in another decline attempt, we'd expect strong support from 0.8116 cluster support (50% retracement of 0.6935 to 0.9304 at 0.8120) to contain downside.
Forex Technical Analysis: EUR/USD, USD/JPY, GBP/USD
EUR/USD
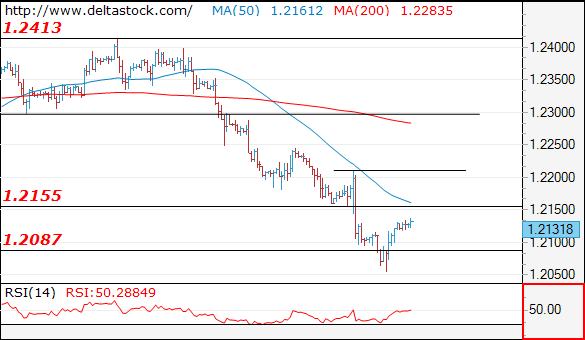
Current level - 1.2131
The reversal at 1.2060 signals a completion of the slide from 1.2210 and the bias is positive, for a test of the major hurdle at 1.2160. Crucial is 1.2210 and only a violation of the latter will neutralize the whole slide since 1.2413 peak.
| Resistance | Support | ||
| intraday | intraweek | intraday | intraweek |
| 1.2160 | 1.2412 | 1.2090 | 1.2090 |
| 1.2300 | 1.2560 | 1.2050 | 1.1930 |
 USD/JPY
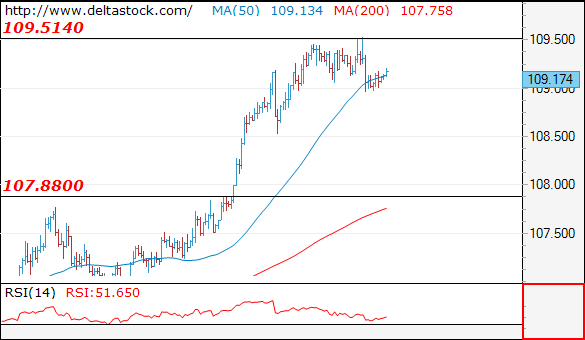
Current level - 109.173
The reversal at 109.50 signals a bearish bias, for a slide towards 108.50, en route to 107.90. Crucial is 109.50 peak.
| Resistance | Support | ||
| intraday | intraweek | intraday | intraweek |
| 109.50 | 110.20 | 109.00 | 106.60 |
| 110.20 | 111.90 | 108.50 | 104.60 |
GBP/USD
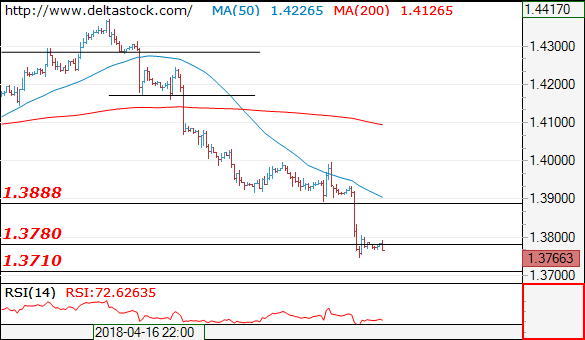
Current level - 1.3776
The downtrend is intact, heading towards 1.3710 low. The latter would provoke a reversal, for a rebound towards 1.3890.
| Resistance | Support | ||
| intraday | intraweek | intraday | intraweek |
| 1.3800 | 1.3990 | 1.3750 | 1.3710 |
| 1.3890 | 1.4100 | 1.3710 | 1.3620 |
EUR/AUD Daily Outlook
Daily Pivots: (S1) 1.5955; (P) 1.6004; (R1) 1.6040; More....
Fall from 1.6139 is seen as the third leg of the consolidation pattern from 1.6189. Deeper decline could be seen back to 1.5773 support, and possibly below. But downside should be contained above 1.5621 to bring rise resumption. On the upside, above 1.6139 will target 1.6189 high again.
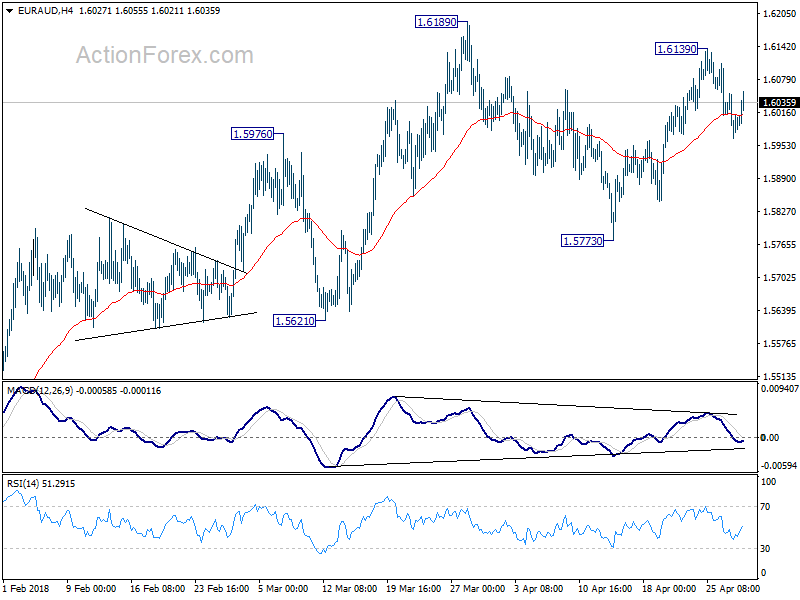
In the bigger picture, while there is bearish divergence condition in daily MACD, there is no clear sign of reversal yet. EUR/AUD also drew strong support from 55 day EMA and rebounded. Current rally from 1.3624 could still extend to 1.6587 key resistance (2015 high). Nonetheless, we'd expect further loss of upside momentum, and strong resistance from 1.6587 to limit upside and bring reversal. On the downside, sustained break of 1.5621 support should confirm reversal and turn outlook bearish for 1.5153 support and below.
The Dollar Is Firmer And Sidelines Immediate Risk Of Pullback At The Beginning Of Busy Week
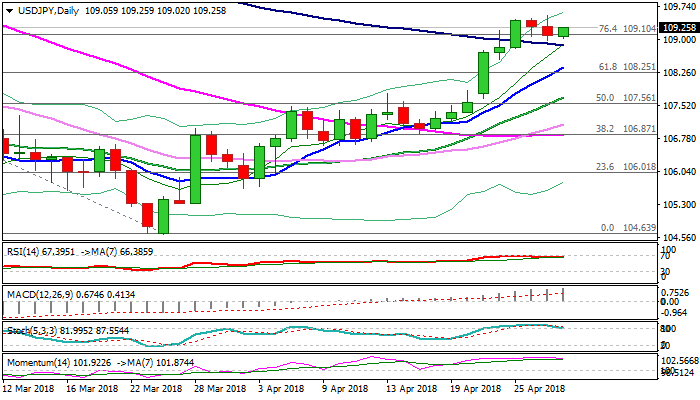
The dollar was firmer in early Monday's trading and sidelined immediate downside risk on break through 100SMA pivotal support (108.85) following past two day's close in red after strong rally showed signs of stall.
The greenback pulled back from new eleven-week high at 109.53, dragged by lower US yields which slipped from new high above 3%, but dips were so far shallow and failed to generate stronger reversal signal on overbought studies.
The pullback so far looks like consolidation of strong rally, with broader bullish bias expected to stay intact while 100SMA holds.
Progress in Korean peace talks keeps safe-haven yen under pressure, giving fresh momentum to the greenback.
Bullish daily techs are supportive, however, risk of pullback exists as slow stochastic is reversing from overbought territory.
Busy week is ahead and dollar will be looking for fresh signal from a number of economic indicators, scheduled this week.
Immediate focus turns on today's release of US PCE price index which is Fed's favorite inflation gauge, as FOMC two-day policy meeting starts on Tuesday.
Recent highs at 109.50 zone mark initial barriers, followed by 109.68 (Fibo 50% of 114.73/104.62 fall), break of which is needed to generate fresh bullish signal for attack at psychological 110.00 barrier and 200SMA (110.22).
Conversely, stronger bearish signal could be expected on firm break below 100SMA (108.85) which would expose strong supports at 108.42/37 (Fibo 38.2% of 106.61/109.53/rising 10SMA).
Res: 109.50, 109.68, 110.00, 110.22
Sup: 109.00, 108.85, 108.42, 108.25