

Sample Category Title
EUR/USD Continued Bearish Bias
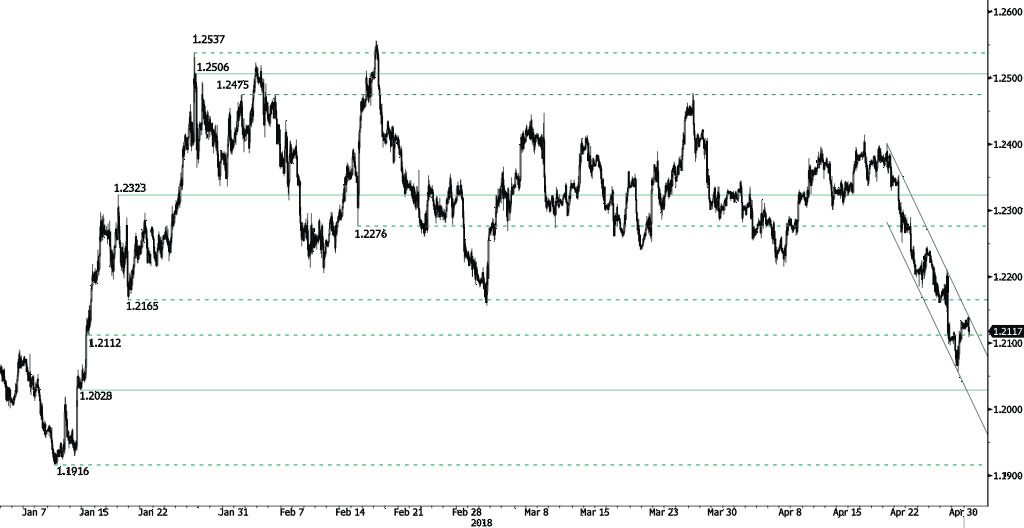
EUR/USD bearish pattern started from 1.24 (19/04/2018 high) continues, trading within downtrend channel. The pair is heading along the 1.2105 range. The pair is currently trading at mid-January 2018 low. Hourly support and resistance are now given at 1.2028 (11/01/2018 low) and 1.2323 (17/01/2018 high). The technical structure suggests further short-term downward trading moves.
In the longer term, the momentum is turning largely positive. We favor a continued bullish bias. Key resistance is holding at 1.2886 (15/10/2014 high) while strong support lies at 1.1554 (08/11/2017 low).
WTI Oil – Deeper Pullback Seen On Break Below $67.10 Base, But Overall Picture Remains Bullish
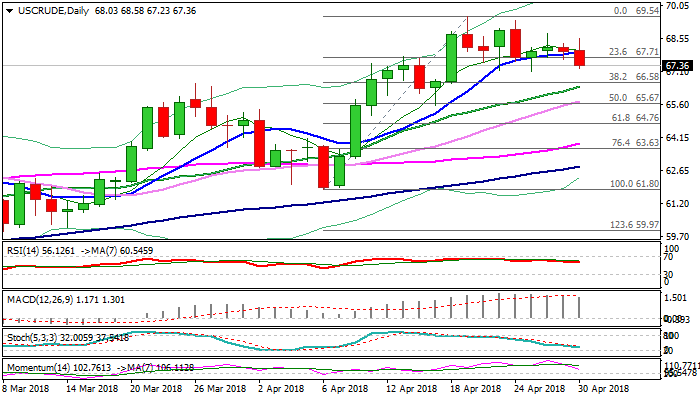
WTI oil holds in red at the beginning of the week and pressures pivotal supports at $67.10 base, where recent downside attempts were repeatedly rejected. Oil price came under fresh pressure after report released late Friday showed US drillers added five oil rigs previous week, increasing risk of sidelining overall bullish environment on firm break below near-term consolidation range floor. Investors are focusing on decision of the US administration regarding re-imposing sanctions against Iran, which could further shake global oil markets. From the technical point of view, firm bullish structure on daily chart has been dented, as today's extension lower broke below 10SMA, which contained dips during the past week and marking significant support (currently at $67.97). Eventual close below 10SMA would be bearish signal which needs confirmation on close below $67.10 base, to open way for further easing and test of next pivot at $66.58 (reinforced by rising 20SMA) and generate reversal signal on break. Adding to weakening bulls is south-heading 14-d momentum which moved lower from the highest since mid-January and falling daily RSI after forming bearish divergence on daily chart. Overall picture remains positive and consolidative/corrective action is likely to precede fresh push higher, as bulls eye target at $70 (psychological barrier) which was approached on recent rally that peaked at $69.54.
Res: 67.71, 68.58, 68.76, 69.00
Sup: 67.10, 66.58, 66.43, 65.75
Into US session: USD strong, GBP weak, a look at AUDCAD
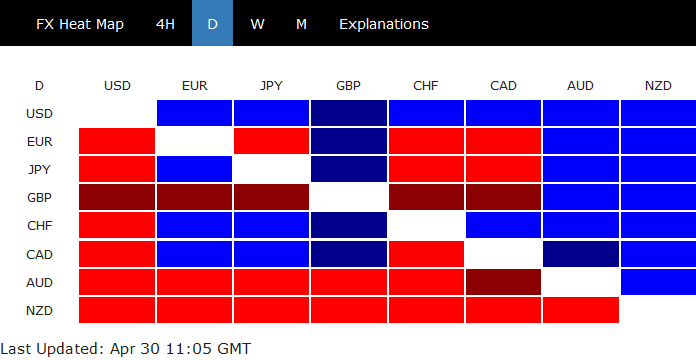
USD is trading as the strongest one heading into US session. But except versus GBP, USD is limited below Friday's high against all others. It's technical in consolidations for the moment. CHF is trading as the second strongest, followed by CAD.
NZD and AUD are trading as the two weakest ones. But to us, it's GBP's weakness that's more worth noting. It took out Friday's low against all others except AUD and NZD and is staying below that level. That is, GBP is extending recent decline.
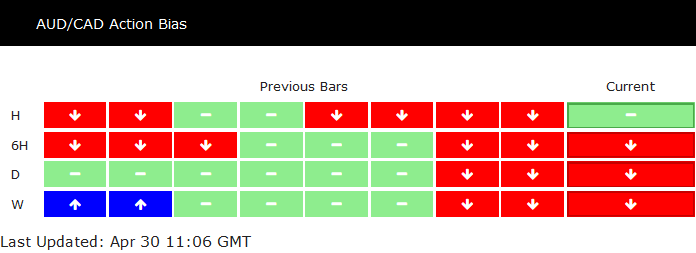
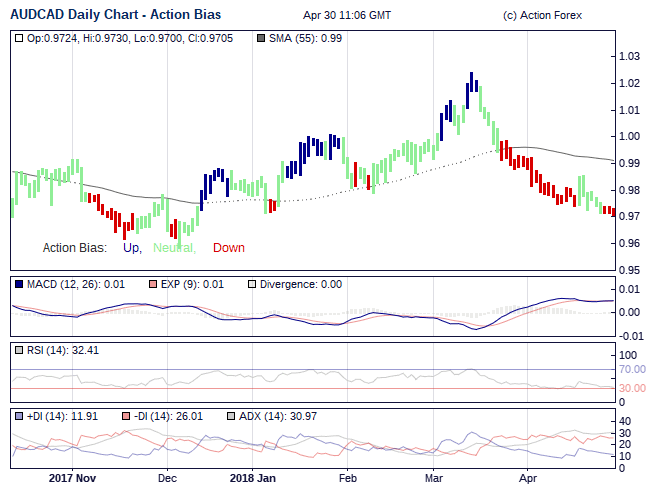
Nonetheless, the AUD is trading below Friday's low against CAD. And indeed, AUDCAD is also extending recent decline. AUDCAD action bias table shows that it's still staying in near term down trend. But from the D chart, its looks like the fall is slowing. There could be some support around 0.96 support level.
AUD/NZD 4H Chart: Guided By Junior Pattern
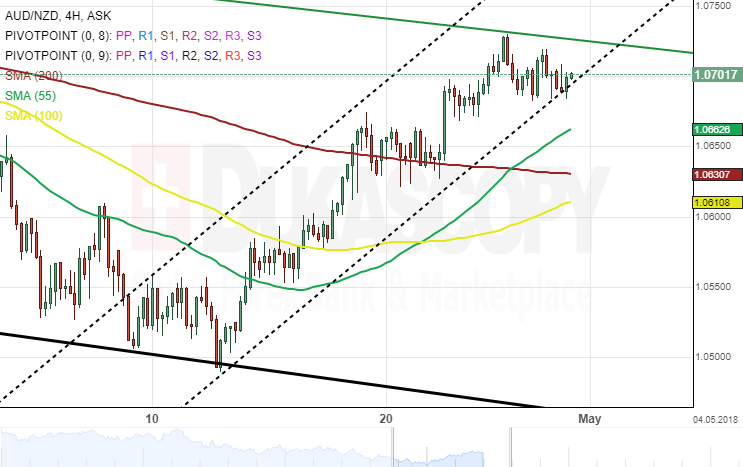
The Australian Dollar has been steered by a long-term descending channel against the New Zealand Dollar. However, the Aussie bounced off the lower boundary of the channel down on April 12 and has since surged against the Kiwi.
During the past few days, the currency pair has breached both the 200– hour simple moving average and the monthly pivot point at 1.0660. Meanwhile, a breakout through the bottom border of a junior pattern had occurred.
Given that a breakout has occurred, it is likely that the AUD/NZD currency pair should towards a potential target at 1.0660 or 1.0630 formed by the combination of the 55– and the 200– hour SMAs. In the meantime, technical indicators flashes buy signals.
EUR/GBP 4H Chart: Increases Trading Range
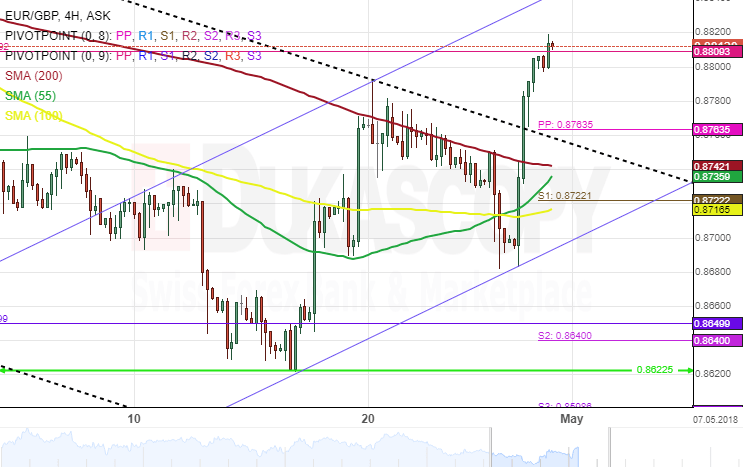
The single European currency is trading in several channels at the same time against the British Pound.
The junior pattern which has guided the pair during the past two weeks is the currency channel leading the currency movement upward. Its bottom border was tested on April 13 when the EUR/GBP exchange rate reversed from the 0.8622 mark. The pair has moved higher and a breakout through the upper boundary of a channel down had occurred.
Technical indicators favour that the pair might still appreciate during the following trading sessions. However, it is important to note that the monthly pivot point at 0.8809 could hinder the bulls from making further gains.
Gold Analysis: Sees Bearish Pressure
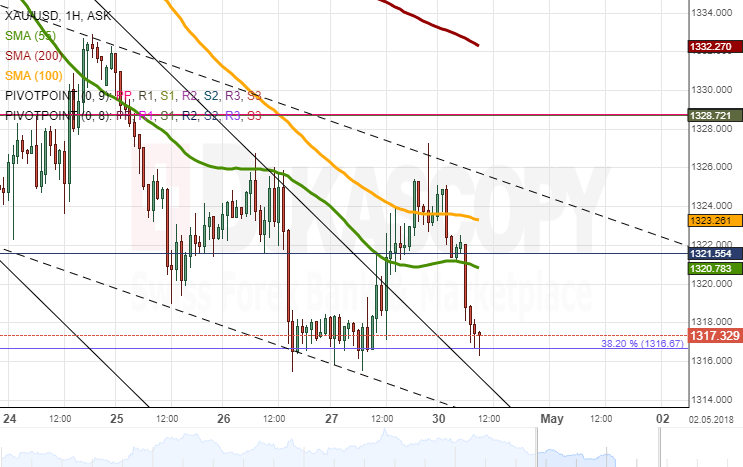
The yellow metal was guided by upside momentum on Friday. The pair accelerated mid-session as a result of which it surpassed the 55-hour SMA. However, the nearby-located 100-hour moving average and the upper boundary of a one-week channel halted any further attempts to move above the 1,325.00 mark.
Bears took over the market during the Asian session today, thus pushing the pair back below the aforementioned SMAs. Technical indicators suggest that this sentiment could be maintained in this session, as well. Thus, Gold is expected to fall down to the bottom channel line at 1,310.00.
Meanwhile, the first part of this week could mark a bullish recovery that should be followed by a test of the 200-hour SMA circa 1,335.00.
USD/JPY Analysis: Returns To 109.20
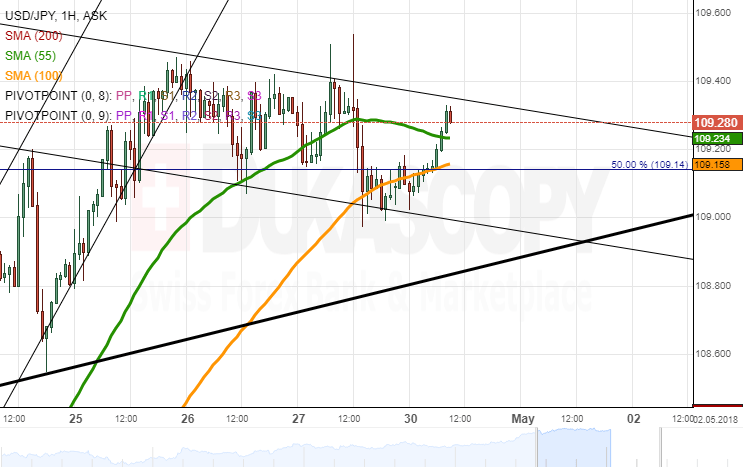
Despite some minor fluctuations, the US Dollar remained stable against the Yen on Friday. The pair breached the 55-hour SMA, but a further fall was limited by the 100-hour moving average.
The pair still remains trading in a short-term channel down; thus, it is more likely that the Greenback continues to edge lower in this session, as well, especially if the 55-hour SMA and the upper channel line are located nearby at 109.25. In case this cluster is surpassed, the next resistance barrier is the weekly R1 at 109.85.
Meanwhile, it is expected that the pair tries to reach the breached seven-week wedge. The nearest support is set by the weekly PP and the monthly R2 at 108.75. The same bearish sentiment is likely to prevail during the following sessions, as well.
EUR/USD Analysis: Tests 1.2140
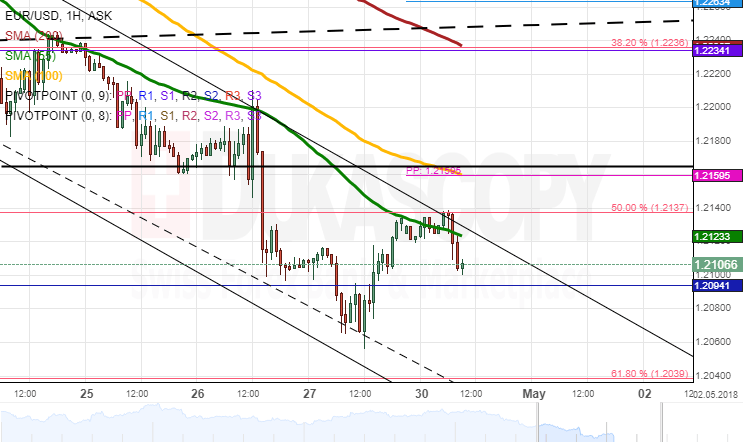
Following a few days of decline, the Euro finally recovered some losses against its American counterpart on Friday. The pair managed to appreciate limited 65 pips during the second part of the session until the combined resistance of the 55-hour SMA and the 50.0% Fibonacci retracement stopped any further advances.
Some upside potential could still be apparent on Monday morning; however, the 100-hour moving average, the weekly PP and the breached channel line circa 1.2160 are likely to stop this upward movement. Meanwhile, the expected fall should not exceed the 61.80% Fibonacci retracement and the weekly S1 at 1.2035.
By and large, the general trend for this week should remain north towards the psychological 1.23 mark.
GBP/USD Analysis: Plunges After Sluggish GDP Report
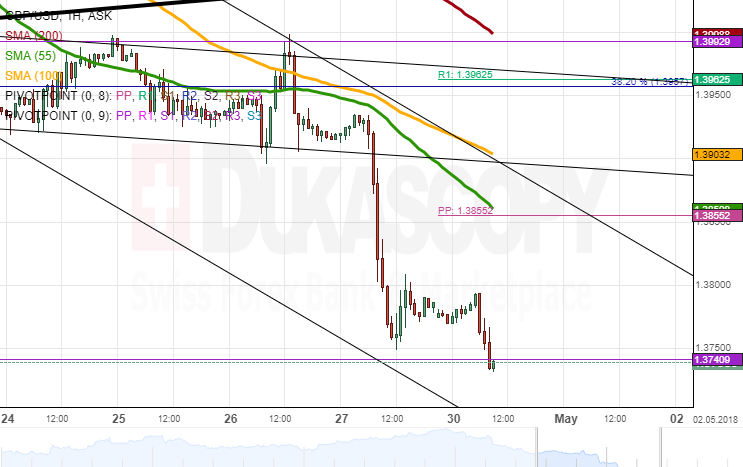
GBP/USD experienced another day of weakening on Friday. After failing to surpass the 55– and 100-hour moving averages near 1.3950 early in the day, it began falling.
Additional bearish pressure was provided by the disappointing UK GDP release as a result of which the Pound lost 171 pips against the US Dollar and stopped slightly above the monthly S1 at 1.3750.
During the subsequent hours the Pound was trading sideways in a very narrow range. This demonstrates that the bearish sentiment might have finally allayed, thus allowing for a move northwards in this session. It is expected that the daily high should be the 1.39 mark which is reinforced by several noteworthy resistance levels.
In terms of support, the pair is unlikely to fall below the weekly S1 at 1.3679.
The Greenback Extends Gains Ahead Of Key Week
USD keeps positive momentum ahead of key week
On Monday morning, the US dollar consolidated last week’s gains, while crude oil slid further and equities inched higher. On a trade-weighted basis, the buck rose more than 1% last week and reversed the negative momentum in which it was stuck for the last of months, thanks to a continuous surge in US treasury yields. Looking ahead to this week, there are many economic data releases. The show will start today with the Fed’s favourite gauge of inflation, the core PCE. Headline personal consumption expenditure is expected to have slightly accelerated in March, with median forecast at 2%y/y compared to 1.8% in the previous month. The core measure should print at 1.9% versus 1.6% in February. Personal income and spending should both come in at 0.4%m/m. An upside surprise in the former could definitely trigger another USD rally as it would send a positive signal about the US economic outlook and especially growth and inflation.
In the FX market, the Australian dollar and the New Zealand dollar were the worst performer this morning as investors discount further a tightening move from both Reserve Bank. AUD/USD erased Friday’s gains and returned to $0.7550, while the Kiwi slid to $0.7060, down 0.35% on the session.
After falling 2.8% last week, EUR/USD bounced back 0.60% last Friday and traded sideways on Monday. Even though we believe the ECB will act with caution in its monetary policy tightening, we are having a hard time seeing the single currency much lower. It is true that the Fed is much more advanced in its tightening cycle, but the ECB has much more in reserve.