Sample Category Title
Gold Maintains Weak Bias In Near Term, Broader Trend Is Neutral Since January
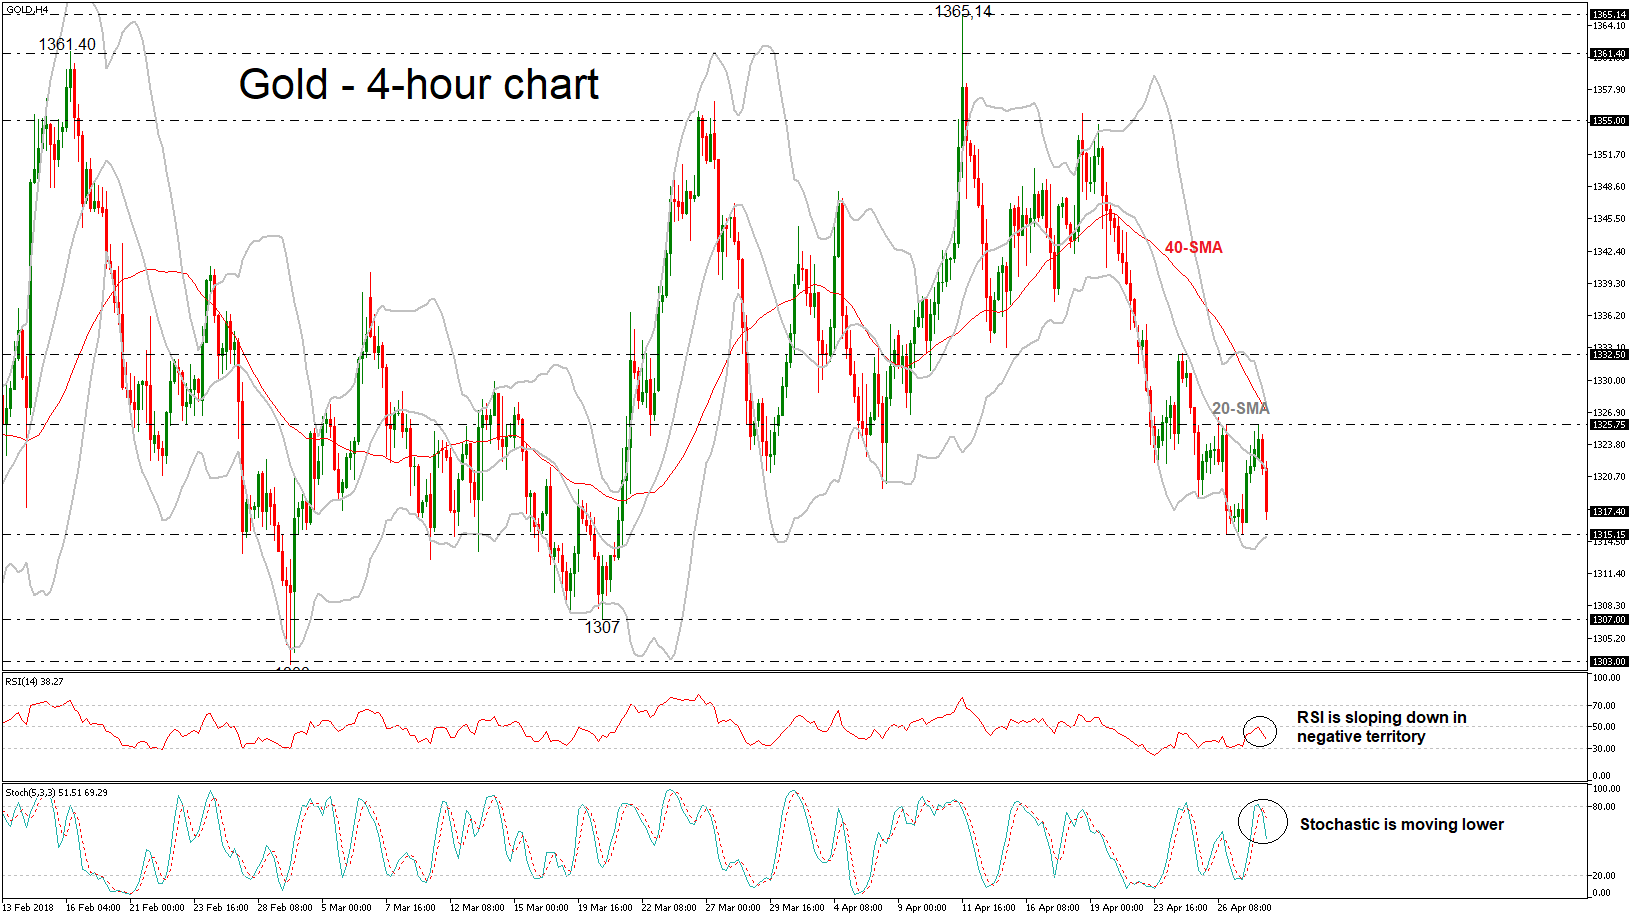
Gold has plummeted during today's European session after the bounce off the 1325.75 resistance level. It is worth mentioning that the price has been trading within a trading range since January 25 with the 1365 resistance level being the upper boundary and the 1307 support level the lower boundary as it lacks a clear trend.
Technically, in the 4-hour chart, the RSI indicator is sloping to the downside and is approaching oversold levels, while the stochastic oscillator posted a bearish cross within the %K line and the %D line, signaling further downside pressure.
In the wake of negative pressures, and a drop below the lower Bollinger band, which overlaps with the 1315.15 support level, the market could meet 1307. A successful close below this level could see a break of the consolidation zone and drive the precious metal lower towards 1303.
However, if prices are able to break above the 20- and 40-simple moving averages in the short-term near 1321.30 and 1327.70 respectively in the next few sessions, the risk would shift to the upside, specifically towards the 1332.50 resistance level.
Forex Analysis: Gold And EURGBP
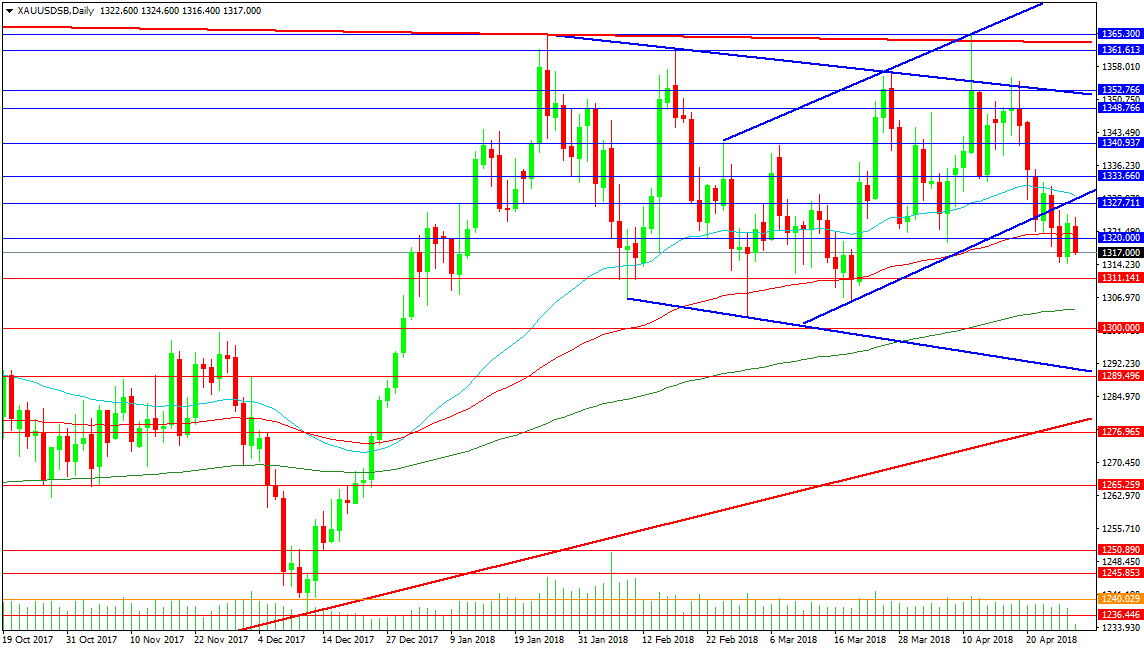
Gold fell back from the 50 DMA at 1329.00 and has spent the last couple of trading sessions consolidating around 1320.00 and the 100 DMA at 1321.00. Support can be found at last week’s lows of 1314.50, followed by 1311.14 and the 200 DMA at 1304.35. The low point between the double top is at 1302.40 and a loss of this level technically sets up a test of the 1240.00 area. However, there is strong support at 1300.00, with the falling trend line support also pointing to 1290.00. The long-term red supportive trend line at 1280.00 could also prevent a sell-off.
Should the price bottom and turn higher from current levels, the 1333.60 level has been used as a median area between the highs and lows. A break above potentially puts gold bulls back in control, but many of the weaker moves higher have topped out around 1341.00, with stronger moves making it above 1350.00 but failing ahead of 1365.30. A break above this level could see a rapid move to 1375.00, followed by 1390.00 and even 1400.00.
EURGBP
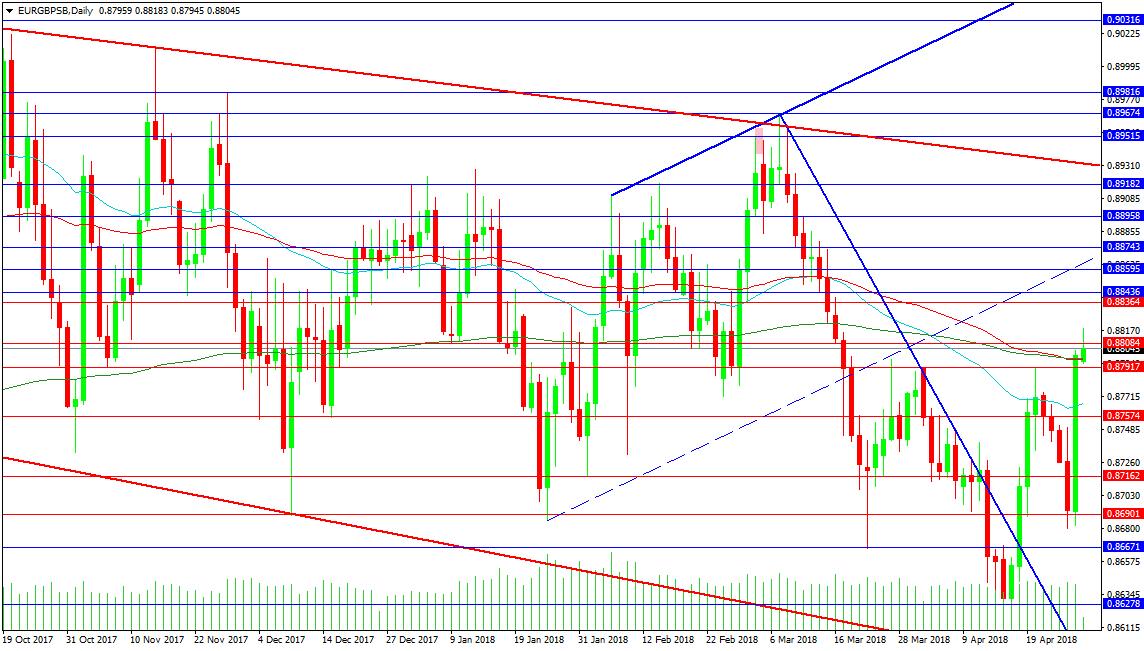
This currency pair has broken out higher above its combined 100 and 200 DMA at 0.87978. Friday’s candle is eye-catching and presents long positions with a tailwind to drive price higher. The candle also broke above an inverse head and shoulders pattern neckline at 0.87917, and it is possible that this will lead to higher levels, with a target of 0.89500. This would result in a move above the red trend line at 0.89310 and target a retest of recent highs above 0.90000.
Support can be found at the 50-period DMA at 0.87665 and the 0.87574 area. The next area of support comes at 0.87162 and extends down to 0.86900. A break below the recent lows around 0.86275 would target the falling trend line support at 0.85785, containing the red and blue trend lines today.
AUDUSD Holds In Red On Monday And Threatens To Offset Positive Signals From Friday’s Bullish Close
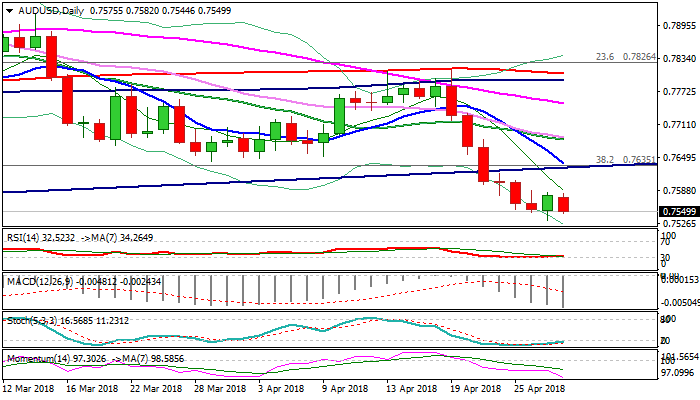
The Aussie dollar accelerated lower on Monday and threatens to fully retrace Friday’s recovery ( Friday’s close was the first positive daily close after six straight days in red).
Better than expected Chinese Mfg / non-Mfg data on Monday did not impact the Aussie which returned to red and signals that steep fall from 0.7810 double-top might extend.
Bearish daily techs support the notion, as bullish signals from slow stochastic reversing from deep oversold territory had minor impact so far.
Key support at 0.7500 (08 Dec low) remains in focus, as break here would spark fresh bearish acceleration on confirmation double-top on weekly chart (0.8124/35).
Strong barriers at 0.7630/40 zone (broken bull-trendline off 2016 low at 0.6826 / falling 10SMA / weekly cloud base) are expected to limit extended corrective attempts and keep strong bearish stance intact.
Res: 0.7583, 0.7606, 0.7630, 0.7641
Sup: 0.7532, 0.7500, 0.7477, 0.7420
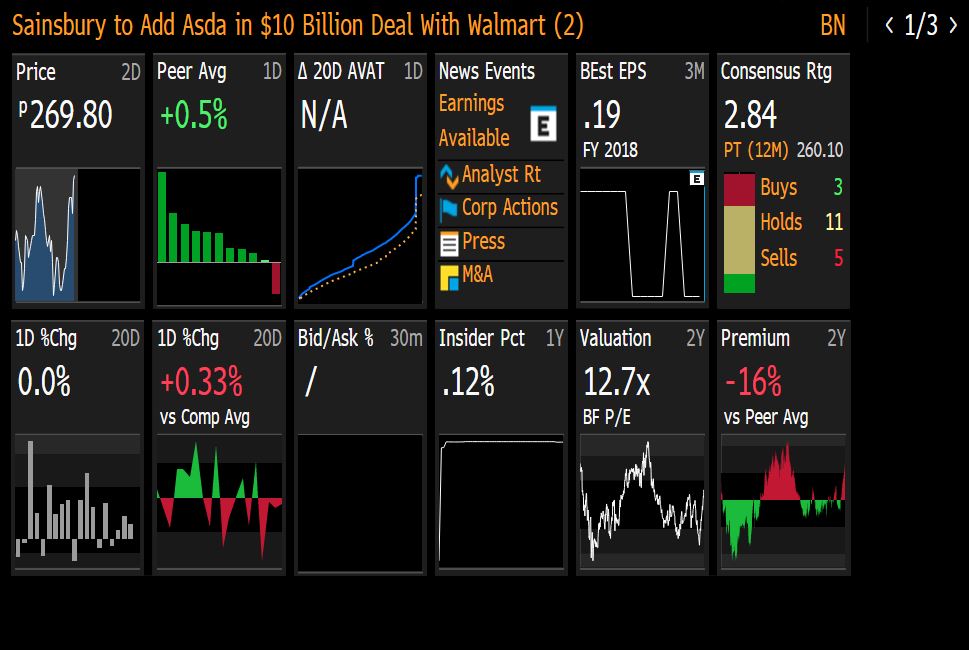
Walmart And Sainsbury Merged
We have seen thousands of job losses because of the price squeeze
Sainsbury is more famous among affluent customer
Discount grocers made the business for the supermarkets even tougher and now these supermarkets have started to respond. J Sainsbury and Walmart agreed to merge together to fight the intense competition in the market. Of course, it is Walmart which hold the biggest shareholder position in the combined entity.
With this merger, the combined entity would not only be in a better position to fight the German discounters such as ALDI and Lidl but also Amazon’s recent move in the grocery space. The entity’s combined value of £5.9 billion also threatens the UK's largest market shareholder firm in this space called Tesco, which is far larger than the Teso Plc.
The clear benefits of combining the two firms appear in the scale benefit arena, however, the question which will remain unanswered is if the combined entity is going to take on discount hunters.
In the supper market space, we have seen thousands of job losses because of the price squeeze. In order to achieve the most efficient model, both brands have to come up with a strategy under which they are not focusing on their own brand advertisement. Remember that Sainsbury is more famous among affluent customers and it has the second biggest shareholding in the market. Asda, part of Walmart group, has a stronghold in North of England and the shoppers in Asda are on a more tighter budget.
Tesco has certainly changed its game after restructuring and one can see the signs of recovery and with a combined entity – Sainsbury and Walmart, the combined retailer would help it with greater clout with the supplier
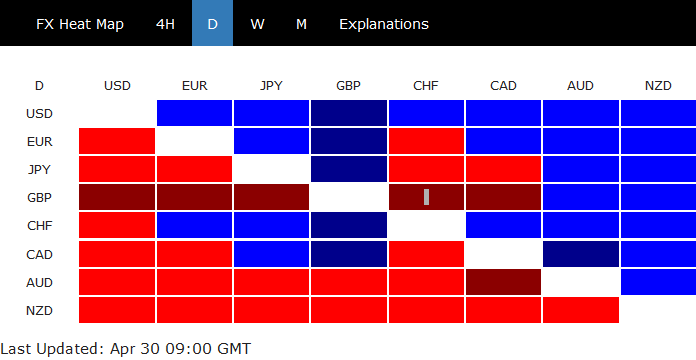
Fresh selling in GBP as led by EURGBP, then GBPUSD
Fresh selling is seen in GBP as it breaks Friday's low against all but AUD and NZD.
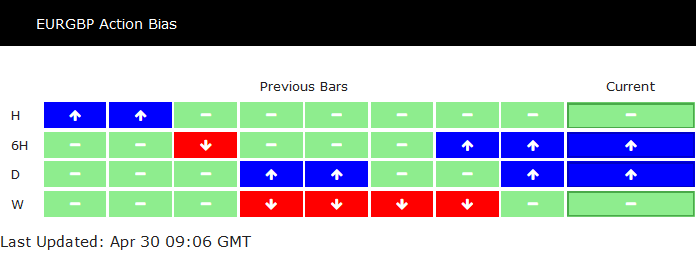
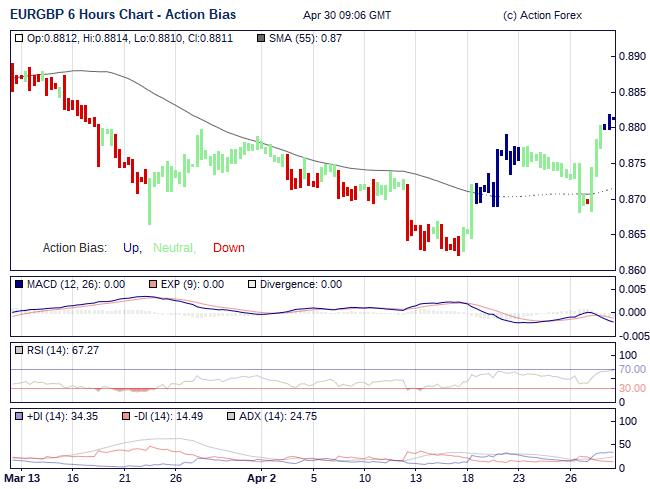
EUR/GBP led the way higher earlier as rebound from 0.8620 resumed. 6H action bias turned upside blue earlier after stabilizing above 0.8790 resistance. H action bias is a bit slower in response to today's rise. H action bias turning upside blue later in European session will affirm affirm underlying momentum.
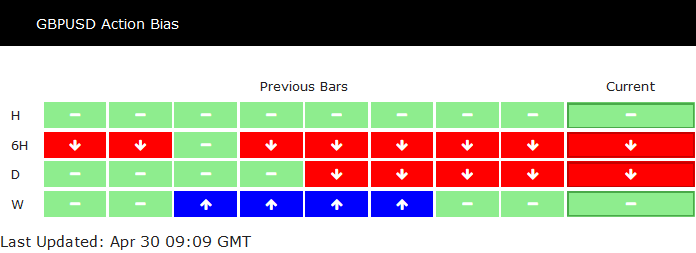
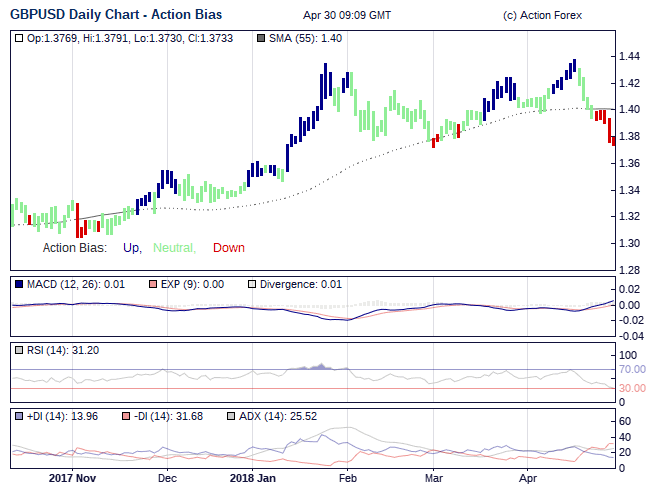
GBP/USD 6H action bias remains all the way downside red, together with downside red D action bias. Clearly, the near term decline is in healthy state to 1.3711 support.
GBPUSD Downtrend Below 1.3860
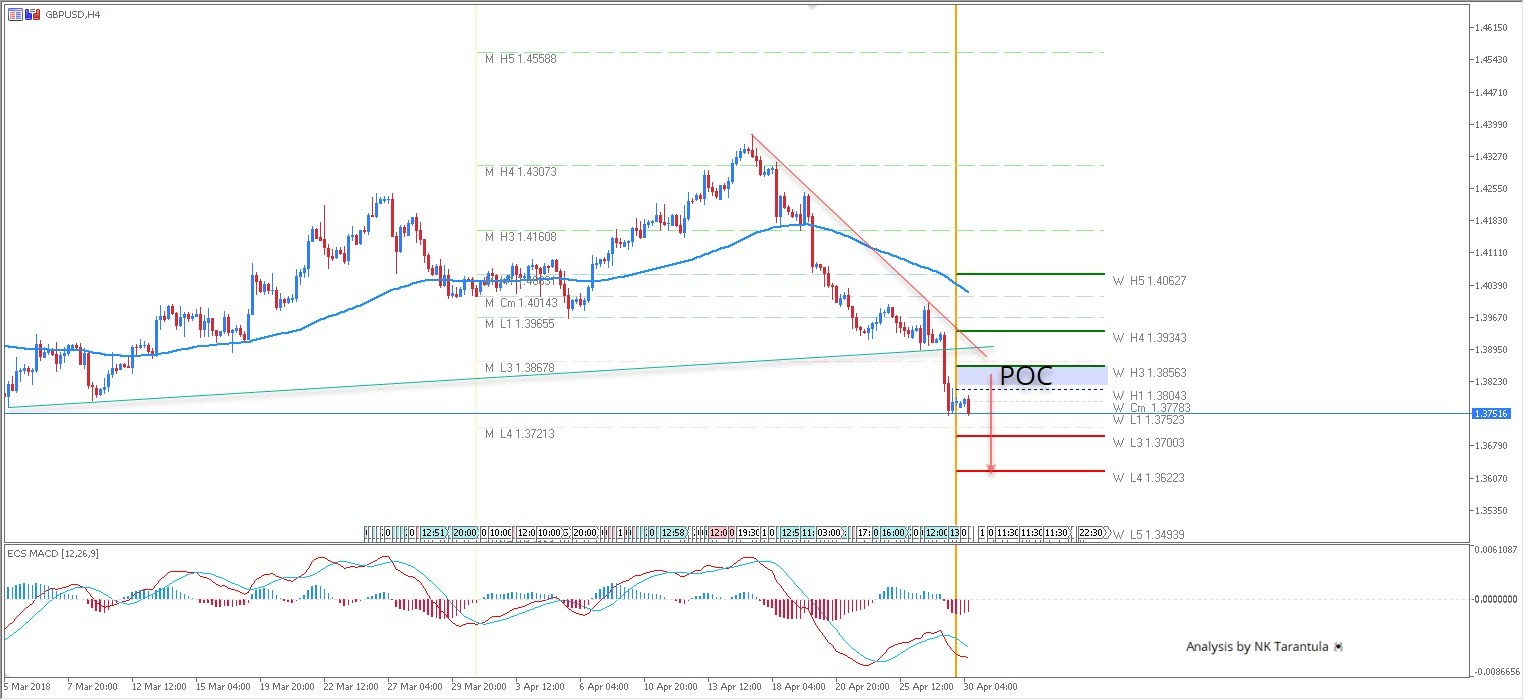
The GBP/USD has formed a bearish breakout pattern below the green trend line and at this point we see a continuation of down trend. If the price gets within 1.3825-55 we might see another drop and now moment sellers. However a continuation below 1.3750 should pull the price towards 1.3720 and 1.3700. Around 1.3700 we might see now moment buyers. 4h close below 1.3700 targets 1.3622. However, the 4h candle close above 1.3860 might negate bearish scenario.
W L3 - Weekly Camarilla Pivot (Weekly Interim Support)
W H3 - Weekly Camarilla Pivot (Weekly Interim Resistance)
W H4 - Weekly Camarilla Pivot (Strong Weekly Resistance)
M H4 - Monthly Camarilla Pivot (Very StrongMonthly Resistance)
ML3 – Monthly Camarilla Pivot (Monthly Support)
ML4 – Monthly H4 Camarilla (Very Strong Monthly Support)
POC - Point Of Confluence (The zone where we expect price to react aka entry zone)
USD/JPY Builds 4 Correction Before Hitting 110 Resistance
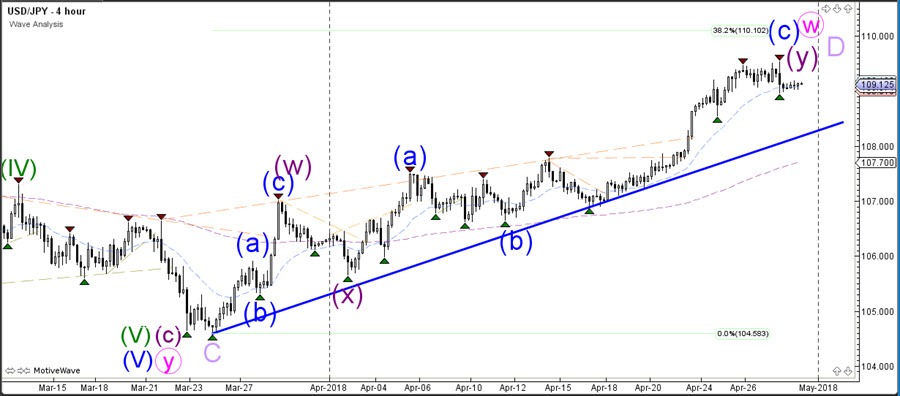
The USD/JPY bullish momentum could make one more push up towards the psychological round level of 110, which is also a 38.2% Fibonacci level of the potential wave D (light purple). This could be a resistance zone where price completes a wave W (pink).
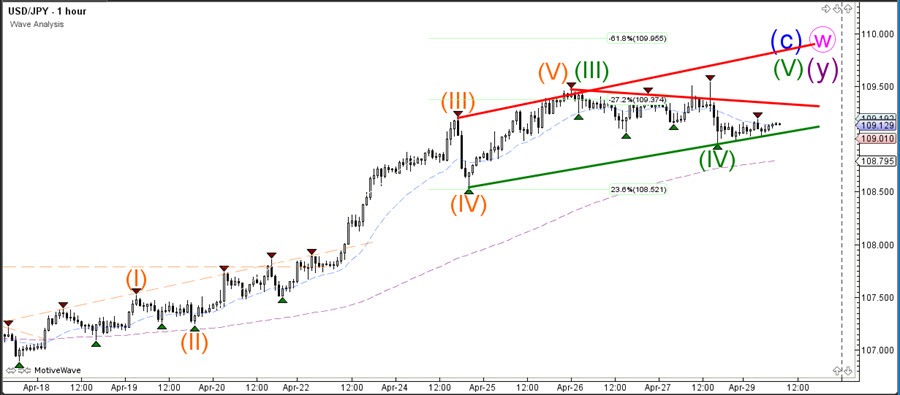
The USD/JPY is currently building a wave 4 (green) correction. Price could extend the wave 4 correction towards 108.50 for instance before starting the wave 5. A bullish breakout above resistance (red) could also start wave 5.
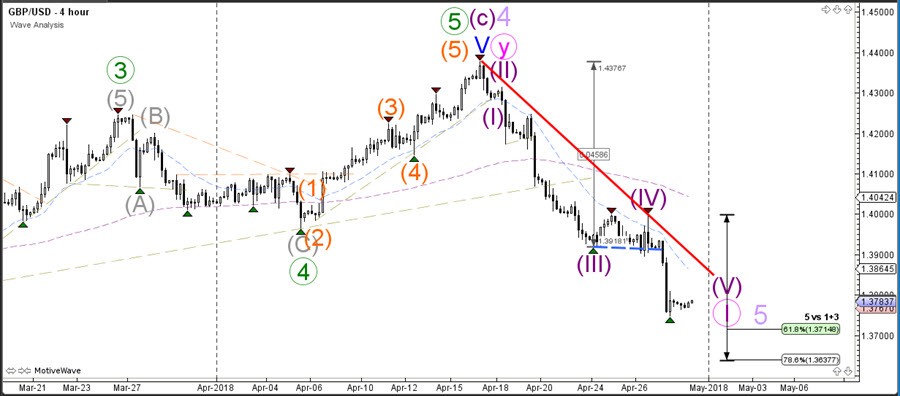
GBPUSD Bearish Wave 5 Reaches 1.3750 Support Zone
The GBP/USD bearish momentum is strong and price is most likely building a wave 1 (pink).Price seems to be finalizing a final bearish wave 5 (purple) within that wave 1 (pink) but eventually a bullish correction within wave 2 (pink) is probable.
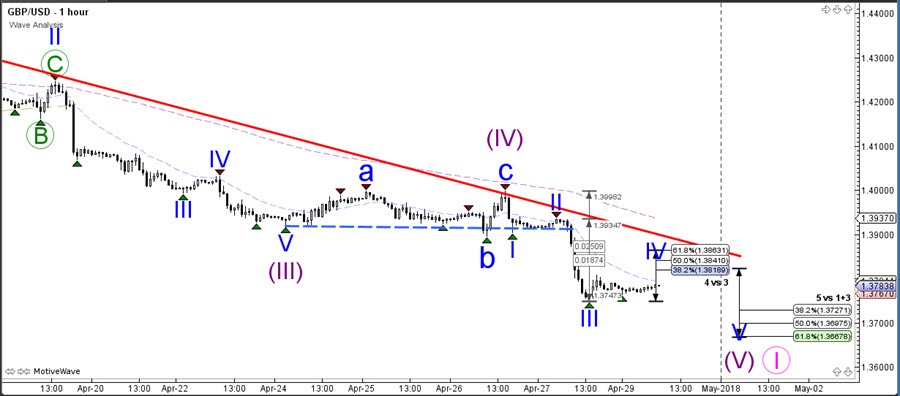
The GBP/USD is probably showing a bearish continuation in the final wave 5 (pink) of wave 1 (pink). Price could show one more lower low and build a bearish wave 5 (blue). The 5th wave could become extended or make a bullish bounce, which is probably dependent on the GBP and USD news events later this week.
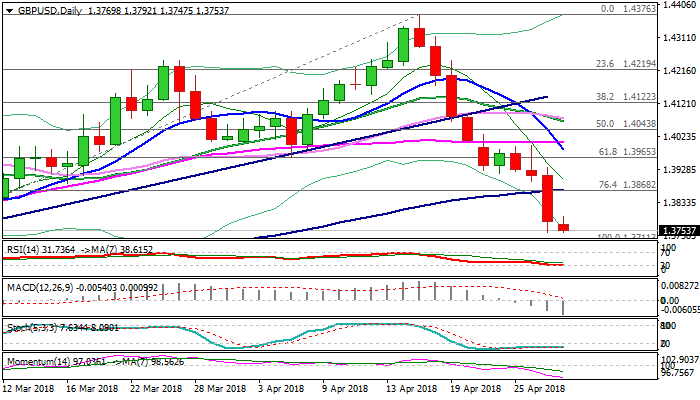
GBPUSD – Bears Eye Target At 1.3711 And Main Bull-Trendline At 1.3650
Cable stands at the back foot on Monday and pressures Friday's low at 1.3746, following narrow consolidation in Asia.
Friday's long bearish candle weighs, with negative sentiment being underpinned by weak GDP data which further diminished expectations for BoE rate hike in May.
Daily techs show rising bearish momentum, with MA's in firm bearish setup, keeping focus at key s/t support at 1.3711 (01 Mar low) and main bull trendline drawn from post-Brexit lows at 1.3650. Meanwhile, the pair may show hesitation ahead of 1.3711 target and hold in extended consolidation as slow stochastic is deeply oversold on daily chart.
Limited upside is expected, with extended upticks to be capped by broken 100SMA (1.3870) and catalyst needed to signal stronger recovery and sideline persisting downside threats.
Res: 1.3792, 1.3840, 1.3870, 1.3901
Sup: 1.3746, 1.3711, 1.3650, 1.3613
EURUSD Still Bearish Despite Bounce
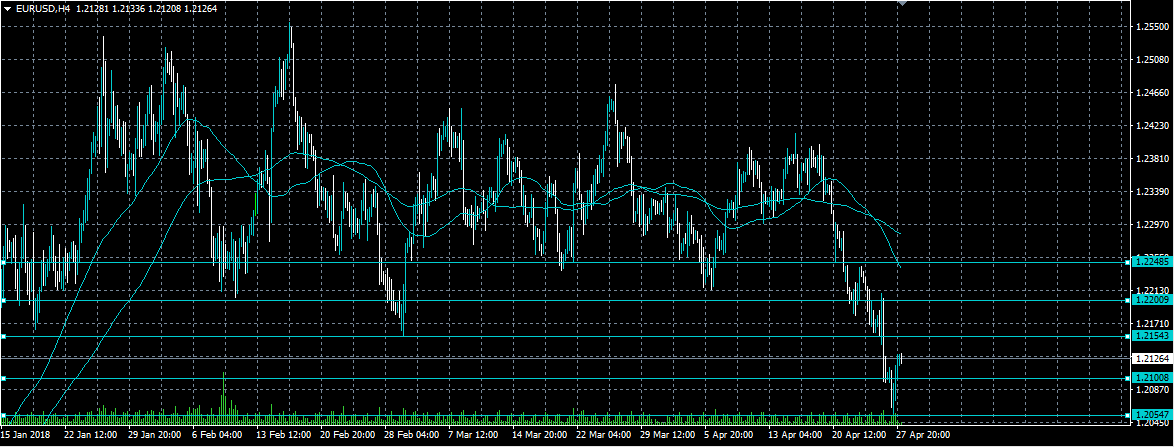
The euro currently trades above the 1.2100 handle against the U.S dollar as the new trading week gets underway, following a strong bounce higher from the 1.2054 level. The EURUSD pair currently trades around the 1.2120 level, after benefitting from a round of profit taking in the U.S dollar on Friday. EURUSD traders are likely to focus on the key 1.2154 resistance level, and the release of the U.S Core PCE Price Index, which is a key U.S inflation metric the Federal Reserve watches closely.
The EURUSD pair remains bearish while trading below the 1.2154 level, key technical support is now found at the 1.2100 and 1.2054 level.
Should the EURUSD pair start to trade back above the 1.2154 level, buyers may be inclined to test the 1.2200 and 1.2248 resistance levels.