
Sample Category Title
USD/JPY: US Dollar Bounce Against Yen May Face Headwinds Soon
- Uncertainties over global growth due to US trade tariffs have triggered the recent rebound seen in the USD/JPY ahead of BoJ & FOMC monetary policy meetings.
- The 2.2% bounce of the USD/JPY from its 11 March low is now fast approaching a key medium-term resistance zone of 150.70/151.50.
- The downward trajectory of the 10-year & 2-year yield spreads of US Treasuries/JGBs is likely to support a medium-term downtrend phase of the USD/JPY.
This is a follow-up analysis of our prior report, “USD/JPY: Yen strength elements emerged ahead of BoJ meeting next week” dated 16 January 2025.
Since our last publication, the price actions of the USD/JPY have transformed into a three-month medium-term downtrend where it tumbled by around 8% from its 10 January 2025 high of 158.88 to its recent 11 March low of 146.54.
The recent three-month Japanese yen strength against the US dollar has been supported by hawkish remarks from key Bank of Japan (BoJ) officials including Governor Ueda that guided BoJ’s third rate hike on 24 January to increase its key policy interest rate to 0.5%.
Also, economic data in the past two months have supported BoJ’s current monetary policy stance of “gradual increases in interest rates” as Japan’s core-core inflation rate (excluding food and energy) accelerated to 2.5% y/y in January, its highest rise since March 2024, above BoJ’s price target of 2%.
Secondly, wage growth for Japanese employees has moved in line with BoJ's outlook as well. Last Friday, Rengo, the largest Japanese Trade Union Confederation announced in its preliminary report that its members have secured pledges from companies of an average 5.46% rise in wages for the 2025 fiscal year starting from April, the biggest wage rise in 34 years, and above last year's increase of 5.28%.
Aggressive US trade tariffs policy created uncertainty in Japan’s growth prospects
The recent outlook on Japan’s inflation and wage growth trend has triggered a swift rally in longer-term sovereign bond yields in Japan. The 10-year Japanese Government Bond (JGB) yield has risen to 1.50%, its highest level since 2008.
Given the rapid rise in the 10-year JGB yield that is likely to increase funding costs in Japan coupled with the rising risk of slower economic growth globally due to the US White House’s aggressive trade tariffs policy, market participants expect BoJ to stand pat on Wednesday, 19 March monetary policy decision and await for BoJ Governor Ueda’s latest guidance with the likelihood of another rate hike to be enacted in June or July according to consensus at this time of the writing.
Narrowing US Treasuries-JGBs yield spreads support further JPY strength
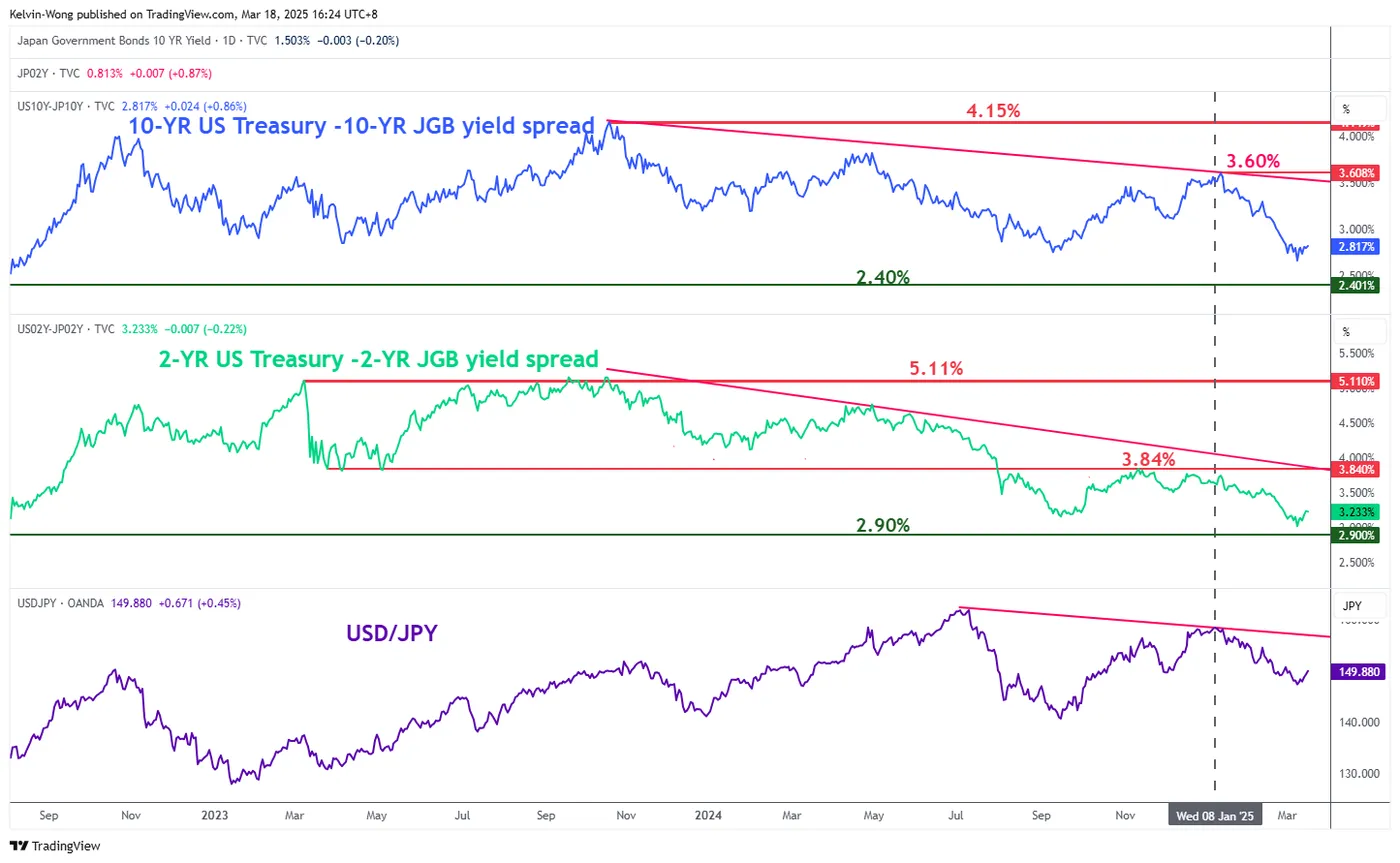
Fig 1: 10-YR & 2-YR yield spreads of US Treasuries/JGBs medium-term trends as of 18 Mar 2025 (Source: TradingView, click to enlarge chart)
The 10-year and 2-year yield spreads of the US Treasury notes over JGBs have continued to narrow (trended downwards) after they hit key pivotal resistances of 3.60% and 3.84% respectively in early January.
If their downward trajectory remains intact where the 10-year and 2-yield spreads of the US Treasury notes over JGBs may see further downside towards 2.40% and 2.90% respectively, which in turn may trigger further downside pressure on the USD/JPY (see Fig 1).
Watch the key resistance of 150.70/151.50 on USD/JPY
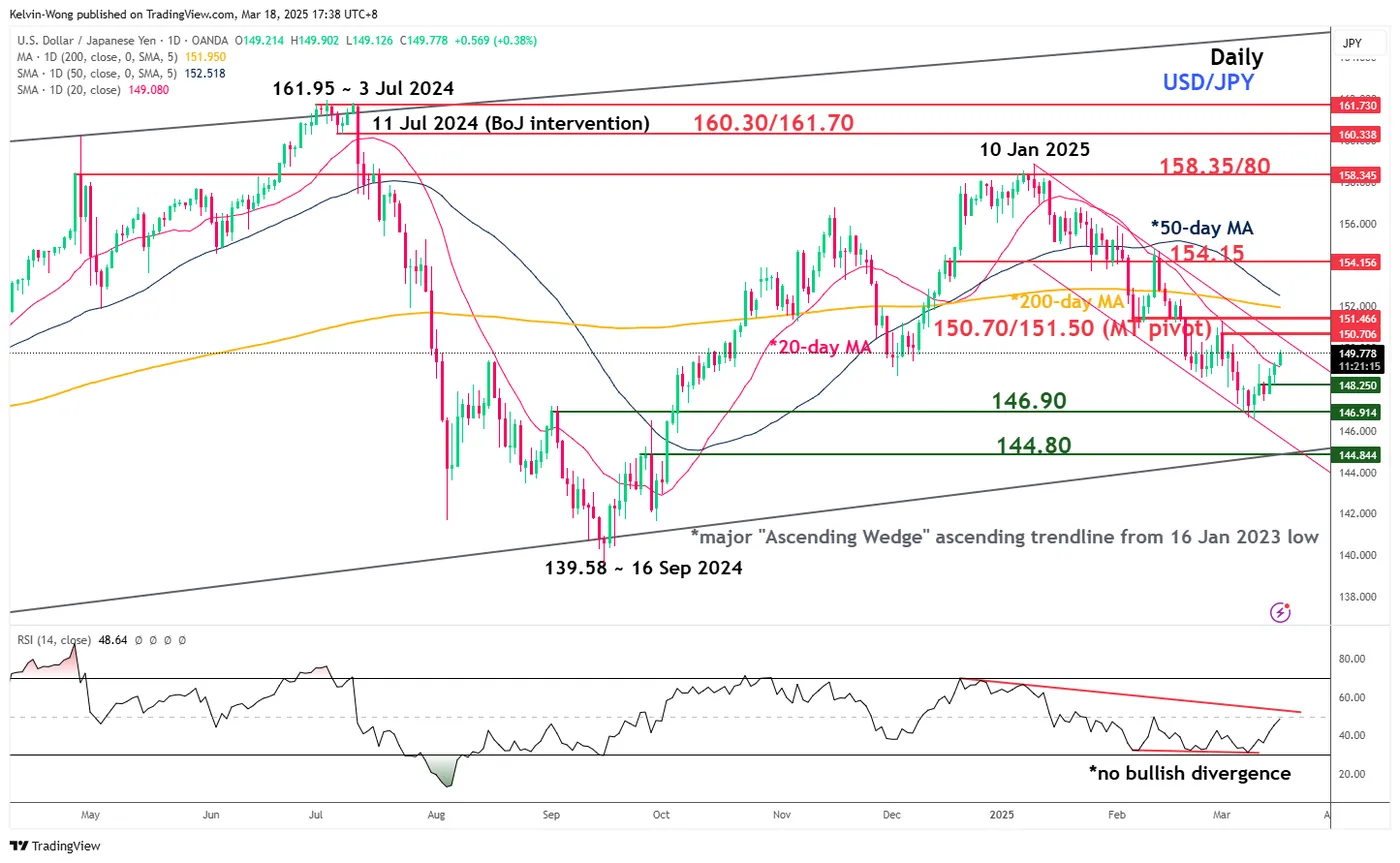
Fig 2: USD/JPY medium-term trend as of 18 Mar 2025 (Source: TradingView, click to enlarge chart)
The recent rebound of 2.2% in the past five sessions seen in the USD/JPY from its intraday low of 146.54 on 11 March to its current level of 149.80 at this time of the writing is likely to be a minor corrective rebound sequence within a medium-term downtrend phase.
Watch the 150.70/151.50 key medium-term pivotal resistance and a break below 148.25 intermediate support may trigger another impulsive down move sequence to retest 146.90 before the next medium-term support comes in at 144.80 (see Fig 2).
On the other hand, a clearance above 151.50 invalidates the bearish scenario for a squeeze up toward the next medium-term resistance at 154.15.
Gold Prices Hit Record Highs: New Milestones Ahead
On Tuesday, the price of Gold surged to an unprecedented 3,013 USD per troy ounce, marking a new all-time high. This milestone follows a prolonged upward trend, driven by heightened investor demand for safe-haven assets ahead of the US Federal Reserve's decision on interest rates.
Key Drivers Behind Gold's Rally
The Federal Reserve's two-day meeting, which began today and concludes Wednesday evening, is the focal point for investors. While the base scenario suggests the Fed will maintain current interest rates, market participants are closely watching for updated economic forecasts and insights from Chair Jerome Powell's press conference. His remarks could explain future monetary policy, particularly amid ongoing trade tensions and tariff disputes.
Geopolitical uncertainties are also fuelling Gold's ascent. On Monday, US President Donald Trump issued a stern warning to Iran, holding it directly accountable for any further attacks by Yemen's Houthi rebels. The group has threatened to target foreign vessels in the Red Sea, including those of the US.
Additionally, Trump announced plans to hold talks with the Russian president on Tuesday morning to discuss a potential ceasefire, further adding to the global uncertainty driving investors toward Gold.
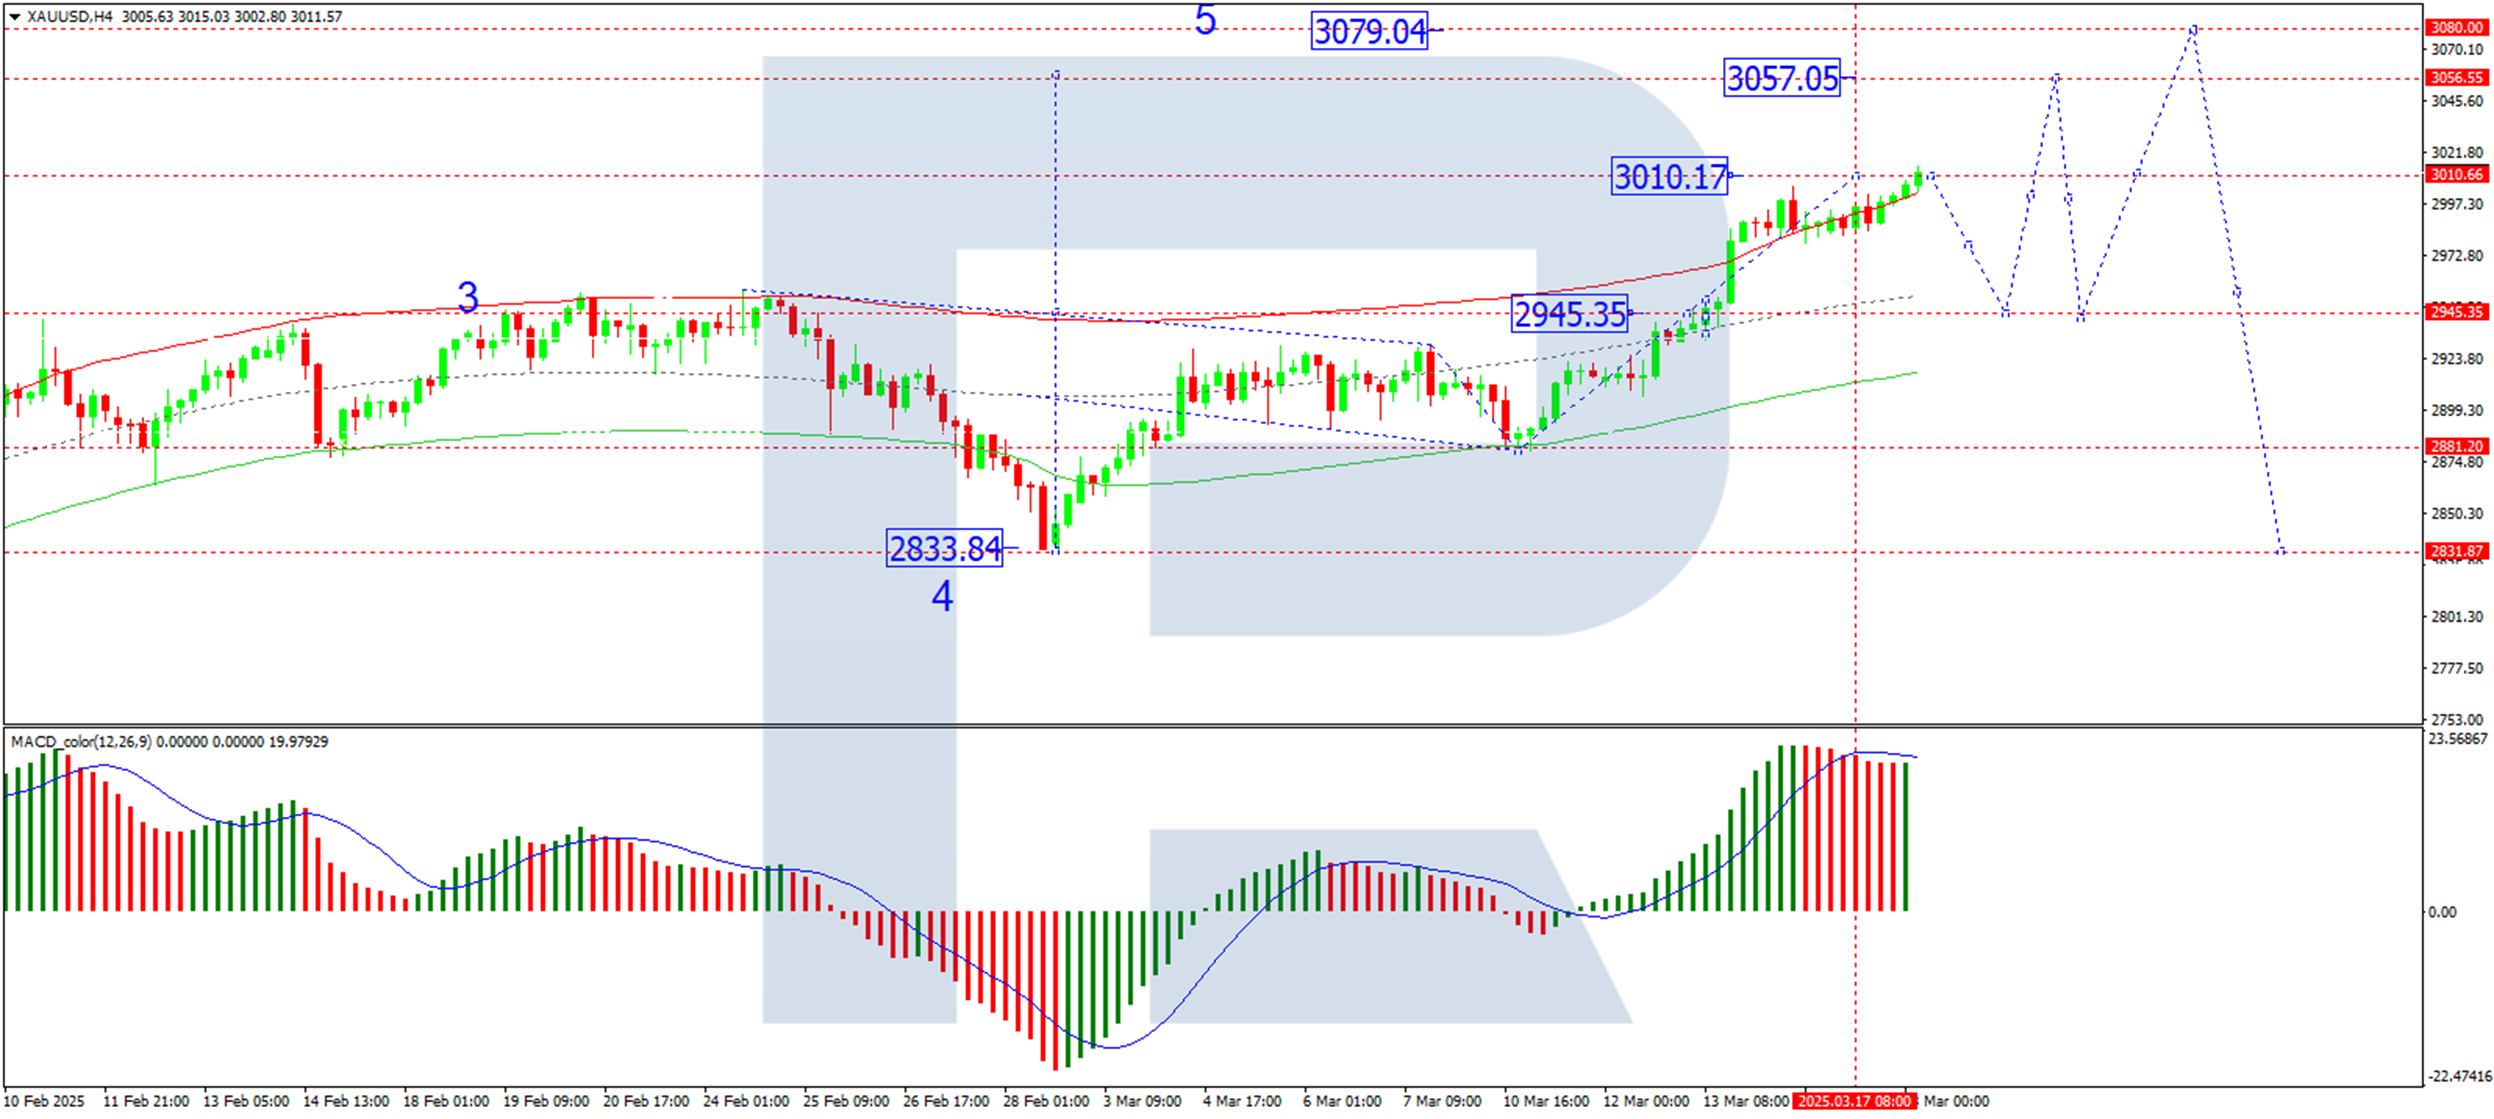
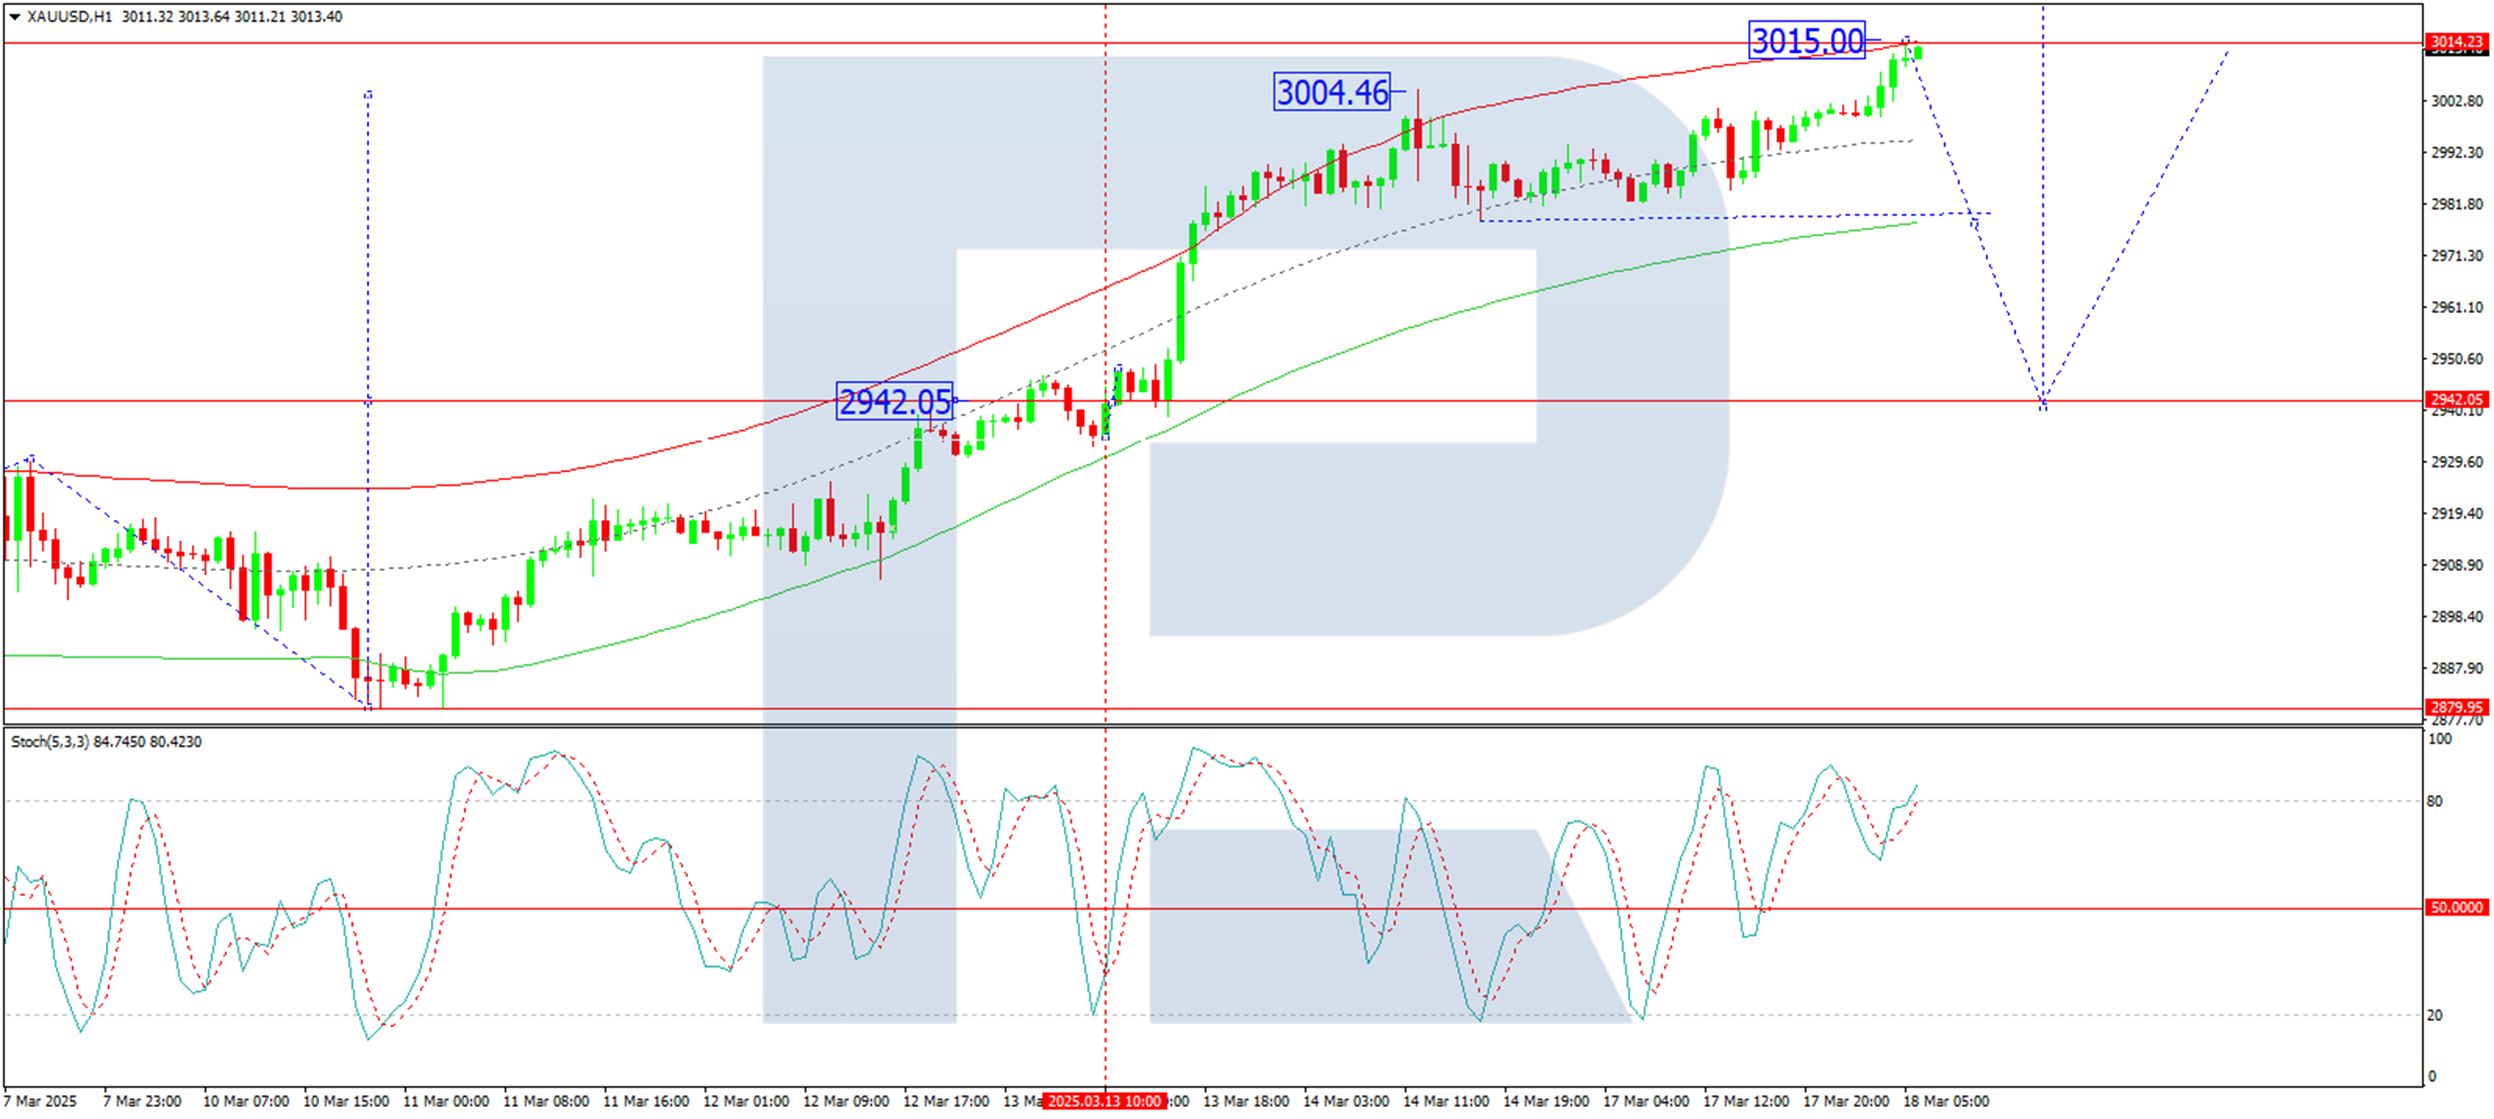
Technical Analysis of XAU/USD
On the H4 chart, XAU/USD has formed a tight consolidation range around the 2,945 level, signalling the continuation of an upward growth wave. Today, we anticipate the price to test the 3,010 level, which serves as a local target. Following this, a corrective pullback toward 2,945 (testing from above) is possible. Once this correction concludes, we expect a new growth wave targeting the 3,057 level. This scenario is technically supported by the MACD indicator. The signal line has exited the histogram zone and is pointing sharply downward, indicating potential for upward momentum after the correction.
On the H1 chart, XAU/USD has completed the structure of the growth wave, reaching the 3,015 level. We now expect the start of a corrective move toward 2,945. After this correction, the price will likely resume its upward trajectory, targeting the 3,057 level. Upon reaching this target, we will assess the possibility of a more significant correction towards the 2,900 level. This outlook is further confirmed by the Stochastic oscillator. Its signal line is currently below the 80 level and trending downwards towards 20, suggesting a high probability of a corrective phase.
Conclusion
Gold's record-breaking rally reflects a combination of macroeconomic uncertainty, geopolitical tensions, and technical momentum. With the Federal Reserve's decision and global developments in focus, the precious metal remains a key asset for investors seeking stability. As the market navigates these dynamics, further milestones for Gold prices appear increasingly likely.
NZD/USD Analysis: Exchange Rate at 2025 High
As shown on the NZD/USD chart today, the exchange rate is around 0.58250—the highest level for the Kiwi against the US dollar since December 2024.
NZD strength is supported by optimism about China's economy, a key trading partner for New Zealand. The Hang Seng Index (Hong Kong 50 on FXOpen) is near three-year highs, driven by:
→ Optimism surrounding AI development in China, including models from DeepSeek and Alibaba.
→ Government stimulus measures boosting the Chinese economy.
Meanwhile, traders are assessing the USD's outlook in light of the Trump administration's trade tariff policies.
Technical Analysis of NZD/USD
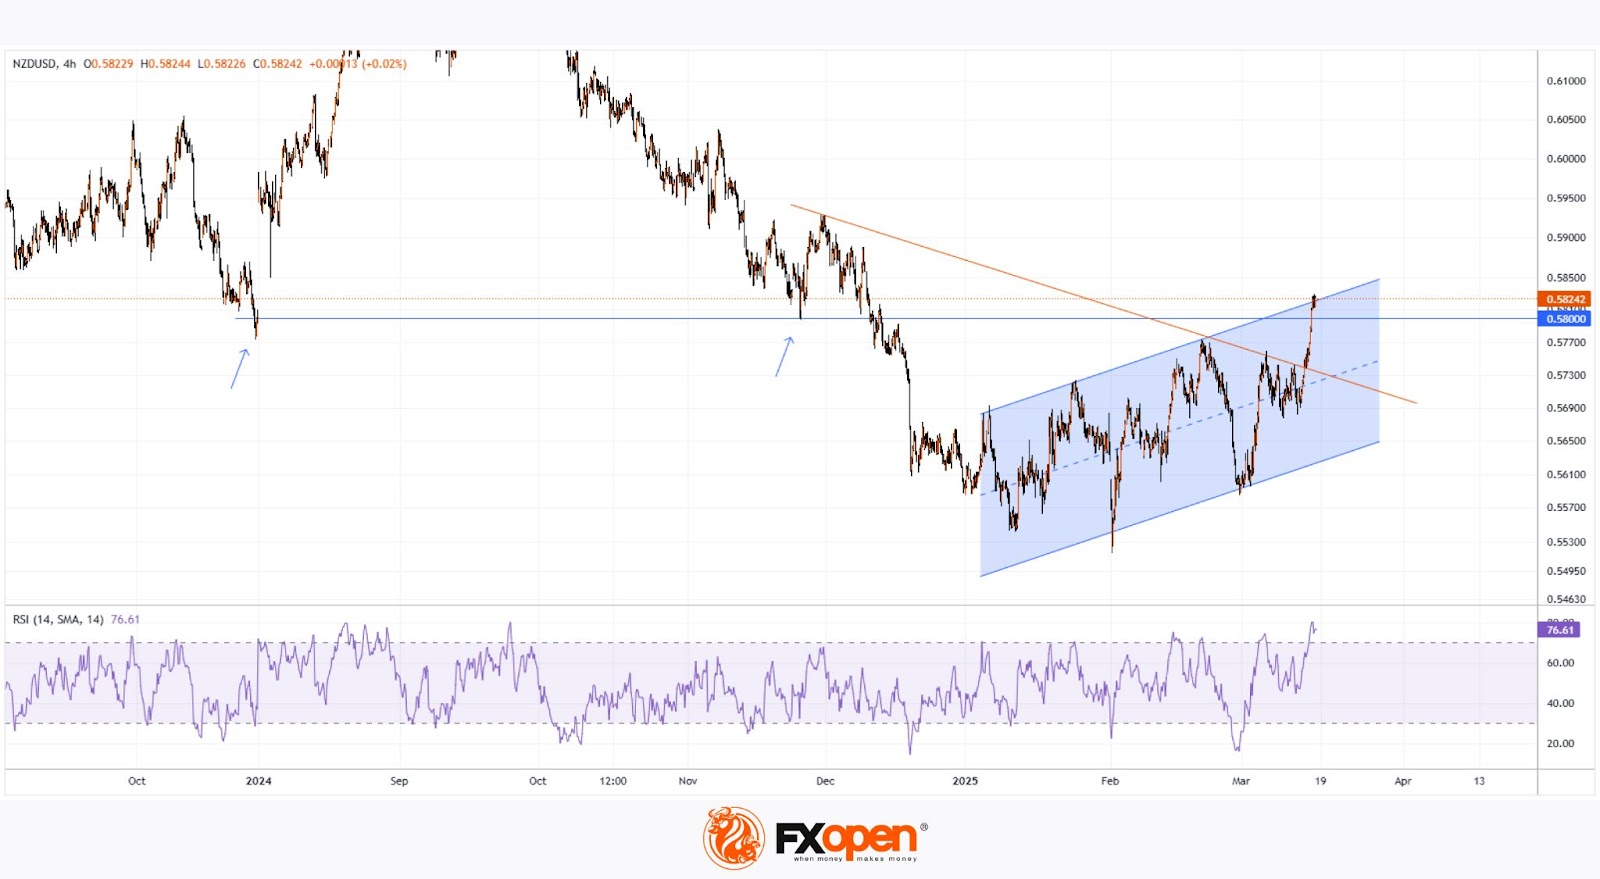
The recent rally accelerated after bulls broke through the downward trendline (shown in orange). However, bears may expect a correction due to three key factors:
→ The price is near the 0.58000 level, which previously acted as support (as indicated by arrows). It may now serve as resistance, limiting further gains.
→ The RSI indicator is in overbought territory, unsurprising given the rally's pace over the past week.
→ The price is near the upper boundary of the ascending channel (in place since early 2025), which could also act as resistance to further upside.
Trade over 50 forex markets 24 hours a day with FXOpen. Take advantage of low commissions, deep liquidity, and spreads from 0.0 pips. Open your FXOpen account now or learn more about trading forex with FXOpen.
This article represents the opinion of the Companies operating under the FXOpen brand only. It is not to be construed as an offer, solicitation, or recommendation with respect to products and services provided by the Companies operating under the FXOpen brand, nor is it to be considered financial advice.
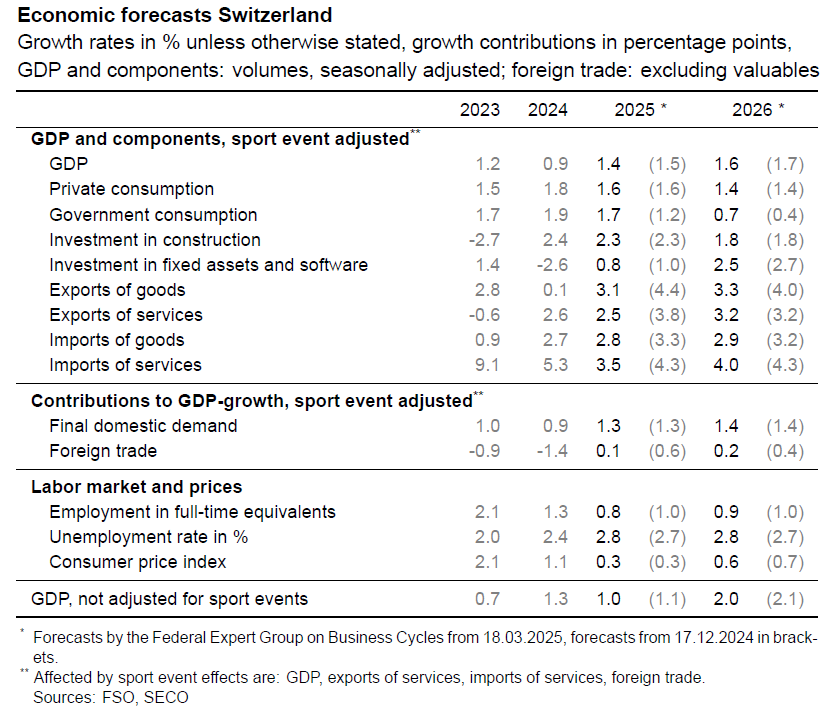
SECO lowers Swiss growth outlook, underperformance to continue fro two more years
Switzerland’s State Secretariat for Economic Affairs has slightly lowered its growth projections for the economy, reflecting ongoing global trade tensions and economic uncertainty.
The latest forecast now sees GDP growth at 1.4% in 2025 and 1.6% in 2026, down from the previous estimates of 1.5% and 1.7%, respectively. This means the Swiss economy will likely continue expanding at a pace below its historical average of 1.8%, extending a period of subdued economic momentum for at least two more years.
SECO emphasized that while the base scenario assumes no full-blown global trade war, some negative effects from current trade frictions are still expected, adding pressure on both investment and economic activity.
According to SECO, a negative trade scenario—where international economic activity weakens further—would "significantly impact Swiss exports and domestic economic activity". On the other hand, an upside scenario exists, particularly if Germany successfully implements its massive fiscal package.
However, for now, SECO believes "downside risks to the economy currently outweigh upside potential". Also Swiss Franc’s could face upward pressure if downside risks materialize.
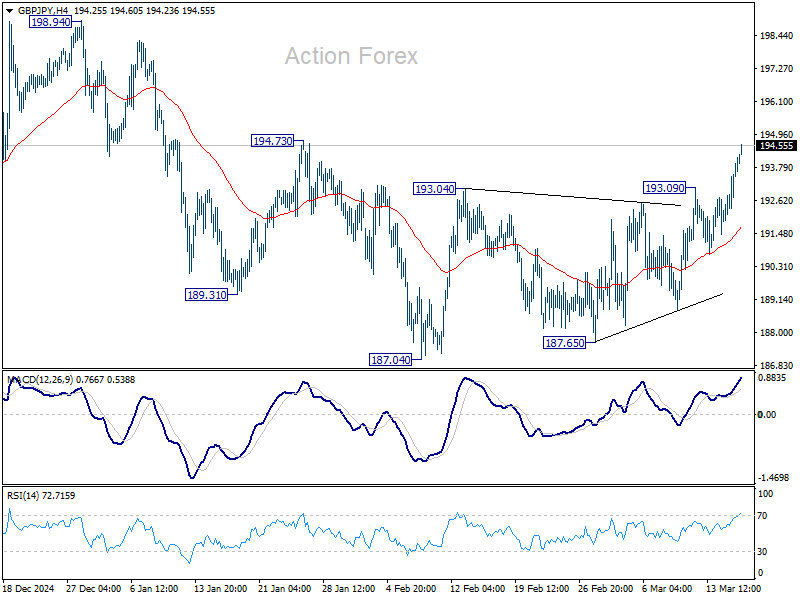
GBP/JPY Daily Outlook
Daily Pivots: (S1) 192.56; (P) 193.26; (R1) 194.56; More...
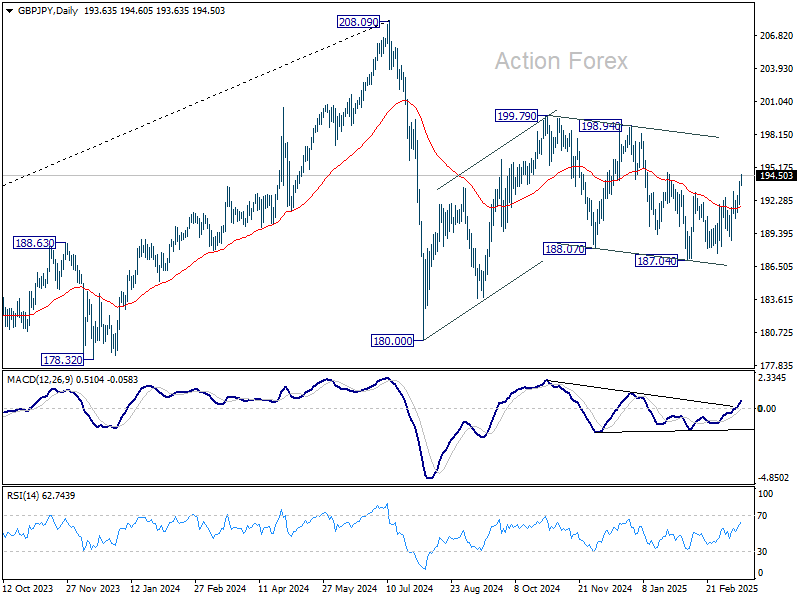
GBP/JPY's strong break of 193.09 resistance confirms resumption of rise from 187.04. Intraday bias is back on the upside. Break of 194.73 will pave the way to 198.94/199.79 resistance zone. On the downside, below 193.09 will turn intraday bias neutral again first. Overall, corrective pattern from 208.09 is still in progress, with price actions from 180.00 as the second leg.
In the bigger picture, price actions from 208.09 are seen as a correction to rally from 123.94 (2020 low). Strong support should be seen from 38.2% retracement of 123.94 to 208.09 at 175.94 to contain downside. However, sustained break of 152.11 will bring deeper fall even still as a correction.
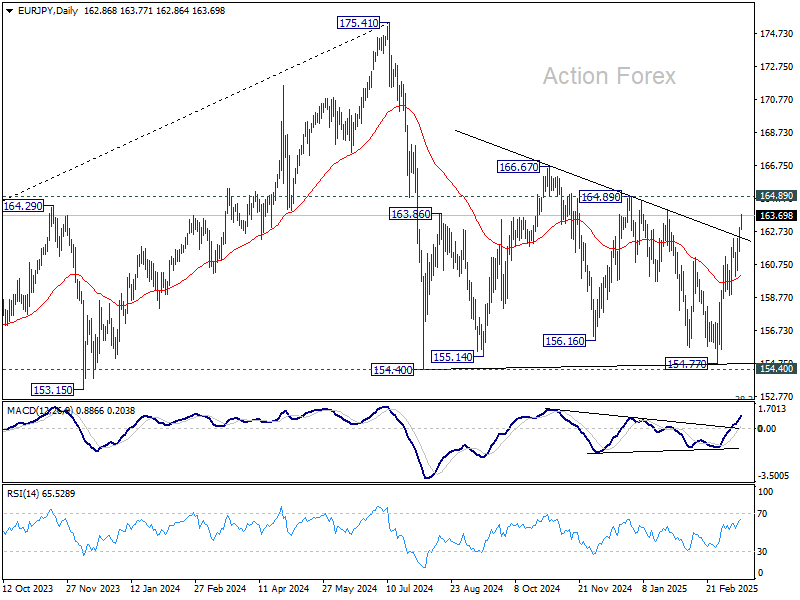
EUR/JPY Daily Outlook
Daily Pivots: (S1) 162.01; (P) 162.53; (R1) 163.50; More...
Intraday bias in EUR/JPY is back on the upside with strong break of 162.34 temporary top. Rise from 154.77, as another rising leg in the consolidation from 154.40, should target 164.89 resistance. On the downside, below 162.34 will turn intraday bias neutral again and bring consolidations first.
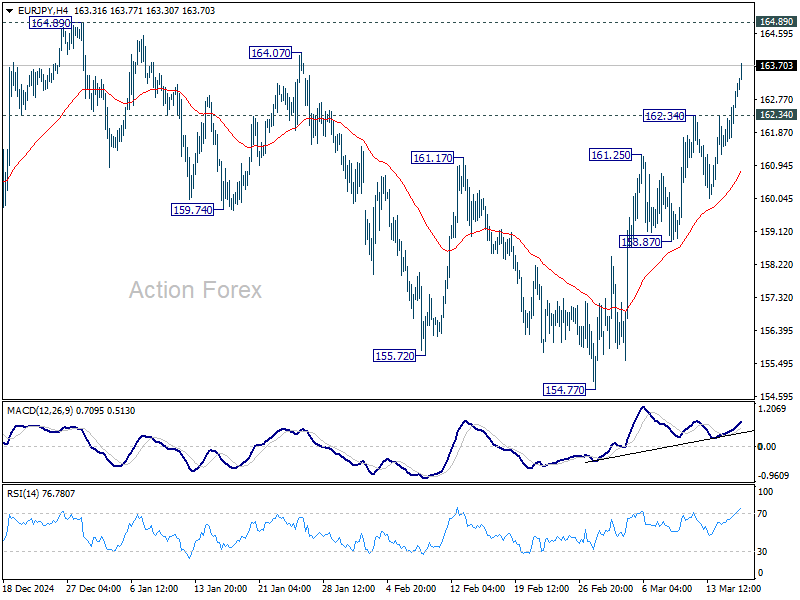
In the bigger picture, price actions from 175.41 are seen as correction to rally from 114.42 (2020 low). Strong support should be seen from 38.2% retracement of 114.42 to 175.41 at 152.11 to contain downside. However, sustained break of 152.11 will bring deeper fall even still as a correction.
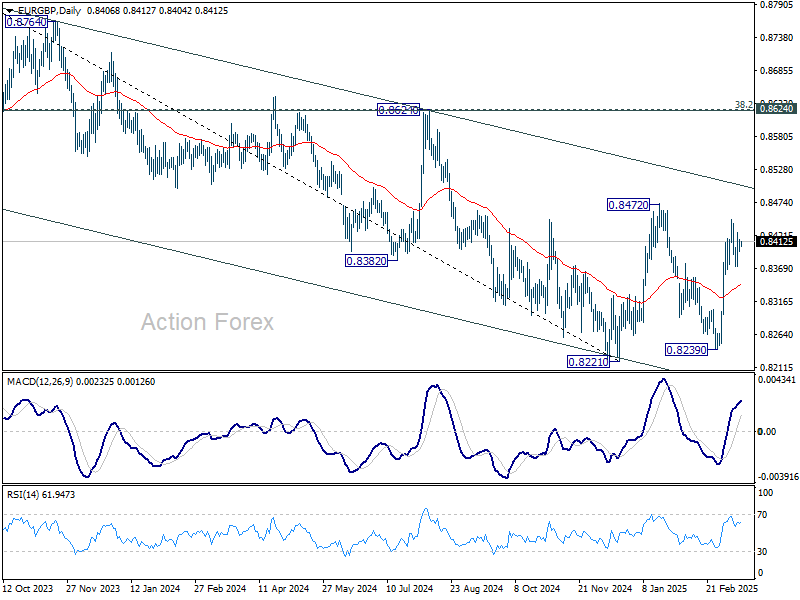
EUR/GBP Daily Outlook
Daily Pivots: (S1) 0.8397; (P) 0.8408; (R1) 0.8418; More...
EUR/GBP is staying in consolidation below 0.8448 and intraday bias stays neutral. Further rally is expected as long as 0.8358 minor support holds. On the upside, break of 0.8448 will target 0.8472 resistance first. Firm break there will resume whole rebound from 0.8221 to medium term falling channel resistance (now at 0.8508). Nevertheless, break of 0.8358 will suggest that rise from 0.8239 has completed and turn bias back to the downside instead.
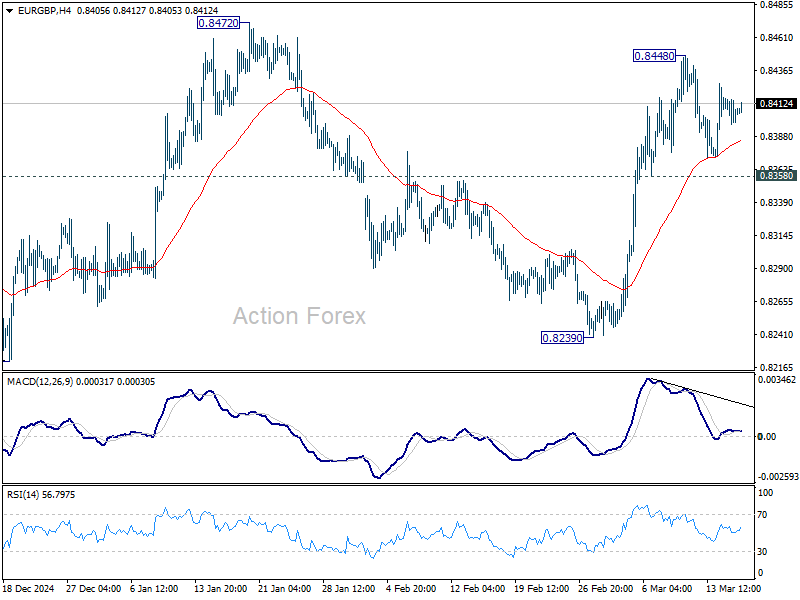
In the bigger picture, EUR/GBP is still bounded inside medium term falling channel. While rebound from 0.8221 might extend higher, it could still develop into a corrective pattern. Overall outlook will be neutral at best and down trend from 0.9267 (2022 high) could extend, at least until decisive break of channel resistance (now at 0.8508).
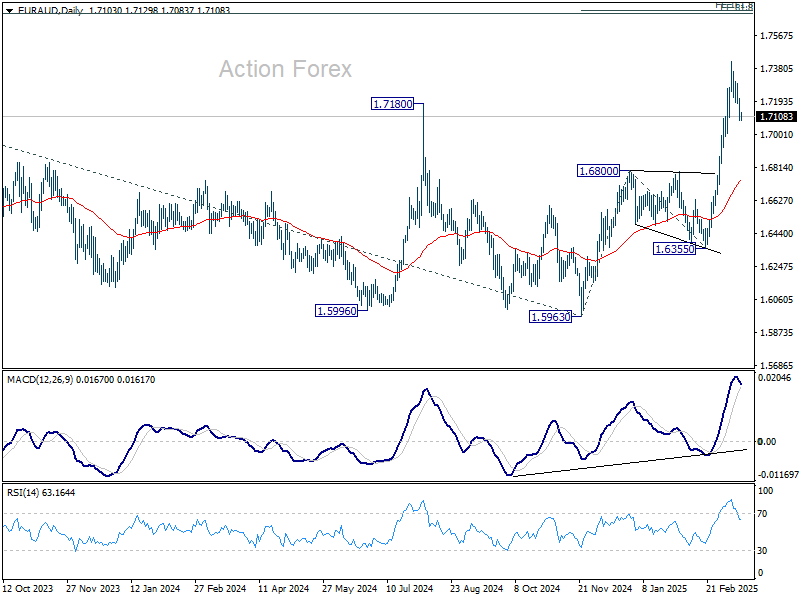
EUR/AUD Daily Outlook
Daily Pivots: (S1) 1.7051; (P) 1.7141; (R1) 1.7195; More...
Intraday bias in EUR/AUD stays neutral at this point, and more consolidations would be seen below 1.7417. Downside of retreat should be contained by 0.6990 support to bring rebound. On the upside, break of 1.7417 will resume rise from 1.6335 to 161.8% projection of 1.5963 to 1.6800 from 1.6355 at 1.7709 next.
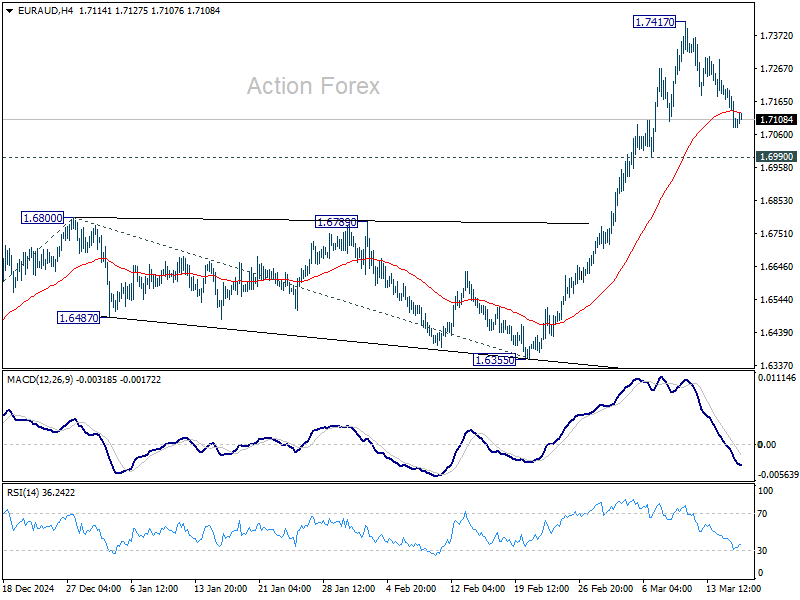
In the bigger picture, the breach of 1.7180 key resistance (2024 high) suggests that up trend from 1.4281 (2022 low) is resuming. Sustained trading above 1.7180 will confirm and target 61.8% projection of 1.4281 to 1.7062 from 1.5963 at 1.7682, which is also close to 61.8% retracement of 1.9799 (2020 high) to 1.4281 at 1.7691. For now, this will remain the favored case as long as 1.6800 resistance turned support holds, even in case of deep pullback.
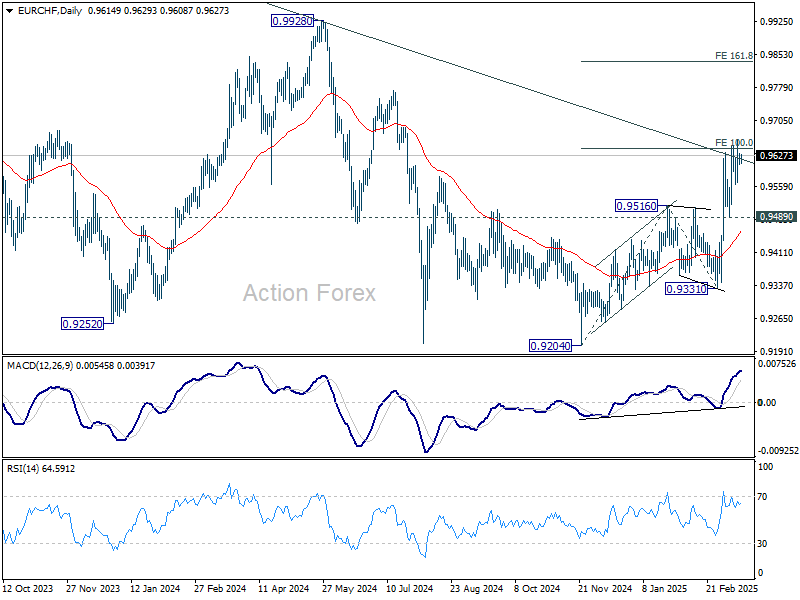
EUR/CHF Daily Outlook
Daily Pivots: (S1) 0.9607; (P) 0.9622; (R1) 0.9636; More....
No change in EUR/CHF's outlook and intraday bias stays neutral first. Further rise is expected as long as 0.9489 support holds. Sustained trading above 100% projection of 0.9204 to 0.9516 from 0.9331 at 0.9643 will pave the way to 161.8% projection at 0.9836 next.
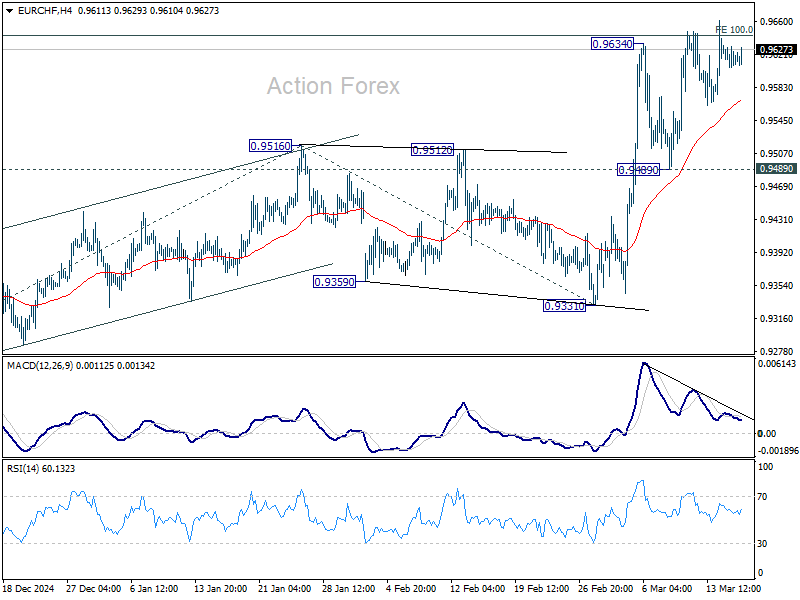
In the bigger picture, prior strong break of 55 W EMA (now at 0.9487) is a medium term bullish sign. Sustained break trading above long-term falling channel resistance (at around 0.9620) would suggest that the downtrend from 1.2004 (2018 high) has bottomed at 0.9204. Stronger rally should then be see to 0.9928 key resistance at least.
Market Focus on Germany Rubberstamping a Historical Debt Deal
Markets
Yesterday’s final input to the Fed meeting on Wednesday won’t change the status quo decision that’s expected. February core retail sales were decent but in some cases merely rebounded from a weak January while the NY manufacturing index added to a growing stagflationary narrative. US yields whipsawed to finish between -2.8 and +2.8 bps in a flattening move. German Bunds greatly outperformed in what is perhaps some buy the rumour, sell the fact short covering ahead of today’s key vote in the German parliament on the debt package. It’s mere size, a €500bn special infrastructure fund and a de facto blank cheque for defense spending, should serve as solid bottom below yields, making yesterday’s correction potentially a short-lived one. Risk sentiment was positive, spurring equity gains between 0.3-0.9% in Europe and the US. Cyclicals and smaller currencies stood to benefit. The likes of AUD and NZD outperformed, helped higher by new Chinese stimulus initiatives which focus on domestic demand. At the other spectrum there’s JPY and USD. The trade-weighted dollar index finished at a five-month low (103.37). The euro lost against most peers too but nevertheless gained against the US currency. EUR/USD closed above 1.09. EUR/GBP held steady north of 0.84 in technical trading.
Asian dealings this morning happen against a constructive background. Regional stocks eke out gains up to 2% in the wake of yesterday’s performance on WS. There is little news to support the moves though. Tariff fears moved a bit to the background for the time being with the next key date some time away still. The US plans to install reciprocal tariffs on April 2. There is heavy debate on how these should look like with proposals ranging from complex methods such as taxing individual countries and products to simplified ones by applying a layered, three-tier system with low, medium and high tariff rates. Today, though, market focus will be on Germany rubberstamping a historical debt deal and the talks between US president Trump and his Russian counterpart Putin. Especially the latter is a wildcard for trading. One of the objectives is probably to have Putin agree to the 30-day ceasefire, signed off earlier by the US and Ukraine. The devil (for Ukraine and Europe altogether) will be in the details but a truce for markets should be positive regardless. Bunds may underperform Treasuries in a daily perspective. EUR/USD is moving towards first resistance of 1.0937 (November correction high). This is only a minor hurdle before moving towards the 1.12-area.
News & Views
Assistant governor of the Reserve Bank of Australia (RBA) Sarah Hunter confirmed the recent assessment of other board members including governor Michelle Bullock that the RBA is more cautious than the market about the prospect for further rate cuts. The RBA at the February meeting for the first time reduced its policy rate by 25 bps to 4.10% after having kept it unchanged since November 2023. It said then it was the right time to take away some of the restrictiveness. But there is a lot of uncertainty about the RBA’s forecasts, in particular with respect to the policy steps taken in the US, Hunter indicated. With respect to domestic developments in Australia, Hunter said that the pick-up in household consumption in Q4 of last year was not a temporary bounce, but a genuine improvement in the underlying momentum. Markets currently see a chance of about 70% of an additional rate cut at the May meeting. A third rate cut is discounted by autumn. The Aussie dollar recently bottomed against a weakening dollar and recently drew some comfort from China preparing additional measures to support domestic demand. AUD trades near 0.637, compared to sub 0.615 levels in January.
Bloomberg referring to people familiar with the deliberations reported that US Trade Representative Jamieson Greer is trying to take control of the process of tariffs announcements on April 2 as he tries to inject order into this sweeping process. According to the Bloomberg article, Greer has reinstated parts of a traditional policy process that were missing from prior tariffs imposed on Canada, Mexico, China and metals by asking for public comments on the reciprocal duties. That gives the trade office a formal way to receive feedback from businesses and other stakeholders. Greer is also said to take those requests into account when setting up the tariff program. Bloomberg also refers to a formula for a single rate for each country based on that nation’s average tariff level and other measures the Trump team considers discriminatory.