Sample Category Title
Bank of Japan Expected to Maintain Rate on Global Growth Worries, Yen Close to 150 Line
The Japanese yen has lost ground for a third straight trading day. In the North American session, USD/JPY is trading at 149.32, up 0.08% on the day. Earlier, the yen weakened to 149.93, its lowest level in two weeks.
Bank of Japan likely to hold rates at 0.5% until later in 2025
The Bank of Japan meets early on Wednesday and is widely expected to maintain rates at 0.50%. The BoJ is in the midst of a tightening cycle butt is moving at a very slow pace.
After lifting rates out of negative territory a year ago, the central bank has raised rates twice more, including in January.
The tighter monetary policy reflects rising wages and higher inflation which appears to be sustainable. BoJ policymakers have telegraphed their intention to raise rates but have refrained from signalling when they will do so, which means each meeting remains somewhat of a guessing game. Investors will be looking for clues of the next rate hike from the rate statement and from Governor Kazuo Ueda's press conference.
The US hasn't singled out Japan with tariffs but the threat of a global trade war is very much on the minds of BoJ policymakers and a key reason why the BoJ is unlikely to make a move at Wednesday's meeting. The BoJ is in a wait-and-see mode as it monitors US trade policy and the national wage agreement which will hike wages by over 5%.
US retail sales rise 0.2%
In the US, retail sales for February posted a weak gain of 0.2% m/m, recovering from the 1.6% decline in January but shy of the market estimate of 0.6%. Consumers are feeling pessimistic about the economy slowing down and rising inflation. The Trump administration's tariff policy, which threatens to dampen the US economy and boost inflation is a significant concern for consumers.
GBP/USD Analysis: Testing 1.3000 Resistance Amid Central Bank Uncertainty. Will Cable Break 1.3000?
- GBP/USD hit a four-month high, testing the 1.3000 level, driven by US Dollar weakness.
- Central bank meetings (Fed and BoE) this week could lead to market consolidation and a pause in the GBP/USD rally.
- A daily candle close above 1.3000 is needed for GBP/USD bulls to maintain control.
GBP/USD made its way to a four-month high, tapping into the psychological 1.3000 handle yesterday. A retest and foray above earlier in the day was met with some modest selling pressure keeping cable just below the key level for now.
Cable just like EUR/USD has been a significant beneficiary of US Dollar weakness over the past few weeks. A combination of softer data which has raised recession concerns and a general switch by market participants from the US Dollar to other safe haven assets have dented the greenbacks appeal.
That trend continued yesterday with US data continuing to haunt the dollar. The greenback fell against all G10 currencies excluding the yen yesterday. February retail sales rose less than expected (0.2% month-on-month versus 0.6% consensus) following a major drop in January, while the Empire Manufacturing Index plummeted to the lowest level in more than a year.
Central Bank Uncertainty to Lead to a Period of Consolidation?
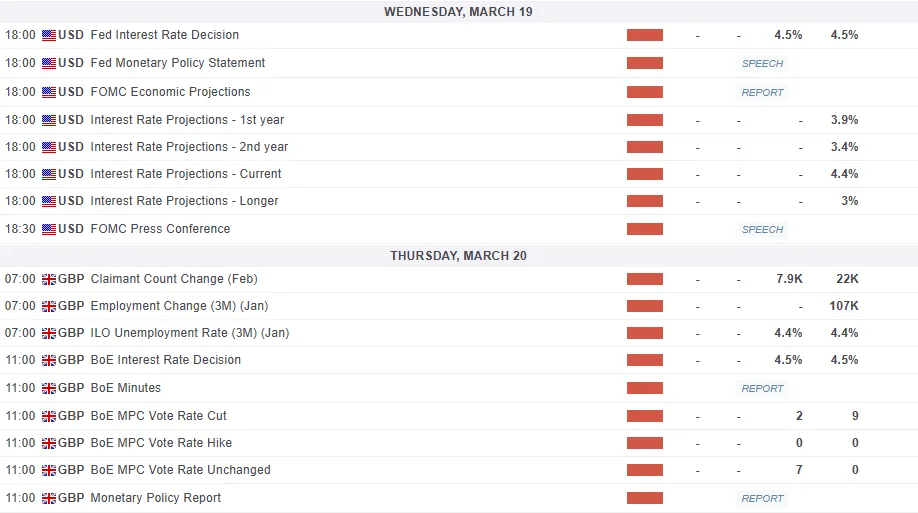
Central Banks are in focus this week with both the Federal Reserve and Bank of England (BoE) meeting ahead. This could lead to a pause in the cable rally as markets adopt a wait and see approach.
The Bank of England (BoE) is likely to keep UK interest rates unchanged after cutting them by 25 basis points in February. The central bank may take a cautious approach due to uncertainty around US trade policy affecting the global economy.
This could lessen expectations for another quick rate cut, supporting GBP/USD. However, Governor Andrew Bailey and his team might still take a cautious tone, suggesting they will ease monetary policy slowly and carefully.
The softer data in the US has seen rate cut expectations increase of late which could work in favor of further gains for cable. That is if the Federal Reserve hints at more rate cuts this year.
However, given the narrative around inflation and with universal tariffs scheduled for April, I think the Fed might maintain their current policy stance at this week's meeting.
Technical Analysis - GBP/USD
GBP/USD has been on a tear since the trendline break and retest on February 11.
Since then cable has risen some 660-odd pips to trade around the psychological 1.3000.
The trend is strong at this stage but a daily candle close above the 1.3000 handle is needed if the bulls are to remain in control.
If that does occur then immediate resistance will be found at 1.3140 and 1.3210.
A rejection of the 1.3000 handle may find support at 1.2864 and then the 200-day MA at 1.2797 comes into focus.
GBP/USD Daily Chart, March 18, 2025
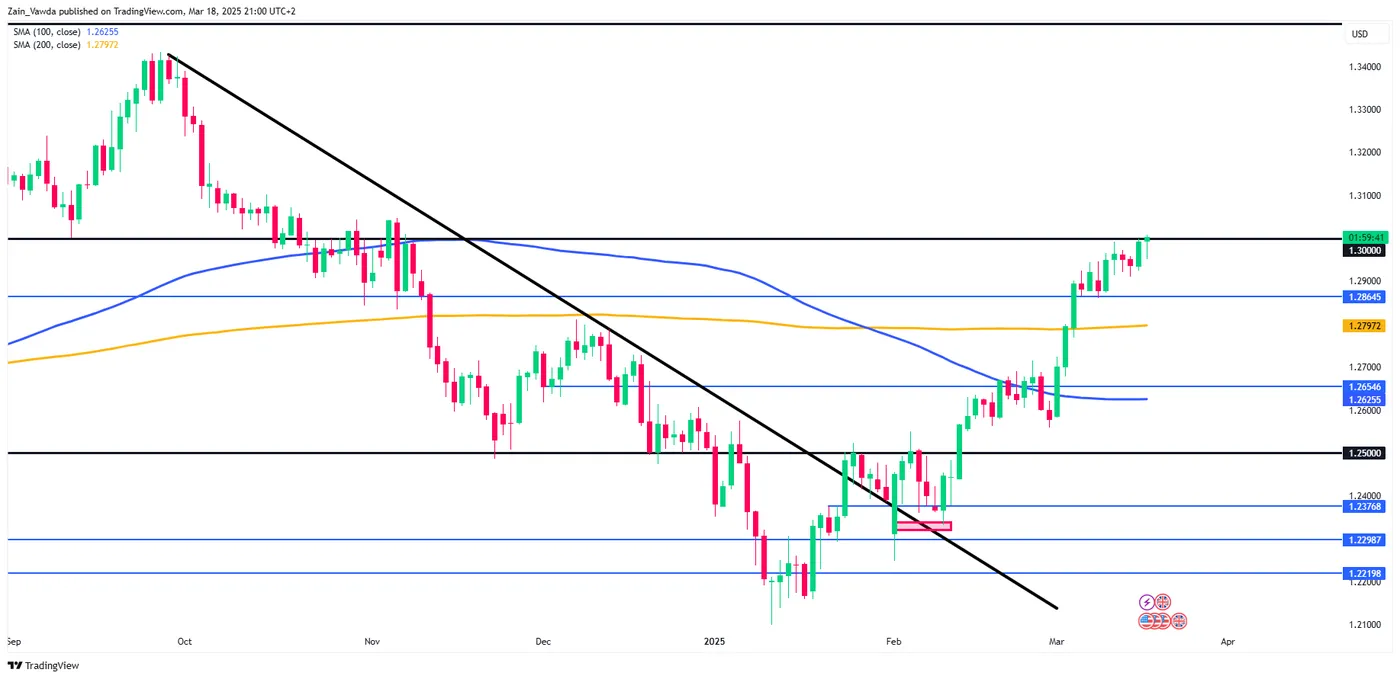
Source: TradingView.com
Support
- 1.2864
- 1.2797
- 1.2654
Resistance
- 1.3140
- 1.3210
- 1.3250
GBPUSD Wave Analysis
GBPUSD: ⬆️ Buy
- GBPUSD reversed from support zone
- Likely to rise to resistance level 1.3050
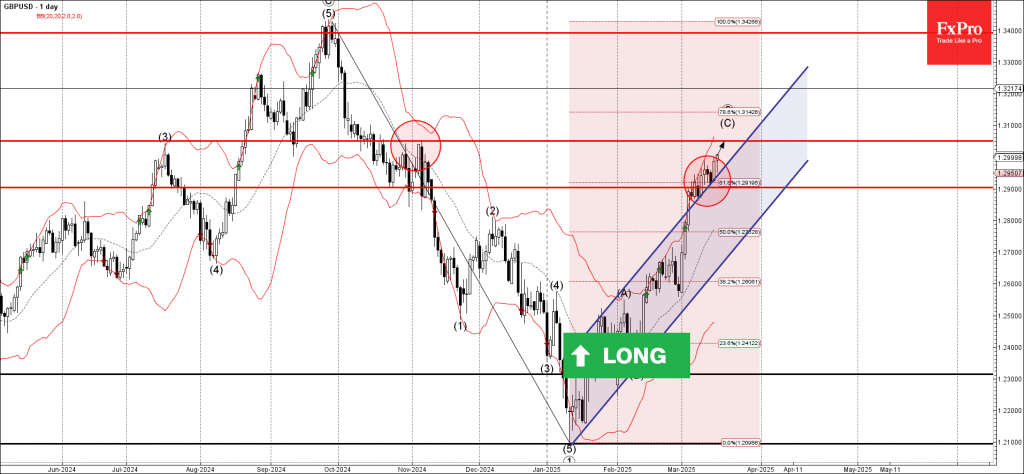
GBPUSD currency pair recently reversed from the support zone between the support level 1.2900 and the upper trendline of the daily up channel from January.
The upward reversal from this support zone created the daily Japanese candlesticks reversal pattern Bullish Engulfing – which continued the active impulse wave (C).
Given the strongly bullish sterling sentiment, GBPUSD currency pair can be expected to rise to the next resistance level 1.3050 (the former monthly high from November).
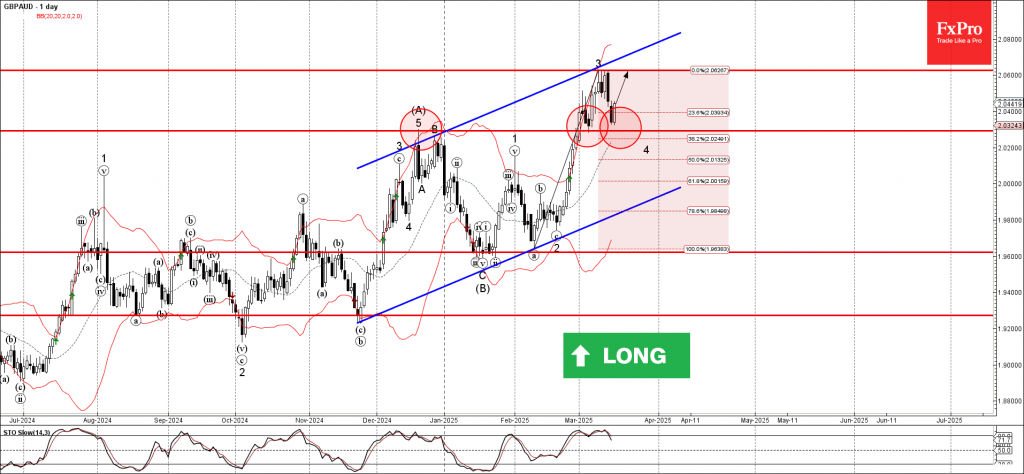
GBPAUD Wave Analysis
GBPAUD: ⬆️ Buy
- GBPAUD reversed from the support zone
- Likely to rise to resistance level 2.060
GBPAUD currency pair recently reversed from the support area between the support level 2.0290 (former multi-month resistance from December) and the 38.2% Fibonacci correction of the upward impulse from February.
The upward reversal from this support zone stopped the previous short-term ABC correction 4.
Given the strong multi-month uptrend, GBPAUD currency pair can be expected to rise to the next resistance level 2.060 (which reversed the previous upward impulse wave 3).
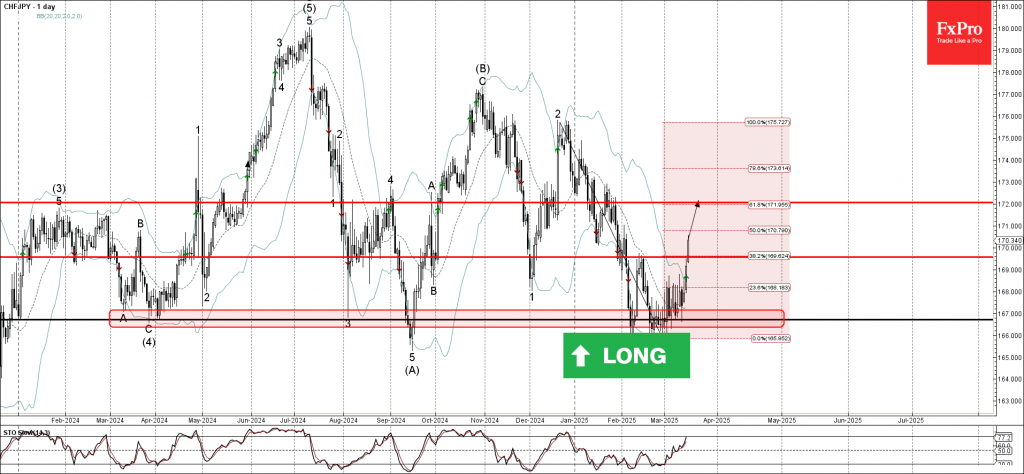
CHFJPY Wave Analysis
CHFJPY: ⬆️ Buy
- CHFJPY broke resistance zone
- Likely to rise to resistance level 172.00
CHFJPY currency pair recently broke the resistance zone lying at the intersection of the resistance level 169.50 (former upward correction top from February) and the 38.2% Fibonacci correction of the sharp downward impulse from December.
The breakout of this resistance zone accelerated the active upward correction from the major support level 166.70.
CHFJPY currency pair can be expected to rise to the next resistance level 172.00 (which reversed the pair at the end of January).
Crypto Market Stuck in the Mud
Market Picture
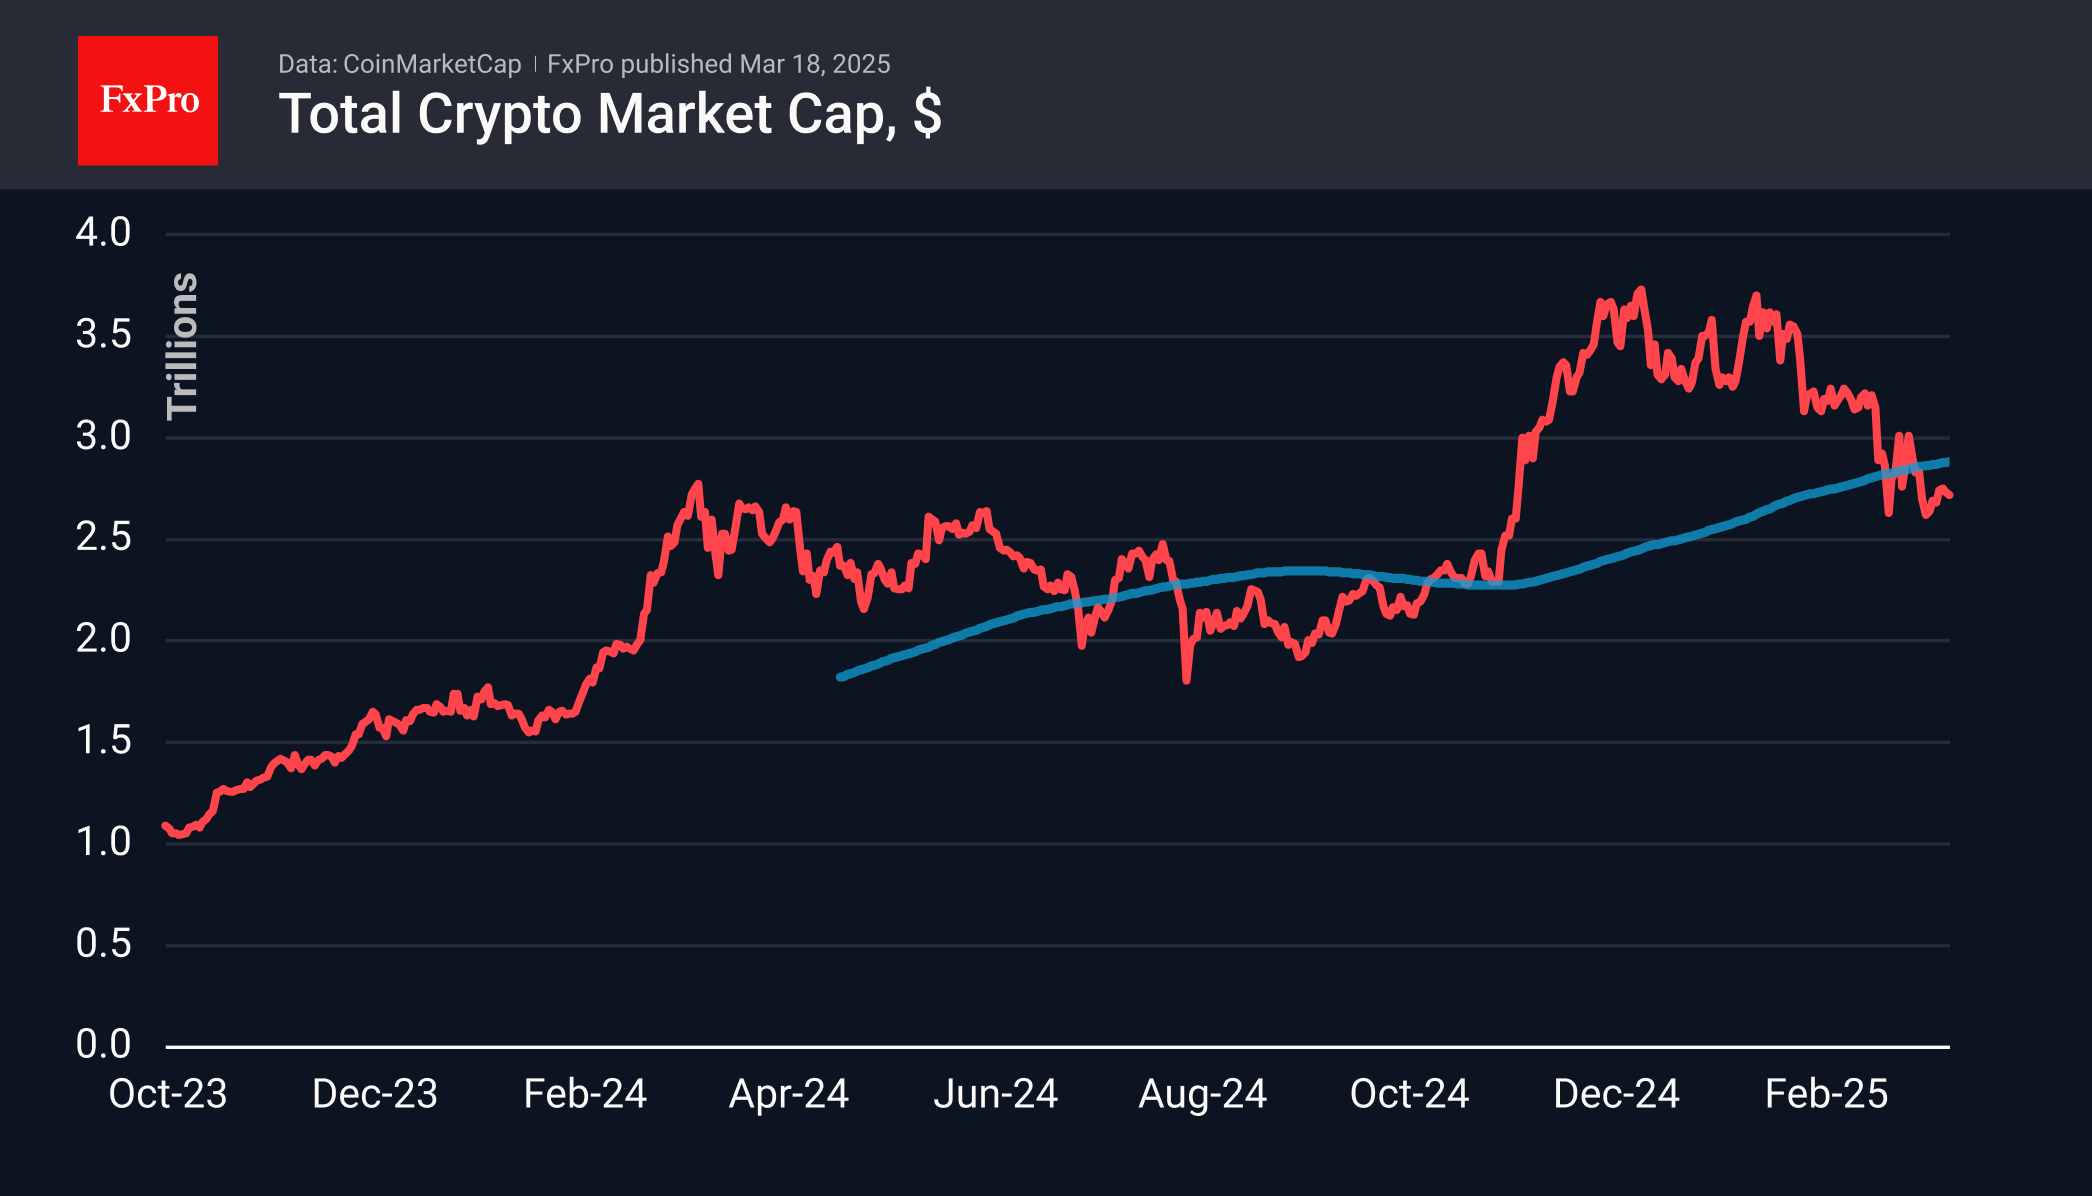
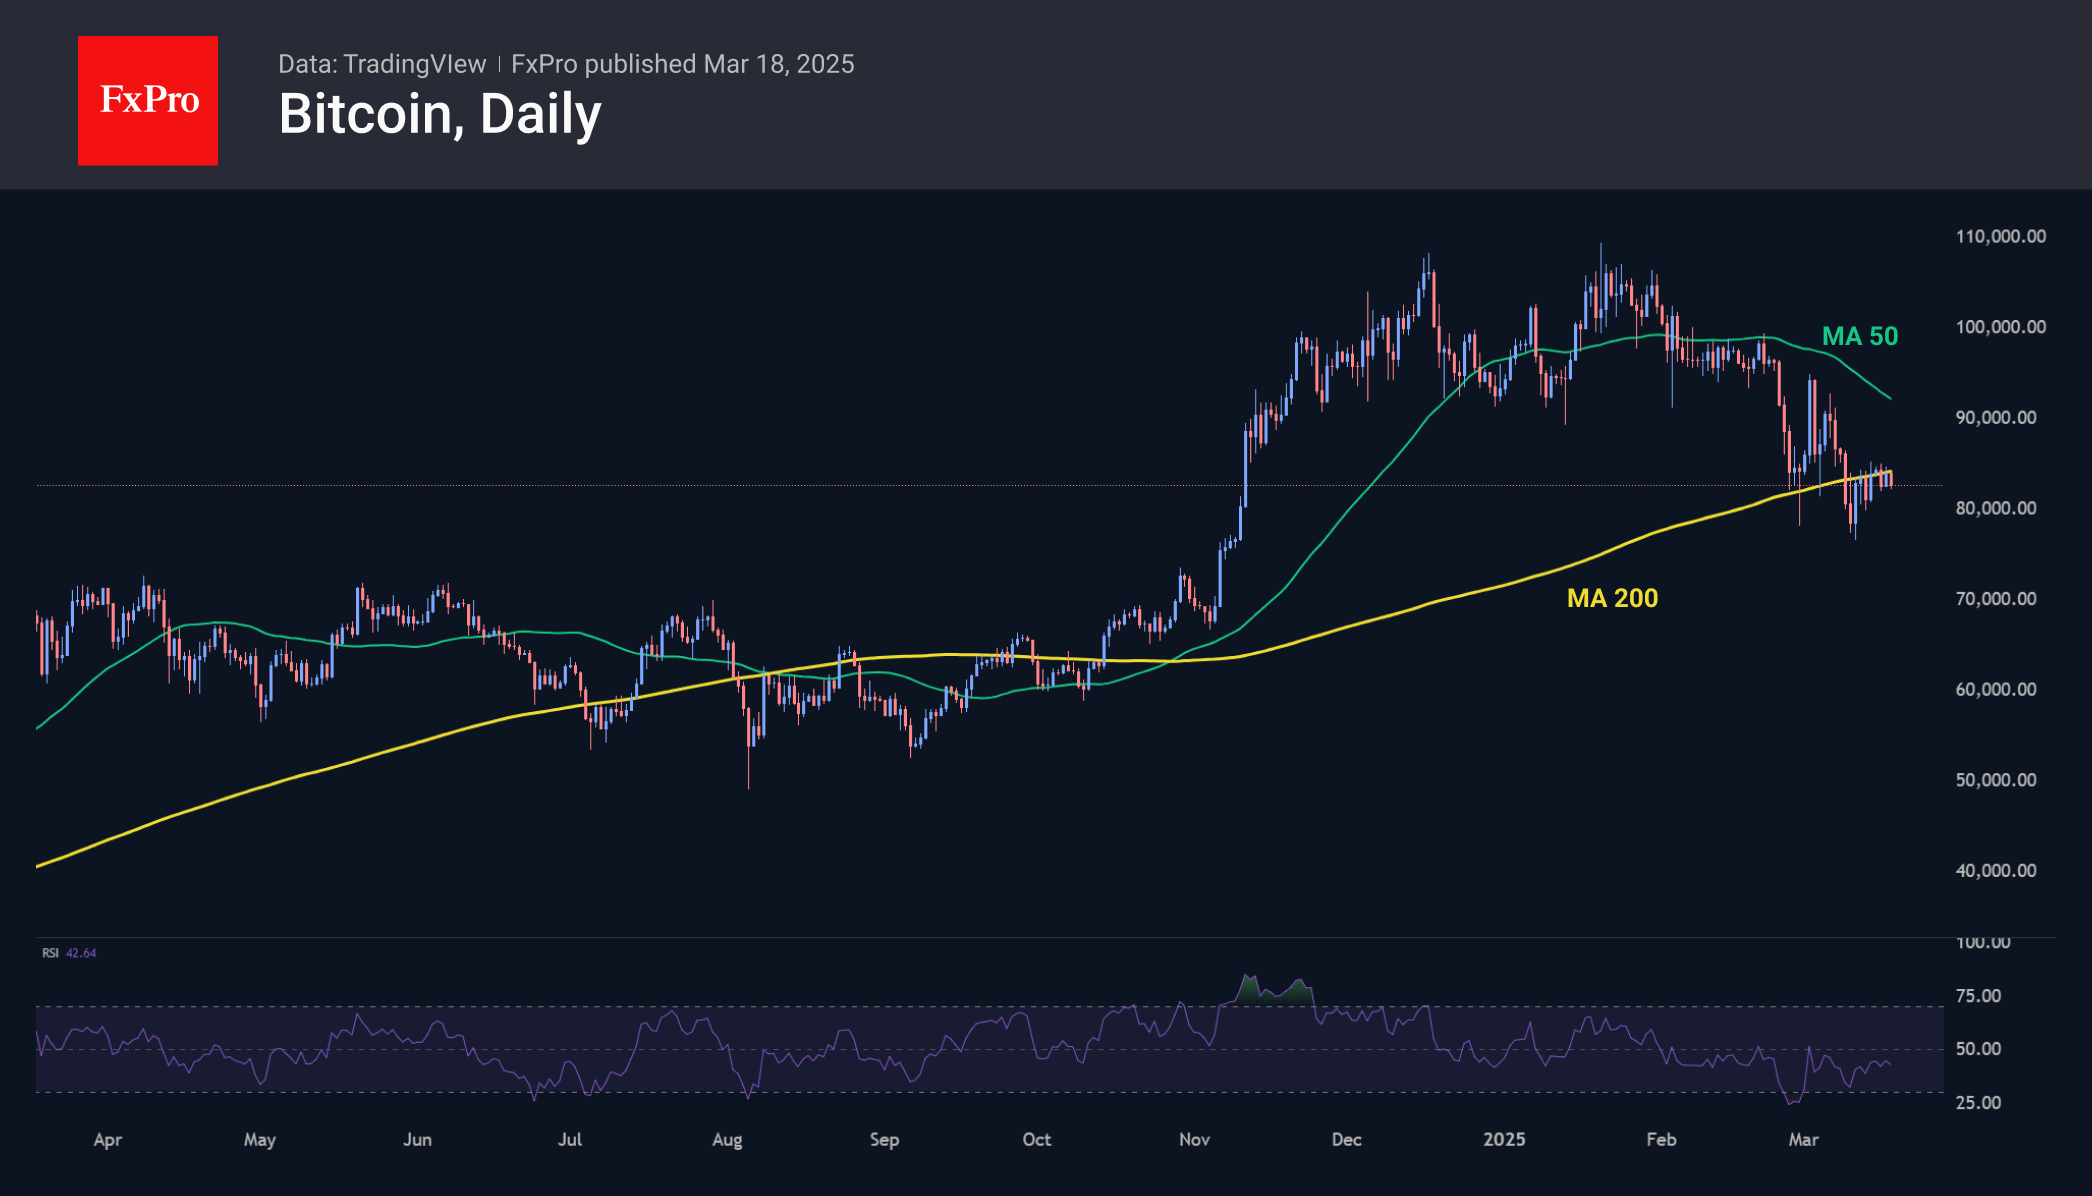
The crypto market has been hovering in a narrow range for the past four days, adding just over 2.5% over the past seven days to $2.72 trillion. These are levels below the 200-day moving average, indicating that the balance of power is now on the sellers’ side. It is an important signal line separating bull from bear trends. It is also noteworthy that stabilisation is taking place on reduced volumes, saying that the current position is fragile despite the positive performance of stock indices in the last couple of trading sessions.
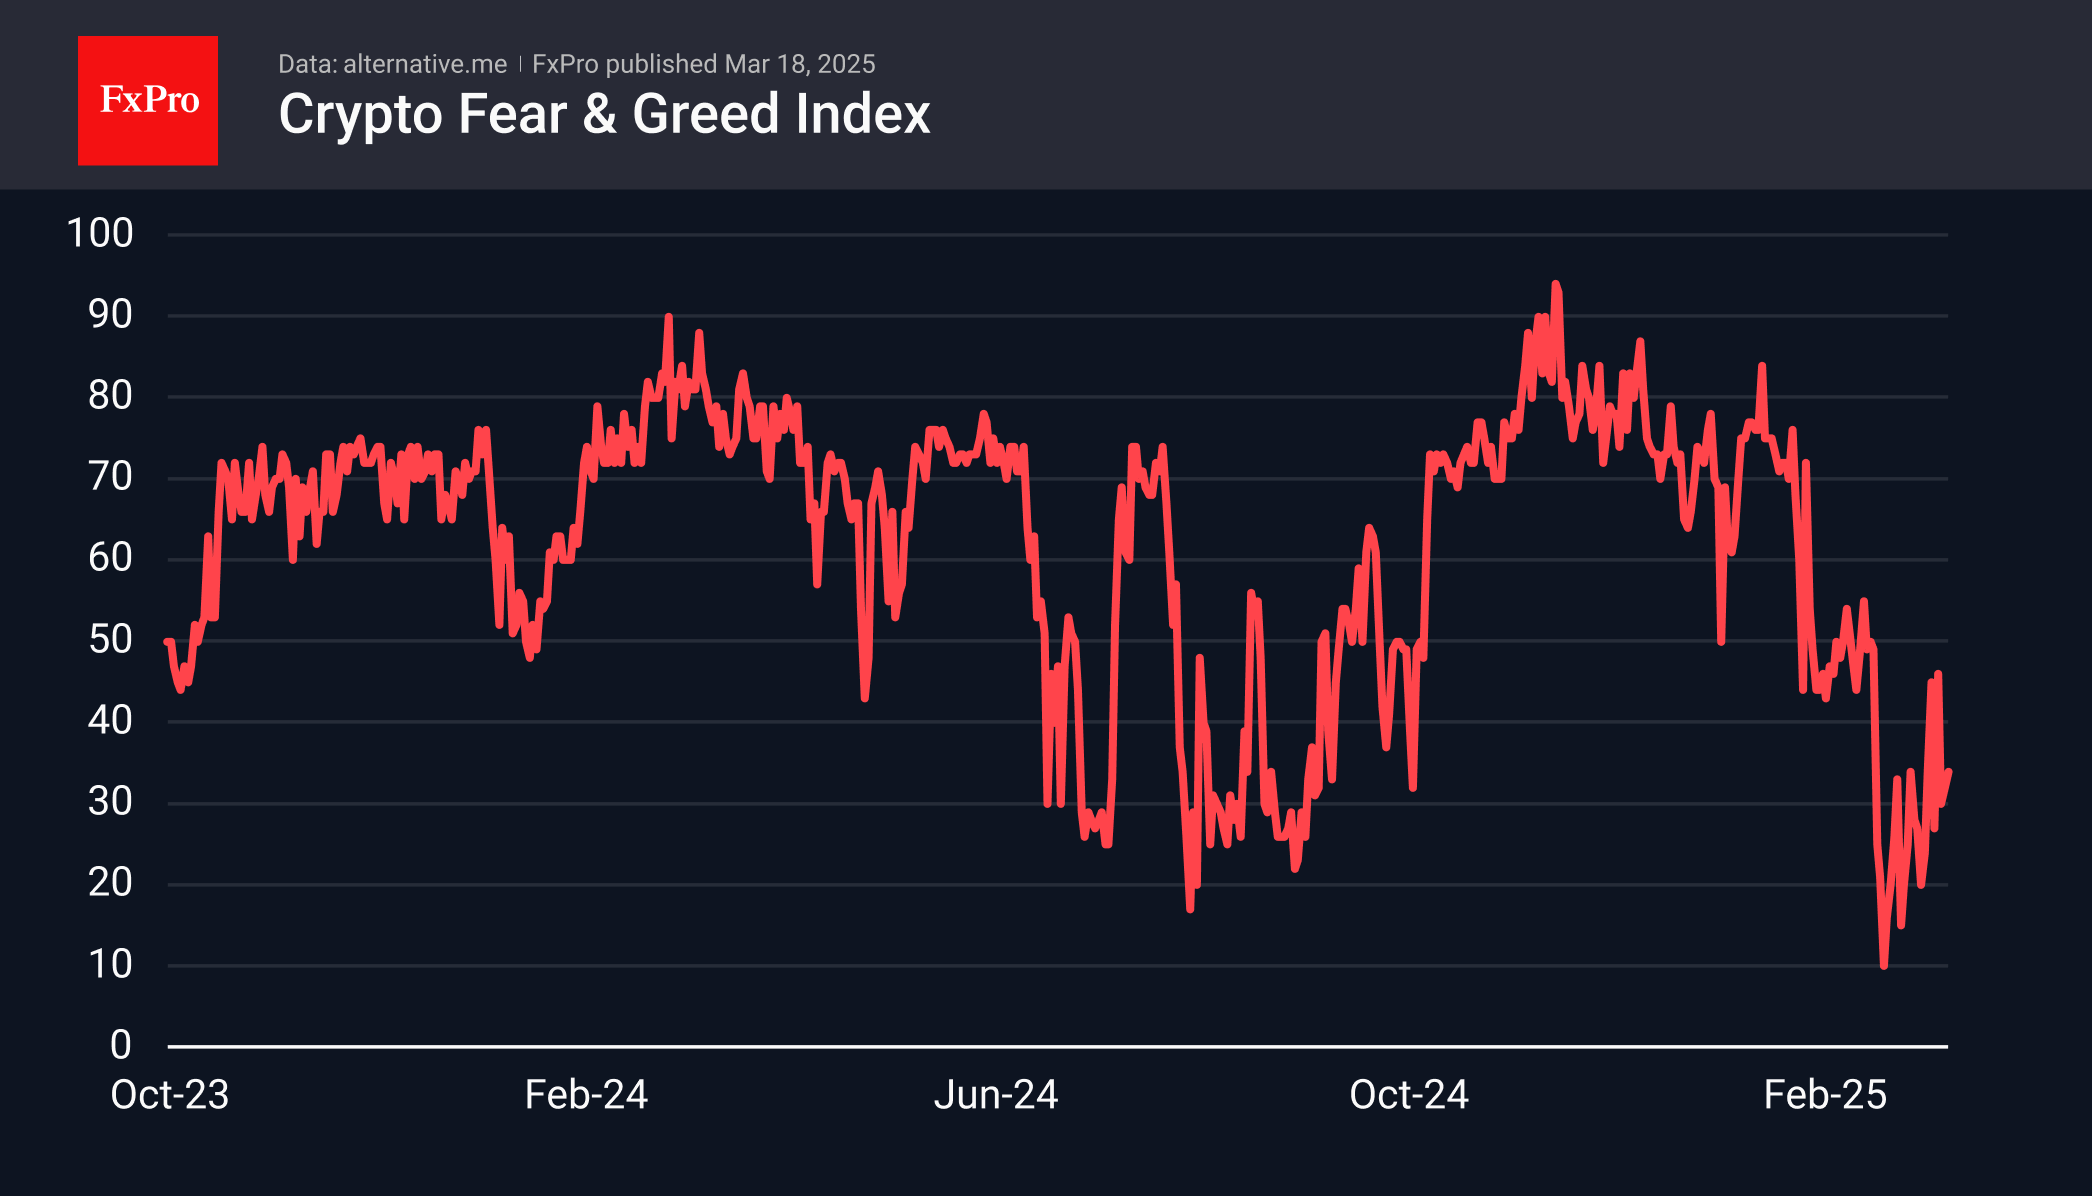
The cryptocurrency sentiment index is in fear territory, but during Bitcoin’s rebound over the past week, it has moved to neutral territory a couple of times.
The first cryptocurrency has managed to stabilise, but it is not yet on a solid growth track. Strong resistance in the form of the 200-day moving average has smashed attempts to grow over the past week and a half. The stabilisation of the price is helping the Relative Strength Index rise, which is reducing the oversold condition. Our concern is that this stabilisation is just digging a hole under Bitcoin, and it will fall into it.
News Background
According to CoinShares, global investments in crypto funds fell by $1.687bn last week. Bitcoin investments fell by $978m, Ethereum by $176m, and Solana by $2m. Investments in XRP rose by $2m and Cardano by $0.4m.
If the two stable correlations persist, bitcoin may move to recovery in the second quarter, Wells Fargo expects. We are talking about a positive correlation between BTC and money supply growth (M2) and a negative one with the dollar index.
Strategy (formerly MicroStrategy) reported buying 130 BTC for $10.7 million, the smallest bitcoin purchase in the firm’s history. The average purchase price was $82,981 per coin.
North Korean hacker group Lazarus currently owns 13,518 BTC ($1.13bn), more than the BTC assets in the wallets of the government of Bhutan or El Salvador, Arkham Intelligence calculated.
New Zealand’s Banking Debate vs. NZDJPY
Key Developments
- ANZ and BNZ posted record-breaking profits, fueling concerns over banking competition.
- Finance Minister Nicola Willis previously vowed to take action against high bank profits but is now considering rolling back capital requirements.
- The Reserve Bank’s 2019 capital requirement decision is under scrutiny, with some arguing it raises costs for borrowers.
- Critics, including former RBNZ Governor Adrian Orr, argue banks have enough profit margin to offer better deals without reducing financial safeguards.
- Reducing capital requirements could increase financial instability and future bailout risks.
Impact on Financial Markets
- New Zealand Dollar (NZD) Outlook: Banking policy shifts may impact investor confidence in the NZD.
- Interest Rates: If capital requirements are eased, lending rates may decrease, but financial stability concerns could rise.
- Banking Stocks: Increased scrutiny of profitability and regulation may create volatility in bank stocks.
Key Takeaway for Traders
The debate over banking competition versus financial regulation will shape New Zealand’s economic landscape. While lower capital requirements could ease lending conditions, they may also raise risks to long-term financial stability. Traders should monitor government decisions closely for potential market impacts.
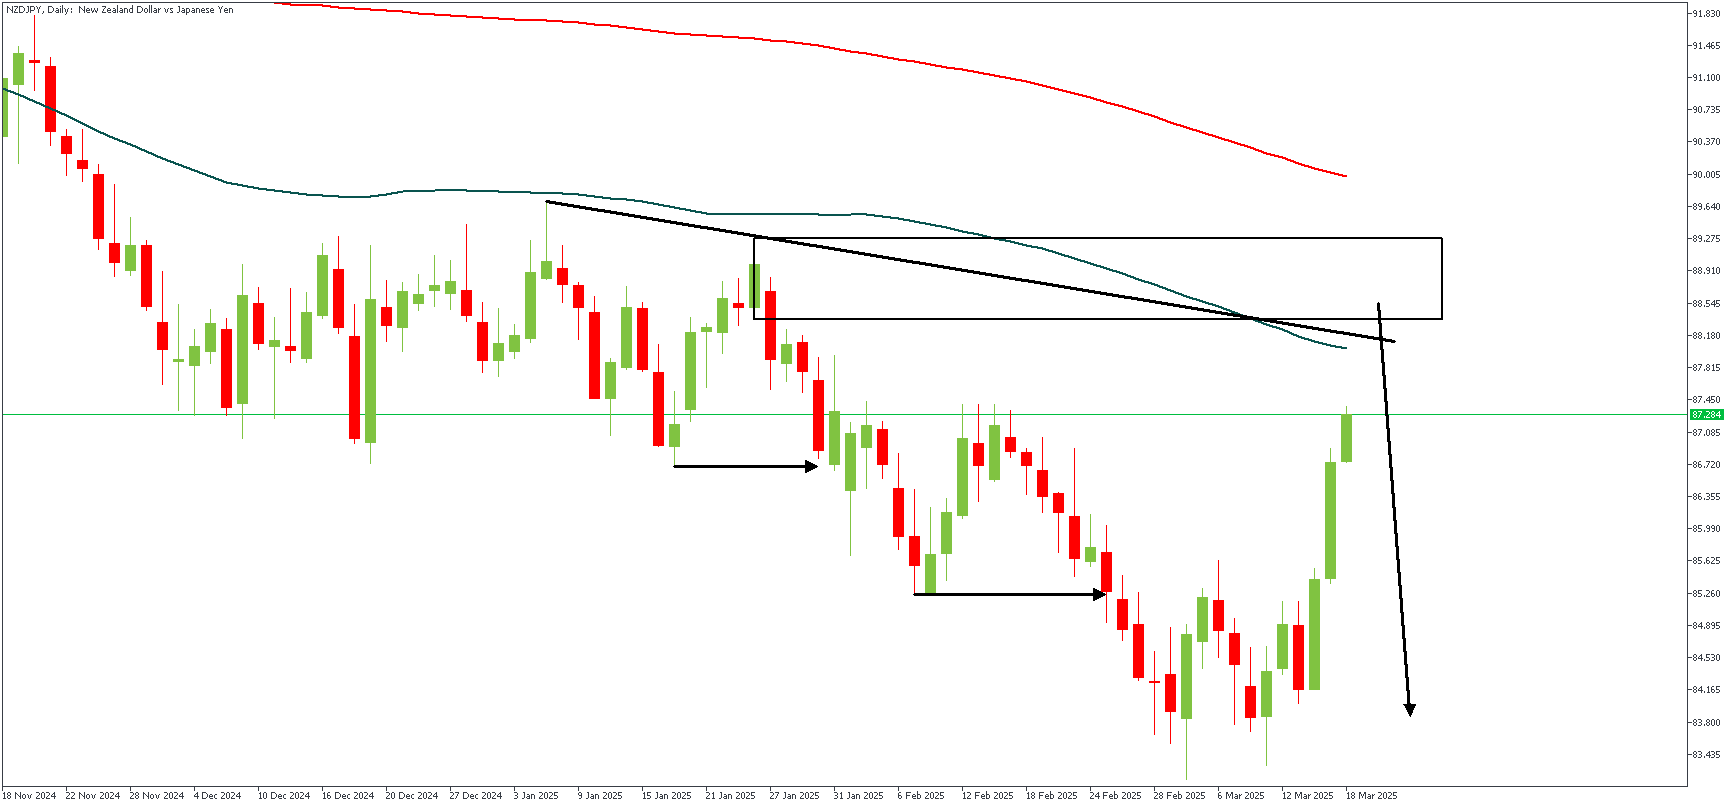
NZDJPY – D1 Timeframe
The bearish double break of structure on the daily timeframe chart of NZDJPY forms the initial basis for a bearish sentiment. In addition to the structure, we find that the descending order of the moving averages, the trendline resistance, and the 100-day moving average resistance provide the needed confluences to confirm the bearish outlook. The highlighted zone is the target area of entry.
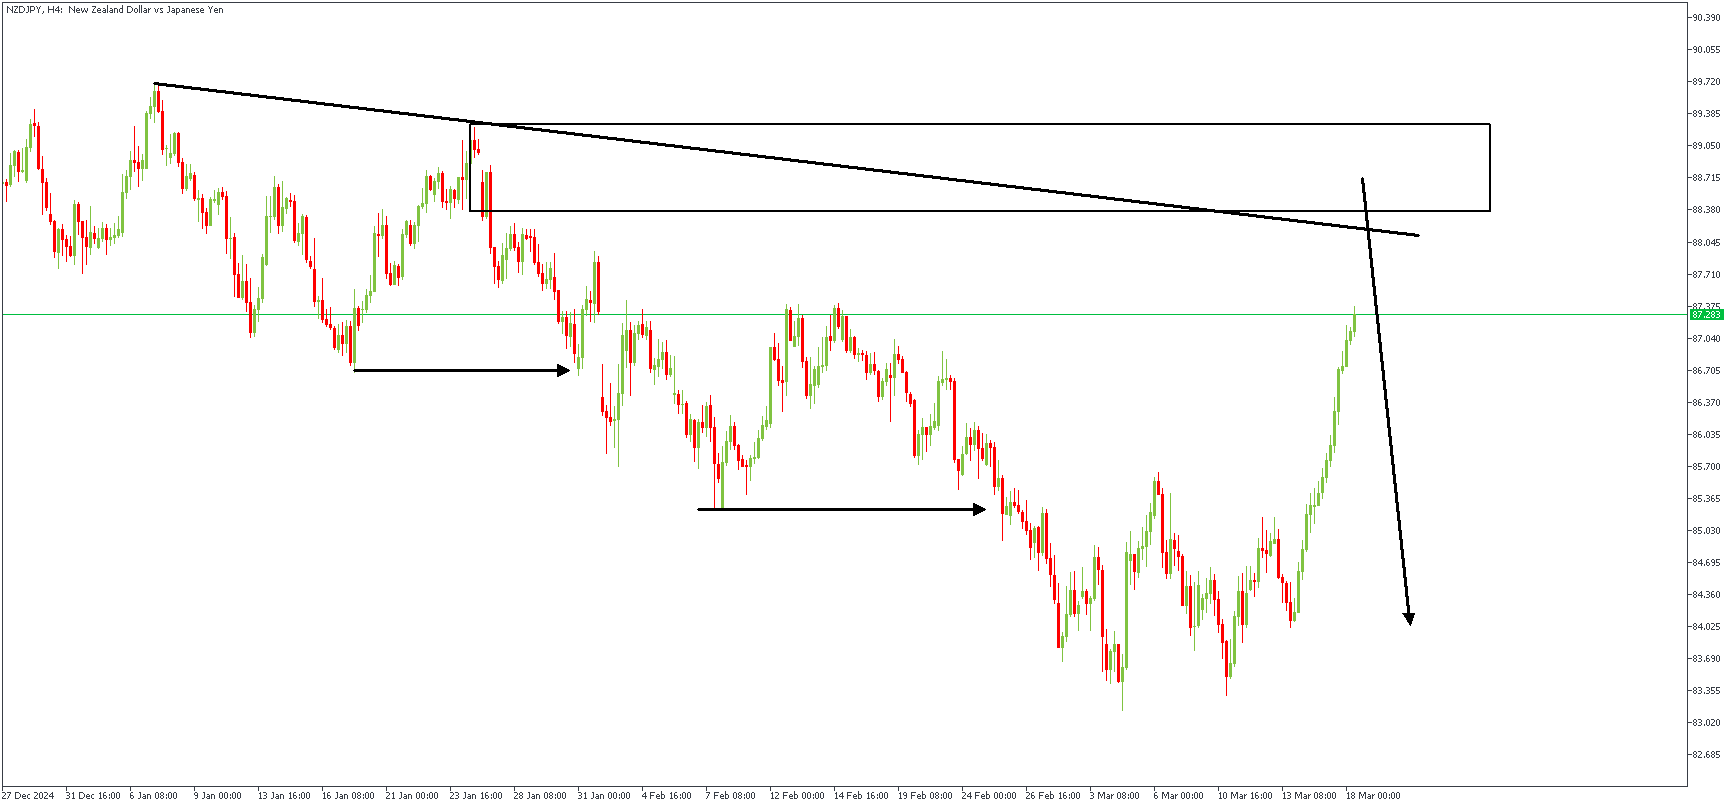
NZDJPY – H4 Timeframe
On the 4-hour timeframe chart of NZDJPY, we see the supply region more clearly, realizing that it falls within the 88% Fibonacci retracement region and can be trusted to usher in the necessary bearish momentum following a rejection from that zone.
Analyst’s Expectations:
- Direction: Bearish
- Target- 84.274
- Invalidation- 89.682
Sunset Market Commentary
Markets
Despite plenty of (geopolitical) headlines (call between Trump and Putin; debate/rumors on the structure of US reciprocal tariffs after April 2) there was no unequivocal theme to guide global markets. If anything, European and Asian risk sentiment remains constructive compared to a deteriorating sentiment on US markets. After rebounding yesterday, US equities again incur losses of up to 1.7% (Nasdaq) as investors still ponder the impact of Tariffs/Trump policy on US growth. US Treasury Secretary Bessent in an interview said he doesn’t see an indication of the US economy heading for recession. In line with comments from President Trump he rather sees the economy evolving in a transition phase from relying on government spending. US eco data published today confirmed recent trends. Hard activity data (February Industrial production +0.9% M/M, housing starts rebounding more than expected at 11.2% M/M) still suggest the US economy is doing OK. On the other hand, sentiment indicators (NY Fed services activity sentiment -19.3 from -10.5) continue to point to stagflation risks. At least for now, investors apparently tend to join the guidance from the sentiment indicators. The risk-off is dragging US yields lower after trading in green earlier in European dealings. US yields currently are trading little changed. Despite ongoing elevated uncertainty, US money markets don’t expect the Fed to profoundly change its wait-and-see assessment at tomorrow’s policy decision/press conference. The German yield curve again steepens (slightly) after yesterday’s correction with yields adding between 0.5 bp (2-y) and 2.5 bps (30-y) as the German Parliament is set to approve the loosening of the debt-break rules. Illustrating the change in investor appreciation of European markets, ZEW German expectations jumped from 26.0 to 51.6, the highest level since February 2022. The Eurostoxx 50 this afternoon also feels some negative spillovers from WS but still trades well in positive territory (+0.5%). There’s no clear trend in the core FX space. The DXY index this morning tested the recent lows near 103.22, but no sustained break occurred (yet). An early, risk-on driven rebound of EUR/USD to test the 1.095 area was also undone later in the session (currently 1.0915). At the same time, USD/JPY intraday is losing some momentum. The pair came within reach of the 150 barrier, but momentum currently is fading (149.6, yen safe have bid to resume?).
News & Views
Canadian inflation quickened way more than expected in February. Headline prices rose 1.1% m/m. The statistics agency said that “… the end of the goods and services tax (GST)/harmonized sales tax (HST) break partway through the month contributed notable upward pressure to prices for eligible products.” It resulted in yearly readings that vastly exceeded analyst estimates as well. The headline gauge sprinted from 1.9% to 2.6% (vs 2.2% expected) and core gauges accelerated from 2.7% to 2.9%. The Bank of Canada cut its policy rate to 2.75% last week. The central bank was expecting the tax changes to raise inflation but not to this extent. Today’s print already blew past the BoC’s 2.5% estimate … for March. The Canadian dollar only marginally profits though with USD/CAD hovering around 1.427. This should be seen against the backdrop of barely changed market expectations for policy easing. The BoC has put the onus on the trade war with the US. The surrounding uncertainty let alone its impact could weigh on economic growth and inflation, paving the way for further easing in April.
Jakub Seidler from the Czech central bank give his first interview since joining the monetary policy council three months ago. Seidler favours another pause at the March policy meeting (our preferred scenario), saying a cautious stance is legitimate in periods of high uncertainty due to topics ranging from tariffs over European defense spending plans to a still unfavourable structure of domestic inflation. Seidler noted that core inflation was slightly accelerating in monthly terms over the past three months. Services inflation showed a similar pattern and Seidler thinks the sector is growing more sensitive to rising salaries. Data earlier this month revealed wages growing faster than expected in 2024Q4 and are obviously not helping to sooth these concerns. Seidler says the CNB is also forced to take a closer look at items that they usually discard due to their volatile nature, such as food inflation. The recent period of double digit price rises made Czech consumers (and therefore their inflation expectations) more sensitive to it. The Czech currency reversed earlier losses to EUR/CZK 25.02 after the interview was released.
EUR/USD Mid-Day Outlook
Daily Pivots: (S1) 1.0884; (P) 1.0906; (R1) 1.0945; More...
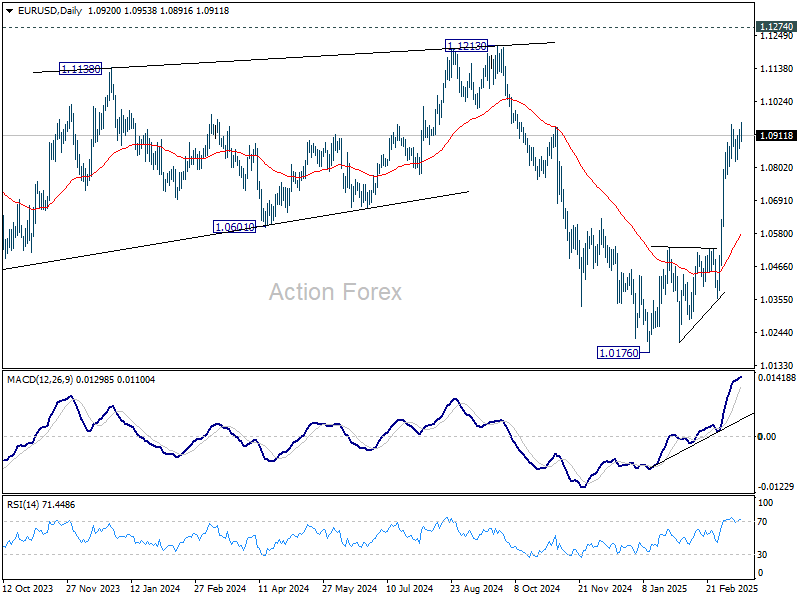
Intraday bias in EUR/USD is back on the upside with breach of 1.0946 resistance. Current rally from 1.0176 should target 1.1274 key resistance. On the downside, though, break of 1.0821 support will indicate short term topping, and turn bias back to the downside for deeper pullback.
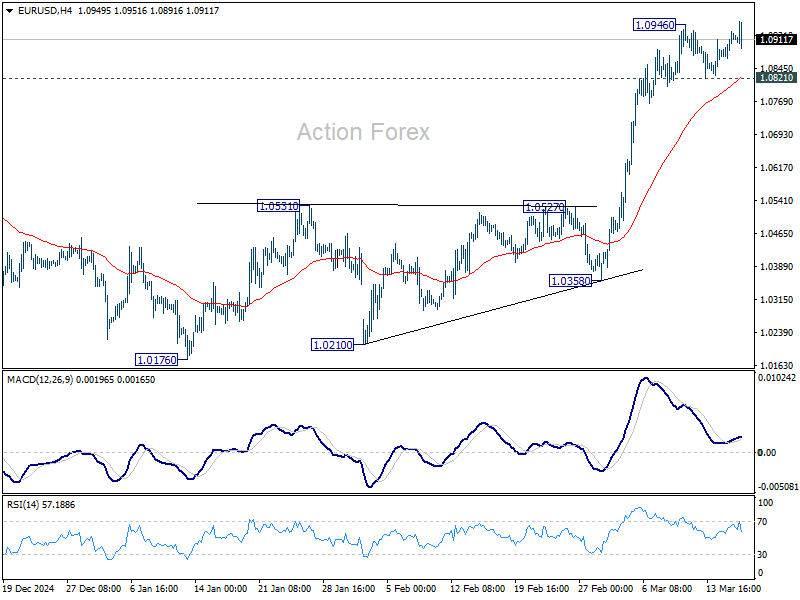
In the bigger picture, prior strong break of 55 W EMA (now at 1.0675) suggests that fall from 1.1274 (2024 high) has completed as a three wave correction to 1.0176. Rise from 0.9534 is still intact, and might be ready to resume. Decisive break of 1.1274 will target 100% projection of 0.9534 to 1.1274 from 1.0176 at 1.1916. Also, that will send EUR/USD through a multi-decade channel resistance will carries larger bullish implication. This will now be the favored case as long as 1.0531 resistance turned support holds.