
Sample Category Title
USD/CAD Daily Outlook
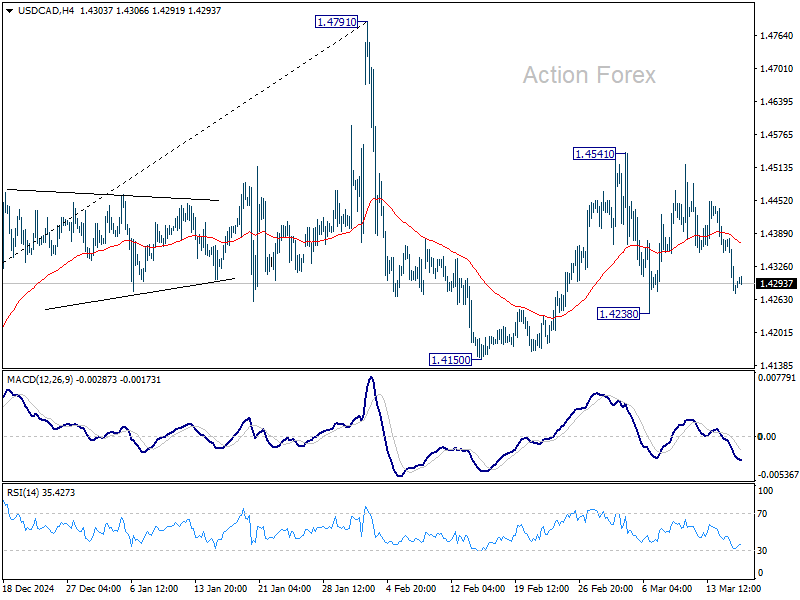
Daily Pivots: (S1) 1.4246; (P) 1.4315; (R1) 1.4355; More...
Intraday bias in USD/CAD stays neutral first as range trading continues. On the downside, break of 1.4238 support will argue that corrective pattern from 1.4791 has started the third leg already. Intraday bias will be back on the downside for 1.4150 support and below. On the upside, though, break of 1.4541 will resume the rebound from 1.4150, as the second leg of the pattern.
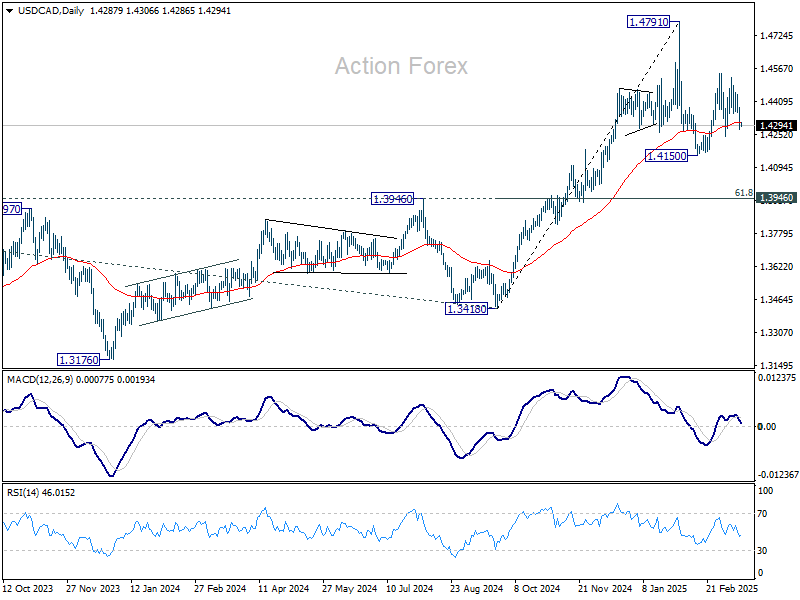
In the bigger picture, long term up trend is tentatively seen as resuming with prior breach of 1.4667/89 key resistance zone (2020/2015 highs). Next target is 100% projection of 1.2401 to 1.3976 from 1.3418 at 1.4993. This will remain the favored case as long as 1.3976 resistance turned support holds (2022 high), even in case of deep pullback.
AUD/USD Daily Report
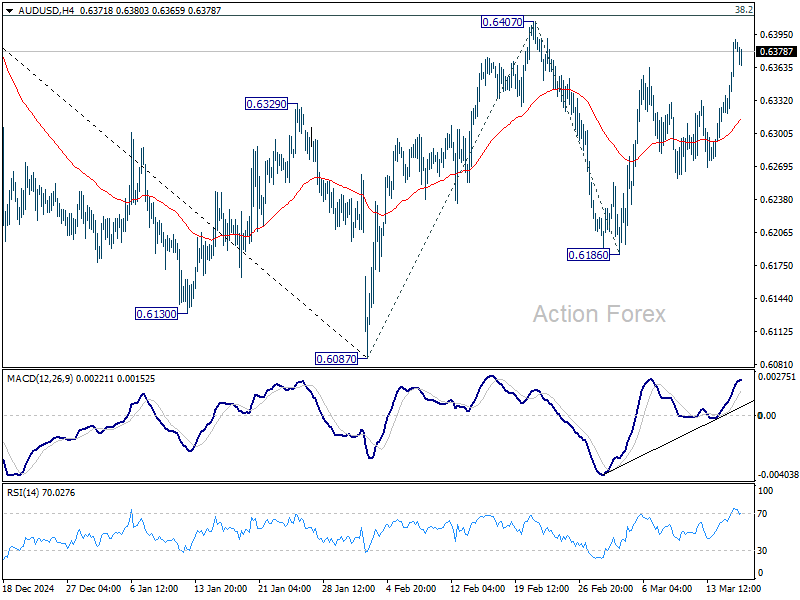
Daily Pivots: (S1) 0.6336; (P) 0.6364; (R1) 0.6412; More...
No change in AUD/USD's outlook and intraday bias stays neutral. On the upside, sustained break of 0.6407 will resume the rebound from 0.6087 to 100% projection of 0.6087 to 0.6407 from 0.6186 at 0.6506, even still as a corrective move. On the downside, break of 0.6186 will target 0.6087 support first.
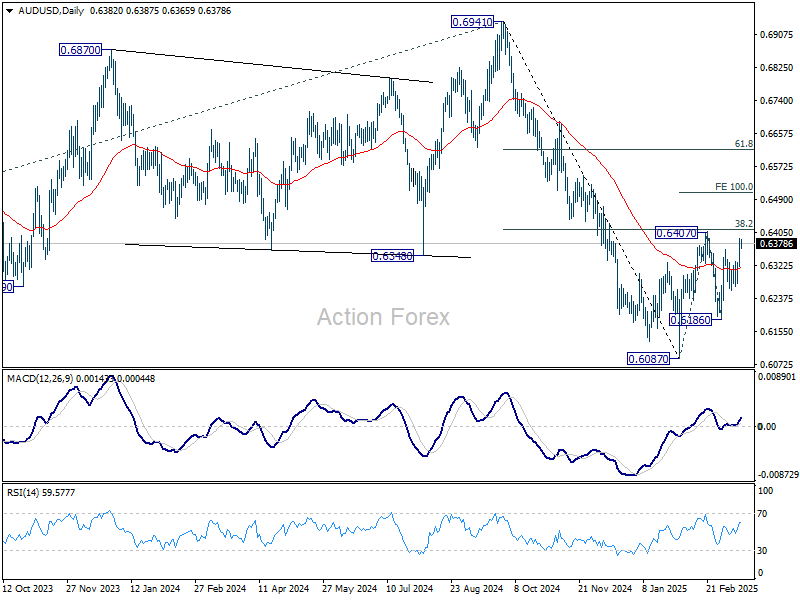
In the bigger picture, fall from 0.6941 (2024 high) is seen as part of the down trend from 0.8006 (2021 high). Next medium term target is 61.8% projection of 0.8006 to 0.6169 from 0.6941 at 0.5806. In any case, outlook will stay bearish as long as 55 W EMA (now at 0.6482) holds.
EUR/USD Daily Outlook
Daily Pivots: (S1) 1.0884; (P) 1.0906; (R1) 1.0945; More...
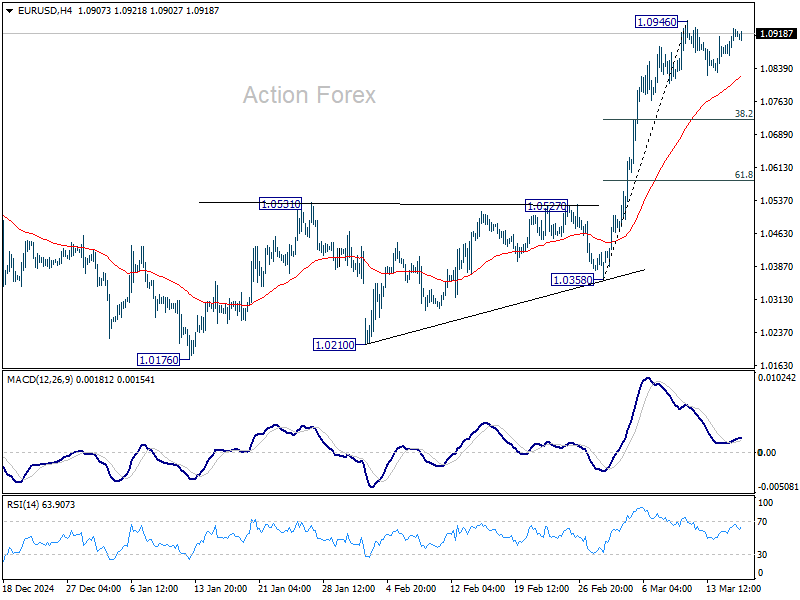
Intraday bias in EUR/USD remains neutral as consolidations continue below 1.0946. In case of another fall, downside should be contained by 38.2% retracement of 1.0358 to 1.0946 at 1.0721 to bring rebound. On the upside, break of 1.0946 will resume the rally from 1.0176 to retest 1.1274 key resistance.
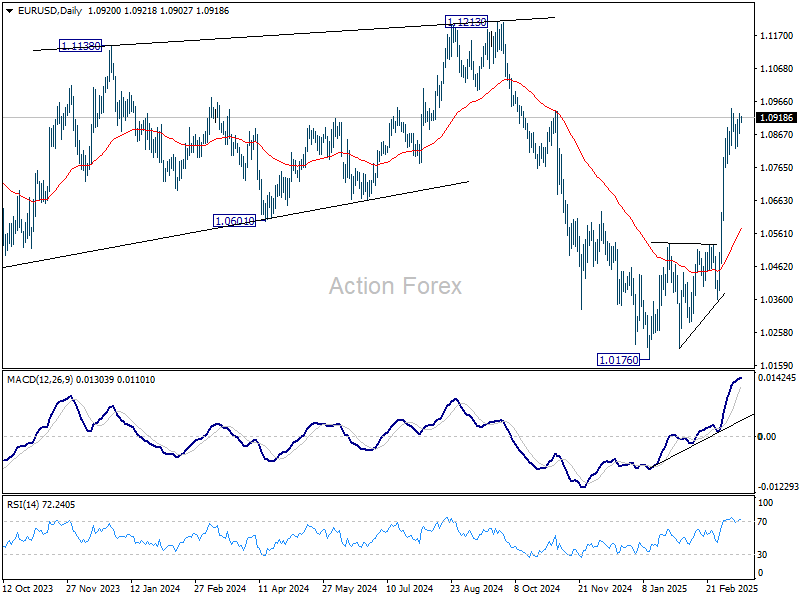
In the bigger picture, prior strong break of 55 W EMA (now at 1.0675) suggests that fall from 1.1274 (2024 high) has completed as a three wave correction to 1.0176. Rise from 0.9534 is still intact, and might be ready to resume. Decisive break of 1.1274 will target 100% projection of 0.9534 to 1.1274 from 1.0176 at 1.1916. Also, that will send EUR/USD through a multi-decade channel resistance will carries larger bullish implication. This will now be the favored case as long as 1.0531 resistance turned support holds.
GBP/USD Daily Outlook
Daily Pivots: (S1) 1.2940; (P) 1.2970; (R1) 1.3020; More...
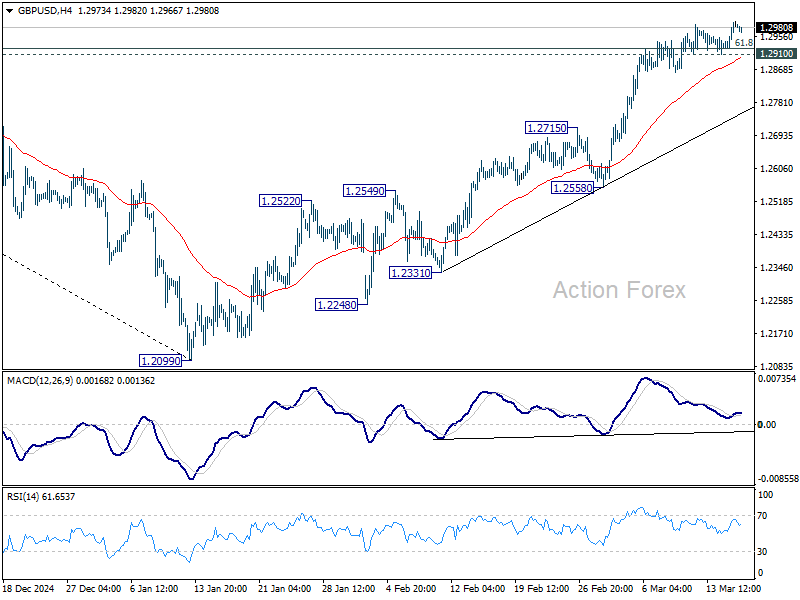
While upside momentum in GBP/USD is unconvincing as seen in 4H MACD, further rally is expected as long as 1.2910 support holds. Sustained trading above 61.8% retracement of 1.3433 to 1.2099 at 1.2923 will pave the way back to 1.3433 high. However, break of 1.2910 will indicate short term topping, and turn bias back to the downside for deeper pullback.
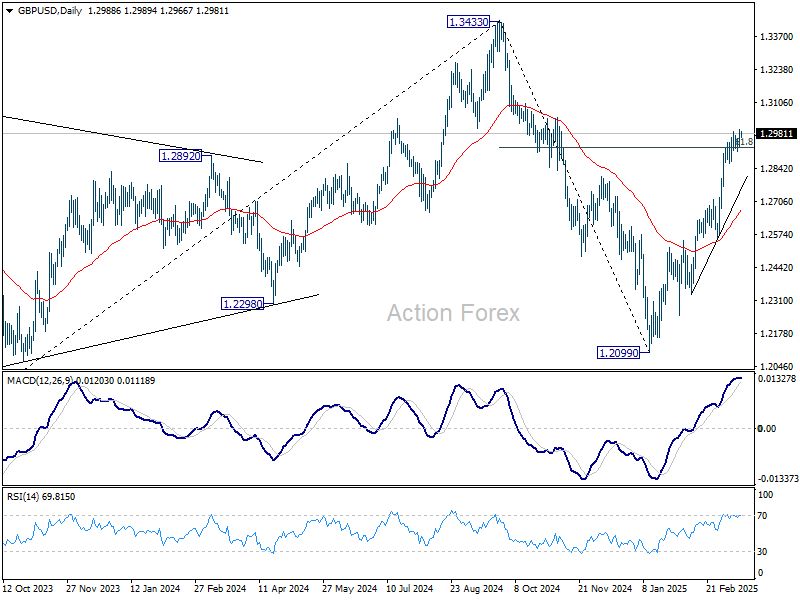
In the bigger picture, up trend from 1.3051 (2022 low) is not completed. Resumption is expected after corrective pattern from 1.3433 completes. Next target will be 1.4248 key resistance. This will now remain the favored case as long as 1.2099 support holds.
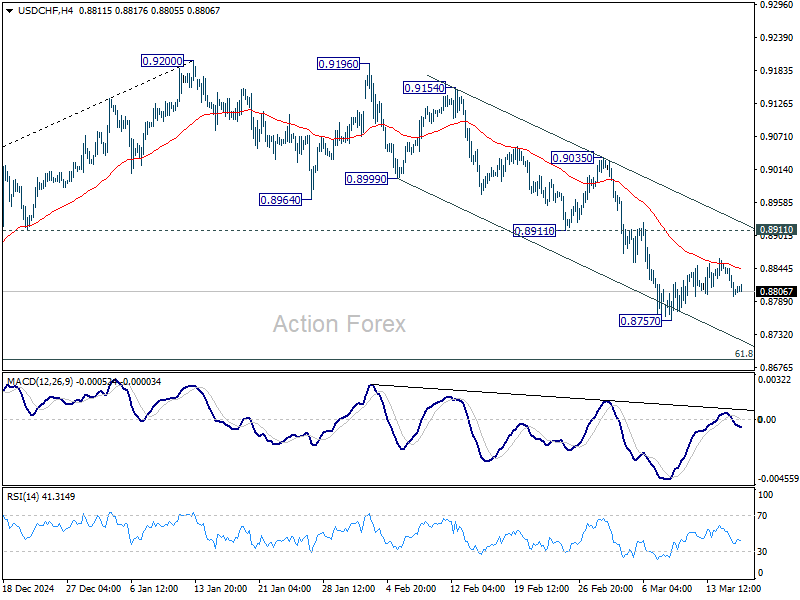
USD/CHF Daily Outlook
Daily Pivots: (S1) 0.8786; (P) 0.8821; (R1) 0.8844; More…
USD/CHF weakened after rejection by 55 4H EMA (now at 0.8844), but stays in range above 0.8757. Intraday bias stays neutral for the moment. In case of another recovery, upside should be limited by 0.8911 support turned resistance. On the downside, break of 0.8757 will resume the fall from 0.9200 to 61.8% retracement of 0.8374 to 0.9200 at 0.8690. Sustained break there will pave the way back to 0.8374 support.
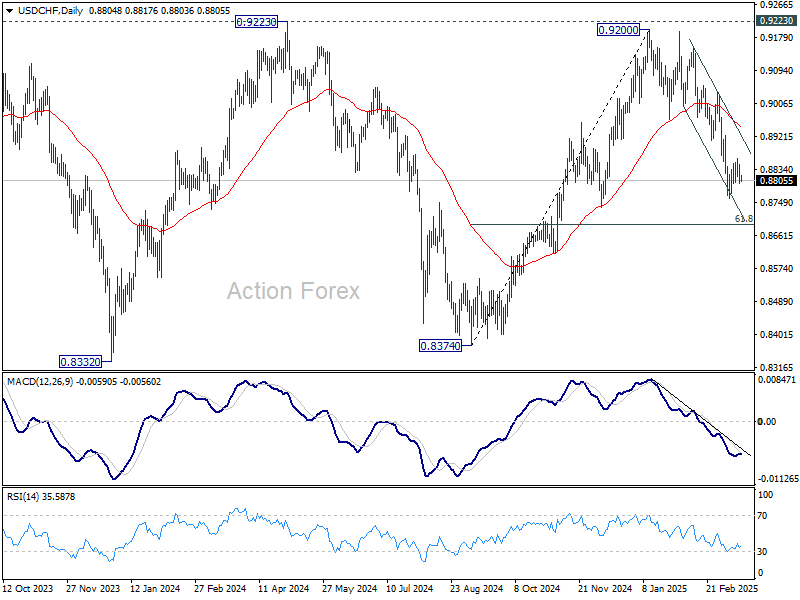
In the bigger picture, rejection by 0.9223 key resistance keep medium term outlook bearish. That is, larger fall from 1.0342 (2017 high) is not completed yet. Firm break of 0.8332 (2023 low) will confirm down trend resumption.
Vulnerable Optimism
US equities recovered for the second session on Monday, after a 10% selloff brought the S&P500 to the limit of the correction zone last Thursday. The rebound was backed by the-oversold conditions and mixed retail sales data released yesterday, showing that the retail sales in the US slowed in February but not collapsed. Moreover, the control-group sales, which excludes autos, gasoline, food services, and building materials (because these categories are highly volatile and feed into the PCE and GDP numbers) rose 1%, reversing the 1% slump of the month before. As such, yesterday’s data came to temper the recession calls for the US economy due to the tariff chao. The S&P500 gained 0.64% yesterday and was up by more than 3% compared to the March dip at some point, the Dow Jones advanced 0.85%, while the tech-heavy Nasdaq 100 underperformed with a 0.55% recovery, the Magnificent 7 stocks lost 1%. The loss of momentum among the tech giants and high valuations continue to weigh on appetite as uncertainties loom and growth expectations wane.
Speaking of growth expectations
The OECD released its latest growth forecasts on Monday and they didn’t look pretty. The OECD lowered its 2025 – 2026 growth forecasts for most leading economies, except for China. The predictions were lowered by a similar amount for the European economies than the US economy, Mexico and Canada suffered the biggest slump in growth projections. And the OECD pointed at the tariffs, the global trade restrictions and uncertainties as the main cause of slower global growth, and warned of higher inflation.
Interestingly, the EU military spending plans weren’t taken into account in the OECD numbers as much as they have been priced in by investors. The Select Stoxx Europe Aerospace & Defence ETF for example – including names like BAE Systems, Rheinmetall, Rolls-Royce and Airbus - gained 46% since the beginning of the year, as these companies are expected to benefit from the huge government spending that the EU governments will deploy to compensate the loss of military support from the US. German policymakers will vote today to pass a $500bn spending bill on infrastructure and defence– and if it passes, it will mark a big change regarding the European debt-control measures and austerity of the past decade!
The EU spending prospects sure push the European yields higher, but the prospects of high spending improves the European growth expectations – maybe not at the OECD but among investors – and the latter continues to support the euro’s appreciation against the US dollar.
Plus, there is growing hope that the US’ efforts to broker a peace deal between Russia and Ukraine will be successful - a development that could restore trade relations between Russia and the EU, ease energy prices in Europe and support growth. Trump and Putin are due to speak today.
The Fed
The Federal Reserve (Fed) begins its two-day policy meeting today with soft but not collapsing employment and sales data, softer-than-expected but still near 3% inflation, and a high level of uncertainty and tariff-led volatility in its hands. The Fed is expected to maintain its rates unchanged. The dot plot and Powell’s press conference will be closely watched by investors. Economists predict two rate cuts for the remainder of the year, traders see three. Some analysts also think that pausing the QT could be an interesting move for relaxing the financial conditions without touching the rates. Powell had said in a recent press conference that the US economy remains on a solid footage – a prediction that’s not shared by Atlanta Fed’s GDPNow forecast that warns that the US economy could shrink by more than 2% in the Q1.
A dovish Fed outlook supports further dollar depreciation, while a more conservative stance could hurt growth prospects, also weighing on the greenback. The only thing that could revive USD appetite is an explicit signal from the Fed that it’s ready to step in if economic growth faces a serious threat. Voilà. This sets up EUR/USD for a solid shot at clearing the 1.10 resistance, though overbought conditions could hinder a sustained breakout in the short run.
Buffet loves Japanese stocks
The Bank of Japan (BoJ) is also expected to maintain its rates unchanged when it announces its decision tomorrow. The rise in the Japanese yields have been accelerating along with the European peers since the start of the year. The 10-year JGB yield stands near 1.50% while it was fluctuating around 20 and 60bp this time last year. Shorting the dollar against the yen has been a profitable trade so far this year.
Although the rising borrowing costs and the stronger yen weigh on the Japanese stock valuations, Warren Buffett increased his stake in 5 of Japan’s leading names: Mitsui, Mitsubishi, Sumitomo and Itochu.
German Fiscal Package Anticipated to Secure Bundestag Approval
In focus today
Today, the German fiscal package is scheduled to be passed in the Bundestag and on Friday in the Bundesrat, with expectations for approval. Merz states that CDU/CSU unanimously support the proposal, although there are risks that some may not vote in favour and that Bavaria's 'Free Voters' might not provide their support in the Bundesrat on Friday.
In the US, President Trump has announced that he will be speaking with Russian President Putin about ending the war in Ukraine. The talk will presumably be on land concessions by Ukraine along with powerplants as mentioned by President Trump previously. Ukraine has already agreed to a 30-day ceasefire proposal.
Overnight, the Bank of Japan will conclude a two-day policy meeting with a rate decision. Anything but hold would be a big surprise after the January rate hike, trade war tensions and a stronger yen, which will serve to dampen imported inflation. With the outlook for another significant wage bump this year, we anticipate the BoJ will find room to hike rates again over the summer.
Economic and market news
What happened overnight
In the Middle East, Isreal launched its largest attack since the ceasefire in January, striking multiple Hamas targets. The strikes are a response to Hamas's refusal to release the remaining hostages, according to the office of Israeli Prime Minister Netanyahu. The US White House was consulted prior to the strike.
What happened yesterday
In the US, February retail sales data sent mixed signals. Retail sales control group was up 1% (cons: 0.3%) compared to -0.9% in January. On the flip side, headline retail sales growth remained weak in February at 0.2% m/m SA from -0.9% in January. Excluding the most volatile categories improved the picture, with control group sales growth accelerating to 1.0% m/m SA from -1.0%. However, unusually positive seasonal adjustment lifted the monthly growth rate significantly. Looking at the y/y growth rate of the non-seasonally adjusted series shows that control group sales growth actually slowed down quite a bit (+0.3% y/y, from +4.1%, see chart below). EUR/USD ticked slightly lower following the release.
In China, the data covering January and February was released. The data showed a decent start to the new year albeit still with a few weak spots. Industrial production surprised to the upside rising 5.9% y/y (cons: 5.3% y/y). The momentum in production explains the rise in metal prices recently. However, more importantly there were tentative signs of improvement to demand as this is the real driver of the economy. Retail sales increased 4% y/y (cons: 3.8% y/y). There is still some way up to the 7-8% pre-pandemic levels, though, and lifting private consumption is now the number one priority for the government.
Equities: Global equities were broadly higher yesterday, with some major US indices achieving the first two-day gain for the S&P 500 since it reached its record close on 19 February. This is certainly positive news, and we have already seen pundits suggesting the correction is over. It is remarkable how swiftly situations can reverse in the equity market and how quickly perspectives can change simply because Bloomberg screens shift from red to green. We would argue that we did not receive reassuring macroeconomic data yesterday; in fact, the opposite was true, and we still view 2 April as a crucial uncertainty deadline due to impending tariff increases.
Additionally, it is important to consider sector and regional performance from yesterday. Defensive stocks outperformed in the US, while the MAG 7 stocks significantly underperformed compared to the broader 493 index. Europe and Asia also outperformed, and the same trend is visible today in the futures and cash markets. In other words, some investors are attempting to buy the dip, a strategy that has been highly profitable over the past two and a half years. We continue to recommend exercising caution, as the combination of macroeconomic factors and politics has not yet demonstrated a positive outlook for the future. In the US yesterday, the Dow rose by 0.9%, the S&P 500 by 0.6%, the Nasdaq by 0.3%, and the Russell 2000 by 1.2%. In Asia, most markets are higher this morning, led by a new year-to-date high in the Hang Seng index. Conversely, Indonesia's economy is struggling, with growth fears leading to a sell-off and a temporary halt in trading this morning. European futures are higher ahead of the decisive voting in the Bundestag today. US futures are lower this morning.
FI&FX: Bond yields slipped on both sides of the Atlantic yesterday ahead of the vote on the German fiscal package today and on a relatively quiet day when risk sentiment held up amid solid retail sales data in the US. EUR/USD traded around the 1.09 level and the top from last week. EUR/SEK held steady just above 11.00 as the market digested the outlook for increased government borrowing amid a coming rise in defence spending.
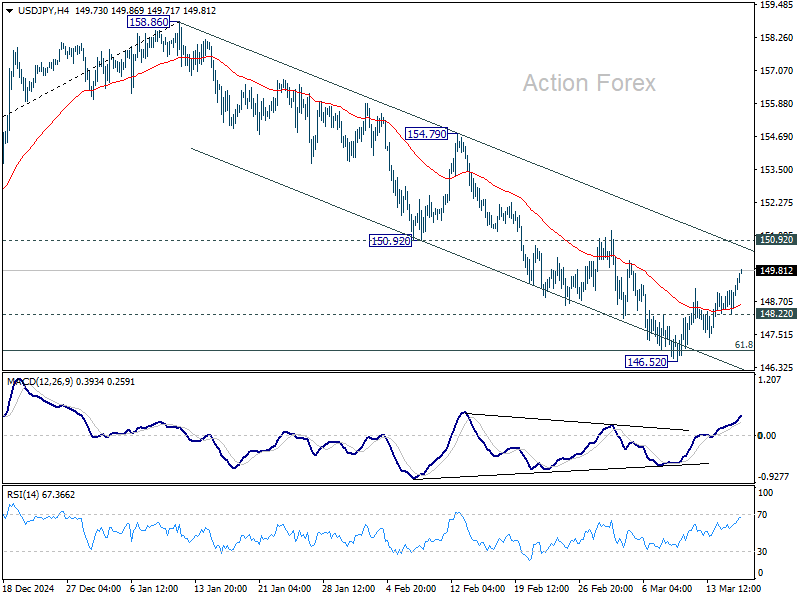
USD/JPY Daily Outlook
Daily Pivots: (S1) 147.89; (P) 148.45; (R1) 149.20; More...
Intraday bias in USD/JPY stays neutral at this point. While recovery from 146.52 might extend further, upside should be limited by 150.92 support turned resistance. On the downside, below 148.22 minor support will bring retest of 146.52 low first. Sustained trading below 61.8% retracement of 139.57 to 158.86 at 146.32 will pave the way to 139.57 support. However, decisive break of 150.92 will dampen this bearish view and turn bias to the upside for 154.79 resistance instead.
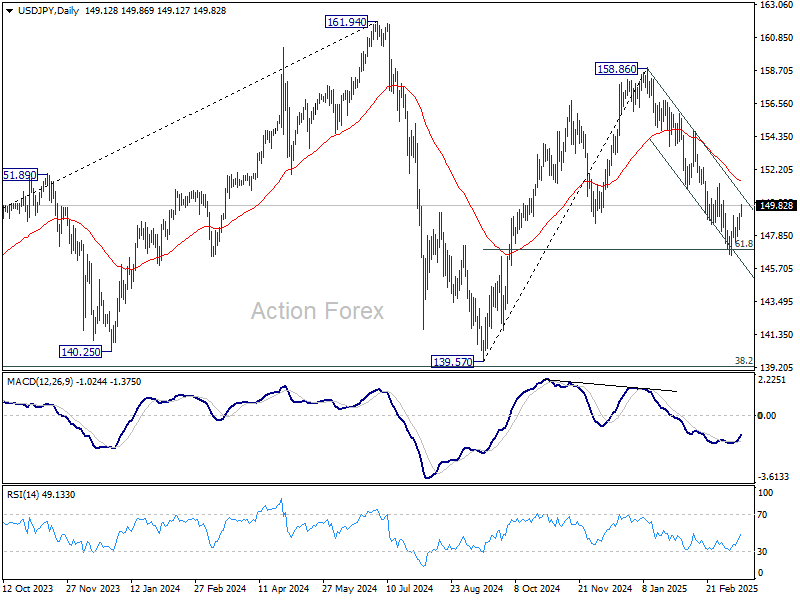
In the bigger picture, price actions from 161.94 are seen as a corrective pattern to rise from 102.58 (2021 low), with fall from 158.86 as the third leg. Strong support should be seen from 38.2% retracement of 102.58 to 161.94 at 139.26 to bring rebound. However, sustained break of 139.26 would open up deeper medium term decline to 61.8% retracement at 125.25.
Asian Markets Stay Firm, German Vote and Canadian Inflation in Focus
Risk appetite in Asian markets has been solid this week, support by optimism surrounding China's latest measures to boost domestic consumption. Hong Kong stocks continue to lead gains in the region. Meanwhile, in the forex markets, both New Zealand and Australian Dollars are holding firm, though the Aussie is slightly lagging due to rising trade tensions with the US. As tariff threats continue to evolve, the Australian economy is relatively more vulnerable to disruptions in trade, keeping a cap on the currency’s momentum. Meanwhile,
Japanese Yen has weakened notably, weighed down by the prevailing risk-on sentiment in the region. Additionally, traders are solidifying expectations that BoJ will keep rates unchanged in this week’s policy decision, leaving any rate hike for future meetings. Though, any hints from Governor Kazuo Ueda about the timing of future hikes could rejuvenate Yen's rebound. .
In Europe, attention turns to Germany, where ZEW economic sentiment index is expected to show early signs of optimism surrounding the incoming government’s EUR 500B infrastructure and defense spending plan. Also, Chancellor-in-waiting Friedrich Merz faces a crucial parliamentary vote on this plan today, and while it is broadly expected to pass, there remains an outside risk of legal intervention. The far-right Alternative für Deutschland party has challenged the speed of the legislation’s introduction. Merz might get the court's verdict soon.
Meanwhile, Canada’s inflation data will be in focus, as markets assess BoC’s next policy steps, which are heavily complicated by trade war. OECD has significantly downgraded Canada’s growth forecast, citing trade war risks and economic fallout from US tariffs. However, OECD also warned of inflationary pressures, suggesting that if Canada faces 25% retaliatory tariffs from the US, borrowing costs could stay higher for longer. This places the BoC in a difficult position, as it must balance slowing growth with the risk of persistent price pressures.
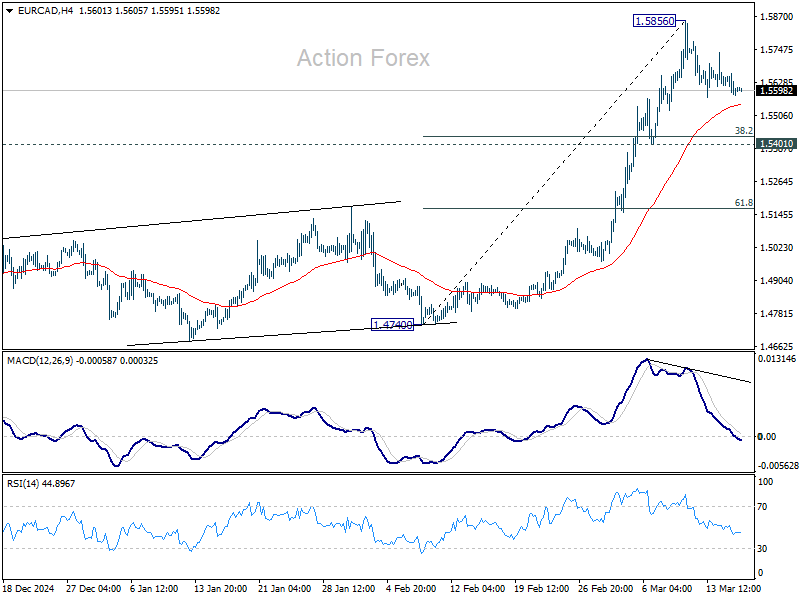
Technically, EUR/CAD should have formed a short term top at 1.5856 on bearish divergence condition in 4H MACD. Deeper retreat might be seen to 55 4H EMA (now at 1.5548). But downside should be contained by 1.5401 cluster support (38.2% retracement of 1.4740 to 1.5856 at 1.5430 to bring rebound. Larger up trend is expected to resume through 1.5856 at a later stage.
In Asia, at the time of writing, Nikkei rose 1.23%. Hong Kong HSI is up 2.12%. China Shanghai SSE is up 0.14%. Singapore Strait Times is up 1.12%. Japan 10-year JGB yield is up 0.0.007 at 1.510. Overnight, DOW rose 0.85%. S&P 500 rose 0.64%. NASDAQ rose 0.31%. 10-year yield fell -0.002 to 4.306.
RBA’s Hunter cautious on further rate cuts, Treasurer warns of trade war's indirect impacts
RBA Chief Economist and Assistant Governor Sarah Hunter reinforced the central bank’s cautious stance on further rate cuts. She emphasized in a speech today that while the February cut was deemed an appropriate time to "take some restrictiveness away", the Board were "more cautious than the market about prospects for further easing".
Hunter highlighted that US policy settings and their impact on the global economy as "one of the things we are focused on right now.
She added that policy decisions are always made in uncertain environments, where the baseline forecast is just one of many possible scenarios rather than a strict roadmap for future moves. The link between economic forecasts and rate decisions is "not mechanical".
Separately, Australian Treasurer Jim Chalmers acknowledged that the direct impact of US tariffs on Australia is "concerning, but manageable". But he warned that the larger risk lies in a broader global trade war. He described the current environment as a “new world of uncertainty”, where the spillover effects from rising trade tensions could have far-reaching consequences for Australia’s economy.
Gold extends record run above 3000 on geopolitical and trade risks
Gold surged further above the 3000 psychological level today, extending its record-breaking rally as geopolitical uncertainty, trade tensions, and global monetary easing continue to fuel demand.
Trade tensions remain front and center with investors are piling into the precious metal ahead of the April 2 deadline, when reciprocal and sectoral tariffs will take effect on US trading partners. US President Donald Trump reinforced his stance, declaring that the new tariffs would mark "liberation day" for the US, with broader reciprocal tariffs and sector-specific duties, particularly on steel and aluminum used in auto production.
Meanwhile, attention is also on Trump’s call with Russian President Vladimir Putin today, where discussions will reportedly cover territorial issues and energy infrastructure, likely including Ukraine’s Zaporizhzhia nuclear plant. Any escalation or breakthrough in these discussions could have broader implications for markets,
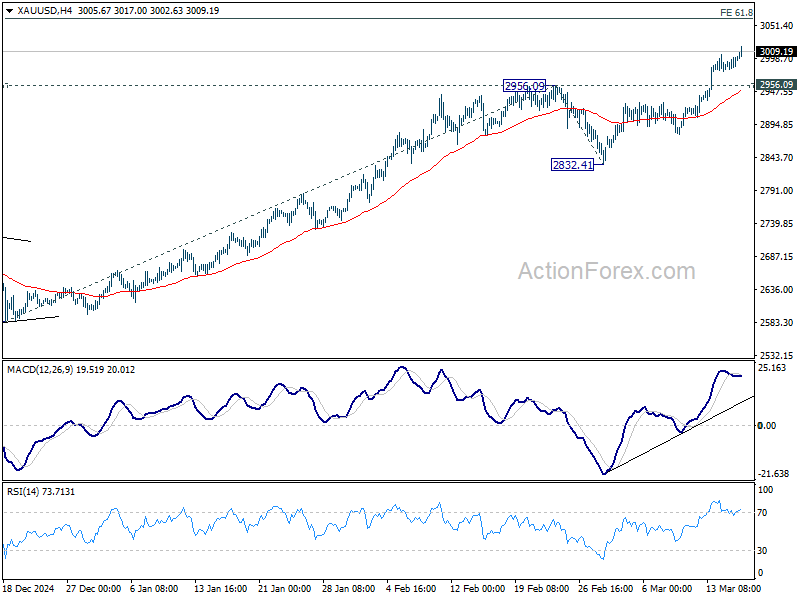
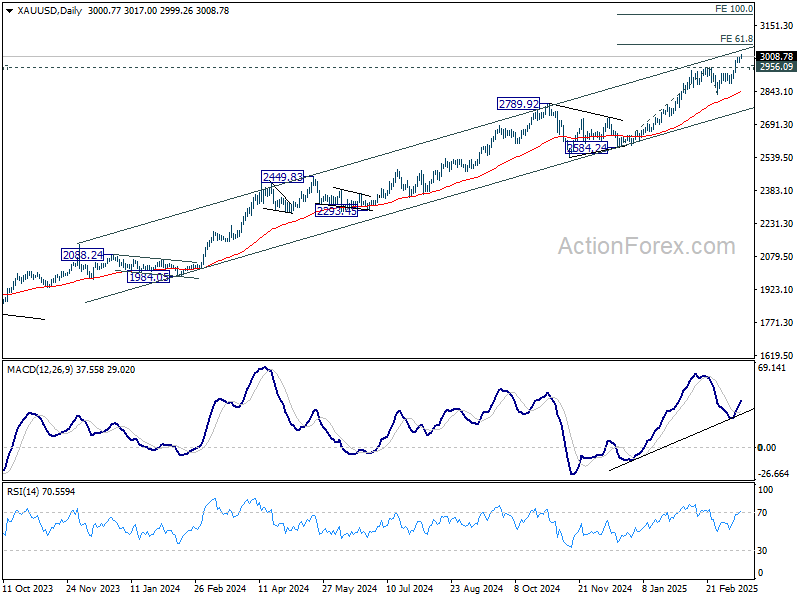
Technically, Gold's up trend remains on track to 61.8% projection of 2584.24 to 2956.09 from 2832.41 at 3062.21. which is close to the medium-term channel resistance.
Rejection by the resistance zone, followed by break of 2956.09 resistance turned support will risk a correction back towards 55 D EMA (now at 2841.83) first.
However, strong break above the channel resistance would prompt acceleration in Gold’s uptrend. In such a scenario, gold could quickly reach 100% projection at 3204.26.
Looking ahead
Swiss SECO economic forecasts, German ZEW economic sentiment, and Eurozone trade balance will be released in European session. Later in the day, Canada CPI will be the main focus. US will publish housing starts and building permits, import prices, and industrial production.
USD/JPY Daily Outlook
Daily Pivots: (S1) 147.89; (P) 148.45; (R1) 149.20; More...
Intraday bias in USD/JPY stays neutral at this point. While recovery from 146.52 might extend further, upside should be limited by 150.92 support turned resistance. On the downside, below 148.22 minor support will bring retest of 146.52 low first. Sustained trading below 61.8% retracement of 139.57 to 158.86 at 146.32 will pave the way to 139.57 support. However, decisive break of 150.92 will dampen this bearish view and turn bias to the upside for 154.79 resistance instead.
In the bigger picture, price actions from 161.94 are seen as a corrective pattern to rise from 102.58 (2021 low), with fall from 158.86 as the third leg. Strong support should be seen from 38.2% retracement of 102.58 to 161.94 at 139.26 to bring rebound. However, sustained break of 139.26 would open up deeper medium term decline to 61.8% retracement at 125.25.
Gold extends record run above 3000 on geopolitical and trade risks
Gold surged further above the 3000 psychological level today, extending its record-breaking rally as geopolitical uncertainty, trade tensions, and global monetary easing continue to fuel demand.
Trade tensions remain front and center with investors are piling into the precious metal ahead of the April 2 deadline, when reciprocal and sectoral tariffs will take effect on US trading partners. US President Donald Trump reinforced his stance, declaring that the new tariffs would mark "liberation day" for the US, with broader reciprocal tariffs and sector-specific duties, particularly on steel and aluminum used in auto production.
Meanwhile, attention is also on Trump’s call with Russian President Vladimir Putin today, where discussions will reportedly cover territorial issues and energy infrastructure, likely including Ukraine’s Zaporizhzhia nuclear plant. Any escalation or breakthrough in these discussions could have broader implications for markets,
Technically, Gold's up trend remains on track to 61.8% projection of 2584.24 to 2956.09 from 2832.41 at 3062.21. which is close to the medium-term channel resistance.
Rejection by the resistance zone, followed by break of 2956.09 resistance turned support will risk a correction back towards 55 D EMA (now at 2841.83) first.
However, strong break above the channel resistance would prompt acceleration in Gold’s uptrend. In such a scenario, gold could quickly reach 100% projection at 3204.26.